

Abstract
Key points
Fructose‐containing sugars, including sucrose and high fructose corn syrup (HFCS), have been implicated in the epidemics of obesity and type 2 diabetes.
Few studies have evaluated the impact of perinatal exposure to these sugars on metabolic and physiological outcomes in the offspring.
Using a rat model, offspring exposed to a maternal sucrose or HFCS diet during the prenatal and/or suckling periods were found to have altered adiposity and liver fat content and composition at weaning.
Plasma levels of free fatty acids remained elevated in young adulthood, but consumption of a control diet following weaning appeared to ameliorate most other effects of perinatal exposure to a maternal high‐sugar diet.
Guidelines for maternal nutrition should advise limiting consumption of fructose‐containing sugars, and it is particularly important that these recommendations include maternal nutrition during lactation.
Abstract
Perinatal exposure to excess maternal intake of added sugars, including fructose and sucrose, is associated with an increased risk of obesity and type 2 diabetes in adult life. However, it is unknown to what extent the type of sugar and the timing of exposure affect these outcomes. The aim of this study was to determine the impact of exposure to maternal consumption of a 10% (w/v) beverage containing sucrose or high fructose corn syrup‐55 (HFCS‐55) during the prenatal and/or suckling periods on offspring at 3 and 12 weeks, utilising a cross‐fostering approach in a rodent model. Perinatal sucrose exposure decreased plasma glucose concentrations in offspring at 3 weeks, but did not alter glucose tolerance. Increased adiposity was observed in 3‐week‐old offspring exposed to sucrose or HFCS‐55 during suckling, with increased hepatic fat content in HFCS‐55‐exposed offspring. In terms of specific fatty acids, hepatic monounsaturated (omega‐7 and ‐9) fatty acid content was elevated at weaning, and was most pronounced in sucrose offspring exposed during both the prenatal and suckling periods, and HFCS‐55 offspring exposed during suckling only. By 12 weeks, the effects on adiposity and hepatic lipid composition were largely normalised. However, exposure to either sucrose or HFCS‐55 during the prenatal period only was associated with elevated plasma free fatty acids at weaning, and this effect persisted until 12 weeks. This study suggests that the type of sugar and the timing of exposure (prenatal or suckling periods) are both important for determining the impact on metabolic health outcomes in the offspring.
Keywords: developmental programming, high fructose corn syrup, sucrose
Key points
Fructose‐containing sugars, including sucrose and high fructose corn syrup (HFCS), have been implicated in the epidemics of obesity and type 2 diabetes.
Few studies have evaluated the impact of perinatal exposure to these sugars on metabolic and physiological outcomes in the offspring.
Using a rat model, offspring exposed to a maternal sucrose or HFCS diet during the prenatal and/or suckling periods were found to have altered adiposity and liver fat content and composition at weaning.
Plasma levels of free fatty acids remained elevated in young adulthood, but consumption of a control diet following weaning appeared to ameliorate most other effects of perinatal exposure to a maternal high‐sugar diet.
Guidelines for maternal nutrition should advise limiting consumption of fructose‐containing sugars, and it is particularly important that these recommendations include maternal nutrition during lactation.
Abbreviations
- AUC
area under the curve
- FFA
free fatty acid
- HDL
high‐density lipoprotein
- HFCS
high fructose corn syrup
- IPGTT
intraperitoneal glucose tolerance test
- LDL
low‐density lipoprotein
- MUFA
monounsaturated fatty acid
- NAFLD
non‐alcoholic fatty liver disease
- PUFA
polyunsaturated fatty acid
- SCD
stearoyl‐CoA desaturase
- SFA
saturated fatty acid
- SSB
sugar‐sweetened beverage
- T2DM
type 2 diabetes mellitus
- TG
triglyceride
- WHO
World Health Organization
Introduction
The global epidemic of obesity and type 2 diabetes mellitus (T2DM) remains a major public health issue. In 2014, almost 2 billion adults were classified as overweight or obese (39% and 13% of the world's population, respectively), and 9% of adults world‐wide had been diagnosed with T2DM (WHO, 2014). Numerous epidemiological, clinical and experimental animal studies have demonstrated that the nutritional environment that an individual is exposed to before birth and/or in early infancy is a critical determinant of their risk of developing obesity and metabolic diseases over their life course (Hales & Barker, 1992; Mcmillen & Robinson, 2005). Exposure to maternal obesity or over‐nutrition during critical windows of development is associated with altered development of key physiological systems, resulting in an increased risk of obesity and poor metabolic health in adult life (Taylor & Poston, 2007; Alfaradhi & Ozanne, 2011). While the negative impacts of early life over‐nutrition have been well described, the role of specific nutritional components and the critical periods during which exposure is most detrimental remain poorly understood.
Consumption of excess added sugars, i.e. sugars/syrups added to foods and beverages as sweeteners, has been identified as a major factor contributing to the epidemic of obesity and T2DM (Johnson et al. 2009). This prompted the World Health Organization (WHO) in 2015 to release recommendations that added sugars should contribute less than 10%, and preferably less than 5%, to total energy intake (WHO, 2015). Despite this, a significant proportion of the population continue to consume considerably over this amount, with sugar‐sweetened beverages (SSBs) representing a major contributor to sugar intake (Johnson et al. 2009). The two added sugars most commonly used in SSBs are sucrose (fructose/glucose disaccharide 50:50) and high fructose corn syrup (HFCS; most commonly HFCS‐55; fructose/glucose monosaccharides 55:42). Both of these sweeteners contain similar amounts of fructose, a nutrient that has been implicated in the development of a number of metabolic abnormalities, including insulin resistance, inflammation, dyslipidaemia and obesity, in both humans and animals (Lustig, 2013; Regnault et al. 2013; Stanhope et al. 2013; Toop & Gentili, 2016), but have subtly different amounts of glucose. The key difference between these sugars, however, is their chemical structure. Sucrose (a disaccharide) must be hydrolysed prior to absorption, whereas the fructose and glucose in HFCS‐55 already exist as monosaccharides that can be absorbed without the need for enzymatic processing, which may have significant implications for their intestinal absorption (Tappy, 2015).
While excess consumption of both sucrose and HFCS‐55 has been associated with the development of obesity and metabolic disease in adults, much less is known about the effect of maternal consumption of these fructose‐containing sugars during pregnancy and/or lactation on the developing offspring. In addition, there are currently no specific recommendations regarding maternal consumption of added sugars during pregnancy or breast‐feeding. Rodent studies have begun to shed light on some of the adverse short‐ and long‐term effects of developmental exposure to maternal consumption of pure fructose on the metabolic health of the offspring (Alzamendi et al. 2010; Vickers et al. 2011; Mukai et al. 2014; Clayton et al. 2015; Rodríguez et al. 2015, 2016; Sarı et al. 2015), and this has been the subject of several reviews (Goran et al. 2013; Regnault et al. 2013; Sloboda et al. 2014). However, relatively few studies have investigated the effects of developmental exposure to fructose‐containing sugars, sucrose or HFCS‐55 (Bocarsly et al. 2012; D'Alessandro et al. 2012, 2014; Samuelsson et al. 2013; Kendig et al. 2015). This is important given that fructose is rarely consumed in isolation, and therefore, studies investigating sucrose and HFCS‐55 are more physiologically relevant. In addition to the specific nature of the developmental insult, it is becoming increasingly clear that the timing of the insult is also critical for determining its programming effects. A number of rodent studies have shown that the long‐term programming effects of exposure to a specific nutritional insult during the prenatal period differs from exposure to the same insult during suckling (Armitage et al. 2005). Thus, it is important to determine the effects of exposure to maternal consumption of fructose‐containing sugars during the prenatal and suckling periods alone, in addition to investigating the impact of exposure during the entire perinatal period.
To our knowledge, no previous studies have compared the effects of exposure to sucrose or HFCS‐55 during specific critical windows of development on the short‐ and longer‐term metabolic and physiological outcomes in the offspring. Although studies have shown that developmental exposure to fructose results in the accumulation of intrahepatic fat and/or increased expression of hepatic lipogenic genes in offspring (Mukai et al. 2012; Rodríguez et al. 2013; Clayton et al. 2015), no studies have investigated the impact of sucrose or HFCS‐55 on hepatic fat content or fatty acid composition. This is significant, as the type of fatty acids stored in the liver, as well as the overall fat content, is known to influence hepatic metabolism and the risk of developing diseases including non‐alcoholic fatty liver disease (NAFLD) (Puri et al. 2007). We have previously demonstrated that maternal consumption of either sucrose or HFCS‐55 prior to and during pregnancy and lactation is associated with sugar‐specific effects in the dam and newborn offspring (Toop et al. 2015). In the current study we investigated the separate effects of maternal consumption of sucrose or HFCS‐55 during the prenatal and/or suckling periods on the short‐ (3 weeks) and longer‐term (12 weeks) outcomes in the offspring, specifically body weight and fat mass, glucose tolerance, plasma hormone, lipid and glucose concentrations, and hepatic lipid content and fatty acid composition.
Methods
Ethical approval
All procedures were approved by the Animal Ethics Committee of SA Pathology (approval number 26/12) for the University of South Australia, and this work complies with the animal ethics principles and regulations of the Australian Code for the Care and Use of Animals for Scientific Purposes. The authors ensured that all steps were taken to minimise the pain and suffering of the animals. A total of 90 virgin female and 15 male albino Wistar rats (8 weeks old) were obtained from Laboratory Animal Services (outbred albino Wistar rats, colony source Harlan Sprague Dawley from Indianapolis, IN, USA, imported 6 November 2008; SA, Australia) and housed in individually ventilated cages under a 12 h light–dark cycle at a room temperature of 22°C. Of the 90 female rodents, 84 were mated over three cohorts, with an average mating success rate of 90 ± 5%, resulting in 77 successful pregnancies. Of the 77 litters, 74 ± 12% were successfully cross‐fostered to another dam in the same or different treatment group, resulting in 61 litters across seven experimental groups. Adult female and male rats and offspring at 3 and 12 weeks of age were killed by an overdose of CO2 followed by cervical dislocation. Newborn offspring that were unable to be cross‐fostered were killed by decapitation within 48 h of birth.
Experimental design
As described previously (Toop et al. 2015), following 1 week acclimatisation with ad libitum access to standard laboratory rat chow (Specialty Feeds, Glen Forrest, WA, Australia; 14 kJ g−1) and water, rats were randomly assigned to receive a control diet with ad libitum access to standard laboratory rat chow and water (n = 25 dams), or ad libitum access to chow and an SSB containing either 10% (w/v) sucrose (CSR, Victoria, Australia; n = 19 dams) or HFCS‐55 (Nature's Flavors, Orange, CA, USA; n = 17 dams), made fresh in the animal facility using autoclaved water, and replaced every 48 h or when required (Fig. 1). Dams remained on this diet for at least 4 weeks prior to mating, and throughout pregnancy and lactation (Toop et al. 2015). After a minimum of 4 weeks on their respective diets, all dams were mated. Offspring were born naturally at day 22.4 ± 0.07 of gestation. Within 24 h of birth, litters were culled to eight pups per litter, four males and four females where possible, and all offspring were cross‐fostered to create a total of seven experimental groups: offspring exposed to a maternal control diet during both the prenatal and suckling periods (C‐C; n = 8 litters), offspring exposed to a maternal sucrose diet during both the prenatal and suckling periods (S‐S; n = 11 litters), offspring exposed to a maternal sucrose diet during the prenatal period and then a maternal control diet during the suckling period (S‐C; n = 8 litters), offspring exposed to a maternal control diet during the prenatal period and then a maternal sucrose diet during the suckling period (C‐S; n = 8 litters), offspring exposed to a maternal HFCS‐55 diet during both the prenatal and suckling periods (H‐H; n = 8 litters), offspring exposed to a maternal HFCS‐55 diet during the prenatal period and then a maternal control diet during the suckling period (H‐C; n = 9 litters), or offspring exposed to a maternal control diet during the prenatal period and then a maternal HFCS‐55 diet during the suckling period (C‐H; n = 9 litters) (Fig. 1).
Figure 1. Schematic of the treatment groups summarising exposure periods and cross‐foster design.
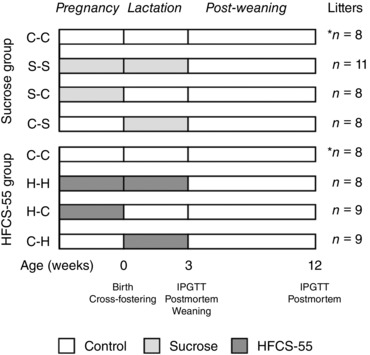
The C‐C offspring were born to a control dam and cross‐fostered to a different control dam (week 0), and these offspring were the controls for all subsequent analyses. The C‐C group was repeated in both sucrose and HFCS‐55 analyses, denoted by the asterisk (*). In the sucrose exposure group, S‐S offspring were born to a sucrose‐fed dam and cross‐fostered to a different sucrose‐fed dam; S‐C offspring were born to a sucrose‐fed dam and cross‐fostered to a control dam; and C‐S offspring were born to a control dam and cross‐fostered to a sucrose‐fed dam. In the HFCS‐55 exposure group, H‐H offspring were born to an HFCS‐55‐fed dam and cross‐fostered to a different HFCS‐55‐fed dam; H‐C offspring were born to an HFCS‐55‐fed dam and cross‐fostered to a control dam; and C‐H offspring were born to a control dam and cross‐fostered to an HFCS‐55‐fed dam. At 3 weeks, an intraperitoneal glucose tolerance test (IPGTT) was performed on one male and one female offspring per litter, with a post‐mortem conducted 1 day later. Offspring were weaned and fed a control diet until 12 weeks, when another IPGTT and post‐mortem was conducted.
All pups were weighed every 2 days from birth until 3 weeks of age, at which point two males and two females (where possible) were weaned onto a control diet with ad libitum access to standard laboratory rat chow and water. The weaned offspring were weighed weekly until 12 weeks of age. At 3 and 12 weeks, one male and one female per litter were killed with an overdose of CO2 followed by cervical dislocation. Blood samples were collected via cardiac puncture, centrifuged at 1419 g for 10 min at 4°C, then plasma was collected and stored at −80°C. At both 3 and 12 weeks of age, selected internal organs including the heart, liver, adrenals, kidneys, pancreas and visceral (retroperitoneal, gonadal and omental depots) and subcutaneous adipose tissue depots were dissected out and weighed. Liver samples were snap frozen in liquid nitrogen and stored at −80°C for analysis of lipid content and composition.
Intraperitoneal glucose tolerance test
Intraperitoneal glucose tolerance tests (IPGTTs) were performed on one male and one female offspring per litter 1 day prior to the post‐mortem at 3 and 12 weeks of age, as described previously (Toop et al. 2015). Animals were fasted for at least 15 h prior to the IPGTT, although offspring at 3 weeks of age remained with the dam during the fasting period and still had access to breast milk. Blood glucose concentrations were determined using a hand‐held glucometer (FreeStyle Glucometer; Abbott Diabetes Care, Victoria, Australia) from a tail vein blood sample (∼60 μl). A baseline blood glucose concentration was determined 10–15 min prior to commencing the IPGTT. A 50% glucose solution (2 g kg−1; Phebra, NSW, Australia) was then administered via intraperitoneal injection. Tail vein blood samples were collected immediately prior to (0 min) and 5, 10, 15, 30, 60 and 120 min after glucose administration for determination of blood glucose concentration. Area under the glucose curve (AUC) was calculated using the trapezoidal rule.
Determination of plasma hormone and metabolite concentrations
Plasma glucose, triglyceride (TG), total cholesterol, high‐density lipoprotein (HDL) cholesterol (Thermo Electron, Pittsburgh, PA, USA) and free fatty acid (FFA, also known as non‐esterified fatty acid; WAKO Pure Chemical Industries Ltd, Osaka, Japan) concentrations were determined using a Konelab 20X device (Thermo Fisher Scientific, Waltham, MA, USA). Plasma insulin and leptin concentrations were measured by immunoassay with rat insulin (ALPCO Diagnostics, Salem, NH, USA) and leptin (Crystal Chem, Downers Grove, IL, USA) kits according to the manufacturers’ specifications. Inter‐ and intra‐assay coefficients of variation were < 1% for all assays. Low‐density lipoprotein (LDL) cholesterol was calculated as the difference between total and HDL cholesterol concentrations.
Determination of hepatic lipid concentration and composition
Hepatic lipids were extracted according to Folch et al. (1957) with minor modifications (Bligh & Dyer, 1959; Tu et al. 2010). Briefly, 50 mg sections of liver from the right lobe were homogenised in ice‐cold 0.9% saline (Precelleys24, Bertin Technologies, France). Total lipids were extracted with methanol/chloroform (2:1) and dried under nitrogen. The remaining residue was weighed to determine the total extracted lipid content (%) from the weight of the lipid extract (g) and the weight of the liver sample (g). Following resuspension in 9:1 chloroform/methanol, the lipid extract was separated by thin layer chromatography to isolate the FFA, TG and phospholipid fractions, which were then transmethylated with 1% H2SO4 in methanol at 70°C for 3 h. The resulting fatty acid methyl esters from each lipid fraction were then separated and quantified by gas chromatography (6890; Hewlett‐Packard, Palo Alto, CA, USA) equipped with a capillary column (50 m × 0.32 mm internal diameter) coated with 0.25 μm film thickness silica (BPX‐70; SGE Analytical Science Pty Ltd, Victoria, Australia), which was fitted with a flame ionisation detector. The injector temperature was set at 250°C and the detector temperature at 300°C. Helium was used as the carrier gas (35 cm s−1) and the split‐ratio was 20:1. Fatty acid methyl esters were identified based on the retention time and peak area percentage of the unknown samples to commercial lipid standards (Nu‐Check Prep Inc., Elysian, MN, USA) using ChemStation software (Hewlett‐Packard). From this, the concentration of total FFA, phospholipid and TG in the liver were determined, in addition to the concentration of total saturated fatty acids (SFAs), total, omega‐7 and omega‐9 monounsaturated fatty acids (MUFAs), and omega‐3 and omega‐6 polyunsaturated fatty acids (PUFAs).
Statistical analysis
All data are presented as mean ± SEM. Data were assessed for normality using the Shapiro–Wilk test. The analysis was split into two groups based on offspring sugar exposure, in which the C‐C offspring were used as the controls for all analyses: the sucrose exposure group (C‐C, S‐S, S‐C and C‐S offspring) and the HFCS‐55 exposure group (C‐C, H‐H, H‐C and H‐C) (Fig. 1). The effects of maternal consumption of sucrose or HFCS‐55 during pregnancy and/or lactation on offspring body weight at post‐mortem, relative organ and tissue weights, hepatic lipid concentration and composition, and plasma metabolite and hormone concentrations were initially determined using two‐way ANOVA (analyses split by sugar exposure, as defined above) with maternal diet (during pregnancy and/or lactation) and offspring sex as co‐factors. An effect of sex was found for many of the variables reported, so all data were split for sex and re‐analysed using a one‐way ANOVA, followed by a Bonferroni post hoc test where appropriate. The statistical significance reported in the tables and figures summarises the effect of treatment for male or female offspring for each of the variables reported, as determined by one‐way ANOVA. Differences between males and females (independent of treatment) identified by the two‐way ANOVA have been identified in the table and figure legends. The effect of maternal sugar consumption in the sucrose exposure and HFCS‐55 exposure groups during pregnancy and/or lactation on offspring body weight throughout the study period was separately determined using a nested repeated‐measures ANOVA. The effect of maternal diet on offspring glucose concentrations during the IPGTT was determined by repeated‐measures ANOVA, split for sex, with maternal diet and time as co‐factors. The repeated‐measures ANOVA was performed using Stata12 (StataCorp LP, College Station, TX, USA). All other statistical analyses were performed using SPSS (SPSS Inc., Chicago, IL, USA). A probability of < 5% (P < 0.05) was considered statistically significant in all analyses.
Results
Effects of perinatal sucrose exposure
Body weight and growth
There was no effect of prenatal and/or postnatal sucrose exposure on offspring body weight at any time point between birth and 12 weeks of age, nose–tail length, abdominal circumference (data not shown) or body weight at post‐mortem at either 3 weeks (Table 1) or 12 weeks (Table 2).
Table 1.
Body weight, relative organ weights and relative adipose tissue weights of 3‐week‐old male and female offspring exposed to sucrose or HFCS‐55 during the prenatal and/or suckling periods
| C‐C | S‐S | S‐C | C‐S | P‐value | C‐C | H‐H | H‐C | C‐H | P‐value | |
|---|---|---|---|---|---|---|---|---|---|---|
| 3 week male | n = 8 | n = 11 | n = 8 | n = 8 | n = 8 | n = 8 | n = 9 | n = 9 | ||
| Body weight (g) | 45.4 ± 2.0 | 42.1 ± 0.9 | 43.7 ± 1.6 | 42.9 ± 1.1 | 0.369 | 45.4 ± 2.0 | 45.2 ± 1.5 | 44.2 ± 1.3 | 45.1 ± 1.2 | 0.939 |
| Relative liver (%) | 3.74 ± 0.06 | 3.58 ± 0.07 | 3.59 ± 0.05 | 3.66 ± 0.09 | 0.370 | 3.74 ± 0.06 | 3.63 ± 0.04 | 3.67 ± 0.06 | 3.76 ± 0.10 | 0.611 |
| Relative heart (%) | 0.63 ± 0.01 | 0.64 ± 0.02 | 0.59 ± 0.01 | 0.61 ± 0.02 | 0.166 | 0.63 ± 0.01 | 0.62 ± 0.01 | 0.63 ± 0.01 | 0.62 ± 0.01 | 0.699 |
| Relative adrenal (%) | 0.030 ± 0.002 | 0.030 ± 0.001 | 0.034 ± 0.003 | 0.033 ± 0.002 | 0.501 | 0.030 ± 0.002 | 0.032 ± 0.002 | 0.031 ± 0.001 | 0.030 ± 0.001 | 0.718 |
| Relative kidney (%) | 0.99 ± 0.02 | 1.00 ± 0.01 | 1.01 ± 0.02 | 1.03 ± 0.02 | 0.525 | 0.99 ± 0.02 | 1.05 ± 0.02 | 1.01 ± 0.01 | 1.02 ± 0.04 | 0.366 |
| Relative pancreas (%) | 0.18 ± 0.01 | 0.20 ± 0.01 | 0.17 ± 0.01 | 0.18 ± 0.01 | 0.469 | 0.18 ± 0.01 | 0.17 ± 0.01 | 0.18 ± 0.01 | 0.16 ± 0.01 | 0.572 |
| Relative total adipose (%) | 4.00 ± 0.26 | 4.24 ± 0.35 | 3.76 ± 0.35 | 4.22 ± 0.23 | 0.695 | 4.00 ± 0.26a, b | 4.28 ± 0.14a, b | 3.82 ± 0.11a | 4.73 ± 0.24b | 0.025 |
| Relative subcutaneous adipose (%) | 2.69 ± 0.24 | 2.79 ± 0.28 | 2.51 ± 0.34 | 2.77 ± 0.18 | 0.885 | 2.69 ± 0.24a, b | 2.69 ± 0.13a, b | 2.34 ± 0.10a | 3.25 ± 0.23b | 0.013 |
| Relative total visceral adipose (%) | 0.91 ± 0.06 | 1.00 ± 0.07 | 0.90 ± 0.02 | 1.03 ± 0.06 | 0.372 | 0.91 ± 0.06 | 1.11 ± 0.07 | 0.98 ± 0.06 | 1.11 ± 0.05 | 0.056 |
| Relative gonadal adipose (%) | 0.16 ± 0.02 | 0.16 ± 0.02 | 0.17 ± 0.02 | 0.19 ± 0.02 | 0.511 | 0.16 ± 0.02 | 0.20 ± 0.02 | 0.15 ± 0.01 | 0.17 ± 0.02 | 0.252 |
| Relative retroperitoneal adipose (%) | 0.22 ± 0.02 | 0.24 ± 0.03 | 0.19 ± 0.01 | 0.26 ± 0.03 | *0.315 | 0.22 ± 0.02 | 0.25 ± 0.02 | 0.19 ± 0.01 | 0.27 ± 0.02 | *0.073 |
| Relative omental adipose (%) | 0.53 ± 0.03 | 0.61 ± 0.05 | 0.54 ± 0.02 | 0.61 ± 0.04 | 0.308 | 0.53 ± ± 0.03a | 0.66 ± 0.05a, b | 0.59 ± 0.02a, b | 0.68 ± 0.03b | * 0.029 |
| 3 week female | n = 8 | n = 11 | n = 8 | n = 8 | n = 8 | n = 8 | n = 8 | n = 9 | ||
| Body weight (g) | 44.4 ± 1.4 | 41.1 ± 1.1 | 44.7 ± 1.0 | 42.8 ± 1.4 | 0.142 | 44.4 ± 1.4 | 43.1 ± 1.4 | 42.2 ± 1.5 | 43.8 ± 1.0 | 0.695 |
| Relative liver (%) | 3.74 ± 0.06 | 3.66 ± 0.08 | 3.67 ± 0.04 | 3.71 ± 0.07 | 0.846 | 3.74 ± 0.06 | 3.66 ± 0.04 | 3.70 ± 0.05 | 3.75 ± 0.10 | 0.803 |
| Relative heart (%) | 0.62 ± 0.02a, b | 0.64 ± 0.02b | 0.56 ± 0.01a | 0.61 ± 0.01a, b | 0.005 | 0.62 ± 0.02 | 0.62 ± 0.02 | 0.61 ± 0.02 | 0.62 ± 0.02 | 0.916 |
| Relative adrenal (%) | 0.031 ± 0.001 | 0.031 ± 0.001 | 0.035 ± 0.002 | 0.034 ± 0.002 | 0.124 | 0.031 ± 0.001 | 0.033 ± 0.001 | 0.034 ± 0.002 | 0.030 ± 0.001 | 0.202 |
| Relative kidney (%) | 1.05 ± 0.03 | 1.00 ± 0.01 | 1.04 ± 0.02 | 1.03 ± 0.02 | 0.232 | 1.05 ± 0.03 | 1.03 ± 0.02 | 1.04 ± 0.02 | 1.03 ± 0.03 | 0.887 |
| Relative pancreas (%) | 0.19 ± 0.01 | 0.18 ± 0.01 | 0.19 ± 0.01 | 0.15 ± 0.01 | 0.051 | 0.19 ± 0.01 | 0.17 ± 0.01 | 0.17 ± 0.01 | 0.16 ± 0.01 | 0.111 |
| Relative total adipose (%) | 3.94 ± 0.32 | 4.56 ± 0.32 | 3.89 ± 0.35 | 4.30 ± 0.34 | 0.410 | 3.94 ± 0.32 | 4.59 ± 0.20 | 3.85 ± 0.29 | 4.69 ± 0.20 | 0.057 |
| Relative subcutaneous adipose (%) | 2.74 ± 0.28 | 3.13 ± 0.27 | 2.59 ± 0.33 | 2.78 ± 0.25 | 0.457 | 2.74 ± 0.28 | 2.94 ± 0.19 | 2.56 ± 0.24 | 3.35 ± 0.23 | 0.110 |
| Relative total visceral adipose (%) | 0.85 ± 0.04a | 0.96 ± 0.05a, b | 0.89 ± 0.05a, b | 1.07 ± 0.04b | 0.040 | 0.85 ± 0.04 | 0.96 ± 0.08 | 0.93 ± 0.07 | 1.04 ± 0.05 | 0.194 |
| Relative gonadal adipose (%) | 0.17 ± 0.02 | 0.19 ± 0.02 | 0.19 ± 0.02 | 0.23 ± 0.03 | 0.292 | 0.17 ± 0.02 | 0.23 ± 0.03 | 0.19 ± 0.02 | 0.21 ± 0.02 | 0.337 |
| Relative retroperitoneal adipose (%) | 0.20 ± 0.03 | 0.19 ± 0.02 | 0.15 ± 0.02 | 0.20 ± 0.02 | *0.409 | 0.20 ± 0.03 | 0.19 ± 0.02 | 0.16 ± 0.02 | 0.19 ± 0.02 | *0.611 |
| Relative omental adipose (%) | 0.48 ± 0.03a | 0.59 ± 0.04a, b | 0.53 ± 0.02a, b | 0.63 ± 0.03b | 0.035 | 0.48 ± 0.03a | 0.52 ± 0.04a, b | 0.59 ± 0.03a, b | 0.63 ± 0.04b | * 0.044 |
Data are presented as mean ± SEM. The reported P‐value indicates the effect of treatment within each sex, as determined by the one‐way ANOVA. a,bDifferent superscript letters denote mean values that were significantly different from each other (P < 0.05) for each sex within each experimental grouping. *A significant effect of offspring sex, independent of treatment, within each experimental grouping. Significant P‐values are in bold.
Table 2.
Body weight, relative organ weights and relative adipose tissue weights of 12‐week‐old male and female offspring exposed to sucrose or HFCS‐55 during the prenatal and/or suckling periods
| C‐C | S‐S | S‐C | C‐S | P‐value | C‐C | H‐H | H‐C | C‐H | P‐value | |
|---|---|---|---|---|---|---|---|---|---|---|
| 12 week male | n = 8 | n = 11 | n = 8 | n = 8 | n = 8 | n = 8 | n = 9 | n = 9 | ||
| Body weight (g) | 409.2 ± 11.0 | 410.1 ± 6.6 | 401.3 ± 12.1 | 403.5 ± 12.0 | *0.906 | 409.2 ± 11.0 | 393.3 ± 7.3 | 396.4 ± 8.5 | 402.0 ± 10.6 | *0.676 |
| Relative liver (%) | 3.87 ± 0.08 | 3.86 ± 0.10 | 3.90 ± 0.07 | 4.03 ± 0.13 | *0.602 | 3.87 ± 0.08 | 3.82 ± 0.08 | 3.89 ± 0.10 | 3.86 ± 0.04 | *0.948 |
| Relative heart (%) | 0.34 ± 0.01 | 0.35 ± 0.01 | 0.35 ± 0.01 | 0.34 ± 0.01 | *0.915 | 0.34 ± 0.01 | 0.35 ± 0.01 | 0.37 ± 0.01 | 0.35 ± 0.01 | *0.287 |
| Relative adrenal (%) | 0.016 ± 0.001 | 0.017 ± 0.001 | 0.017 ± 0.001 | 0.019 ± 0.001 | *0.125 | 0.016 ± 0.001 | 0.019 ± 0.001 | 0.017 ± 0.001 | 0.017 ± 0.001 | *0.215 |
| Relative kidney (%) | 0.64 ± 0.01 | 0.68 ± 0.02 | 0.66 ± 0.02 | 0.69 ± 0.01 | 0.233 | 0.64 ± 0.01 | 0.67 ± 0.02 | 0.66 ± 0.02 | 0.67 ± 0.01 | *0.511 |
| Relative pancreas (%) | 0.15 ± 0.01b | 0.12 ± 0.004a | 0.13 ± 0.01a, b | 0.11 ± 0.01a | * 0.001 | 0.15 ± 0.01 | 0.15 ± 0.01 | 0.14 ± 0.01 | 0.15 ± 0.01 | *0.722 |
| Relative total fat (%) | 7.56 ± 0.22b | 7.04 ± 0.31a, b | 7.01 ± 0.39a, b | 6.00 ± 0.38a | * 0.023 | 7.56 ± 0.22 | 6.09 ± 0.43 | 7.17 ± 0.40 | 6.33 ± 0.30 | * 0.022 |
| Relative subcutaneous fat (%) | 2.73 ± 0.15 | 2.57 ± 0.12 | 2.43 ± 0.14 | 2.21 ± 0.17 | *0.105 | 2.73 ± 0.15 | 2.35 ± 0.15 | 2.40 ± 0.22 | 2.33 ± 0.10 | *0.297 |
| Relative total visceral fat (%) | 4.80 ± 0.16b | 4.08 ± 0.16a, b | 4.67 ± 0.33b | 3.65 ± 0.23a | * 0.005 | 4.80 ± 0.16 | 3.72 ± 0.30 | 4.41 ± 0.26 | 4.08 ± 0.26 | *0.063 |
| Relative gonadal fat (%) | 1.76 ± 0.10b | 1.58 ± 0.08a, b | 1.66 ± 0.15a, b | 1.26 ± 0.12a | * 0.025 | 1.76 ± 0.10 | 1.57 ± 0.18 | 1.51 ± 0.12 | 1.51 ± 0.16 | *0.560 |
| Relative retroperitoneal fat (%) | 1.86 ± 0.09 | 1.58 ± 0.12 | 1.84 ± 0.16 | 1.46 ± 0.09 | 0.080 | 1.86 ± 0.09b | 1.31 ± 0.08a | 1.77 ± 0.11a, b | 1.52 ± 0.12a, b | * 0.015 |
| Relative omental fat (%) | 1.19 ± 0.06b | 1.10 ± 0.06a, b | 1.16 ± 0.06a, b | 0.93 ± 0.05a | * 0.031 | 1.19 ± 0.06 | 1.08 ± 0.08 | 1.13 ± 0.07 | 1.06 ± 0.05 | *0.534 |
| 12 week female | n = 8 | n = 11 | n = 8 | n = 8 | n = 8 | n = 8 | n = 9 | n = 9 | ||
| Body weight (g) | 266.1 ± 5.4 | 255.3 ± 6.5 | 275.4 ± 6.0 | 273.1 ± 7.8 | *0.119 | 266.1 ± 5.4 | 269.4 ± 13.2 | 266.3 ± 8.3 | 280.6 ± 9.1 | *0.651 |
| Relative liver (%) | 3.53 ± 0.08 | 3.71 ± 0.09 | 3.66 ± 0.06 | 3.89 ± 0.12 | *0.073 | 3.53 ± 0.08a | 3.84 ± 0.05b | 3.68 ± 0.05a, b | 3.54 ± 0.07a | * 0.014 |
| Relative heart (%) | 0.40 ± 0.01b | 0.36 ± 0.01a, b | 0.35 ± 0.01a | 0.35 ± 0.01a | * 0.018 | 0.40 ± 0.01 | 0.37 ± 0.02 | 0.38 ± 0.02 | 0.36 ± 0.01 | *0.449 |
| Relative adrenal (%) | 0.027 ± 0.001 | 0.028 ± 0.001 | 0.028 ± 0.001 | 0.027 ± 0.001 | *0.746 | 0.027 ± 0.001 | 0.029 ± 0.002 | 0.028 ± 0.001 | 0.027 ± 0.001 | *0.484 |
| Relative kidney (%) | 0.68 ± 0.01 | 0.70 ± 0.01 | 0.68 ± 0.01 | 0.70 ± 0.02 | 0.688 | 0.68 ± 0.01 | 0.70 ± 0.01 | 0.66 ± 0.01 | 0.67 ± 0.004 | *0.151 |
| Relative pancreas (%) | 0.17 ± 0.01 | 0.17 ± 0.01 | 0.17 ± 0.01 | 0.16 ± 0.01 | *0.864 | 0.17 ± 0.01 | 0.16 ± 0.01 | 0.17 ± 0.01 | 0.17 ± 0.01 | *0.862 |
| Relative total fat (%) | 9.54 ± 0.45 | 9.18 ± 0.34 | 8.71 ± 0.60 | 9.23 ± 0.67 | *0.752 | 9.54 ± 0.45 | 8.30 ± 0.52 | 9.40 ± 0.68 | 9.37 ± 0.46 | *0.408 |
| Relative subcutaneous fat (%) | 2.84 ± 0.12 | 2.77 ± 0.11 | 2.53 ± 0.12 | 2.84 ± 0.28 | *0.607 | 2.84 ± 0.12 | 2.68 ± 0.24 | 3.13 ± 0.23 | 2.75 ± 0.15 | *0.372 |
| Relative total visceral fat (%) | 6.53 ± 0.39 | 6.20 ± 0.23 | 6.28 ± 0.52 | 6.22 ± 0.39 | *0.930 | 6.53 ± 0.39 | 5.66 ± 0.30 | 6.50 ± 0.43 | 6.52 ± 0.31 | *0.352 |
| Relative gonadal fat (%) | 3.09 ± 0.18 | 3.11 ± 0.24 | 3.71 ± 0.37 | 3.50 ± 0.28 | *0.321 | 3.09 ± 0.18 | 2.77 ± 0.20 | 3.32 ± 0.26 | 3.25 ± 0.28 | *0.472 |
| Relative retroperitoneal fat (%) | 1.95 ± 0.19b | 1.62 ± 0.19a, b | 1.23 ± 0.12a | 1.37 ± 0.11a, b | 0.027 | 1.95 ± 0.19 | 1.66 ± 0.07 | 1.95 ± 0.12 | 2.14 ± 0.17 | *0.173 |
| Relative omental fat (%) | 1.39 ± 0.06 | 1.27 ± 0.04 | 1.33 ± 0.10 | 1.29 ± 0.06 | *0.628 | 1.39 ± 0.06 | 1.22 ± 0.07 | 1.29 ± 0.11 | 1.36 ± 0.07 | *0.487 |
Data are presented as mean ± SEM. The reported P‐value indicates the effect of treatment within each sex, as determined by the one‐way ANOVA. a,bDifferent superscript letters denote mean values that were significantly different from each other (P < 0.05) for each sex within each experimental grouping. *A significant effect of offspring sex, independent of treatment, within each experimental grouping. Significant P‐values are in bold.
Organ weights
Female, but not male, offspring prenatally exposed to sucrose (S‐C) had a lower relative heart weight compared to S‐S offspring, but not C‐C offspring, at 3 weeks of age (Table 1). At 12 weeks, relative heart weight was lower in both S‐C and C‐S females compared to C‐C females (Table 2). Relative pancreas weight tended (P = 0.051) to be lower in C‐S females at 3 weeks compared to C‐C females, and S‐S and C‐S males had significantly lower relative pancreas weights compared to male C‐C offspring at 12 weeks. There were no effects of exposure to sucrose during either the prenatal and/or the suckling periods on relative liver, adrenal or kidney weights in either male or female offspring at 3 weeks (Table 1) or 12 weeks (Table 2) of age.
Body fat mass
Exposure to sucrose during the suckling period alone (C‐S) was associated with increased relative visceral adipose tissue mass in female, but not male, offspring at 3 weeks of age compared to C‐C offspring, an effect driven primarily by a significant increase in the mass of the omental depot (Table 1). There were no other effects of sucrose exposure during the prenatal or suckling periods on adipose tissue mass at 3 weeks of age in either male or female offspring.
There were no persistent effects of sucrose exposure during the suckling period in female offspring at 12 weeks. However, 12‐week‐old females exposed to sucrose during the prenatal period only (S‐C) had a significantly lower retroperitoneal adipose tissue mass compared to C‐C offspring (Table 2). In males, however, those offspring exposed during the suckling period alone (C‐S) had a lower relative total fat and total visceral fat mass, and reduced relative gonadal and omental fat mass at 12 weeks of age compared to C‐C offspring (Table 2).
Glucose tolerance
No effects of prenatal and/or postnatal sucrose exposure were observed for glucose tolerance AUC in offspring at either 3 weeks (Table 3) or 12 weeks (Table 4). There were also no significant effects on individual blood glucose values at any time points during the glucose tolerance test (data not shown).
Table 3.
Glucose tolerance AUC and plasma glucose, hormone and lipid concentrations of 3‐week‐old male and female offspring exposed to sucrose or HFCS‐55 during the prenatal and/or suckling periods
| C‐C | S‐S | S‐C | C‐S | P‐value | C‐C | H‐H | H‐C | C‐H | P‐value | |
|---|---|---|---|---|---|---|---|---|---|---|
| 3 week male | n = 7 | n = 11 | n = 8 | n = 7 | n = 8 | n = 8 | n = 8 | n = 9 | ||
| Blood glucose AUC (mmol l–1 min–1) | 1146.2 ± 41.0 | 1130.8 ± 35.9 | 1146.2 ± 22.7 | 1182.2 ± 33.9 | 0.760 | 1146.2 ± 41.0 | 1137.4 ± 27.6 | 1236.9 ± 51.5 | 1191.1 ± 47.0 | 0.366 |
| Glucose (mmol l–1) | 12.9 ± 0.5b | 10.7 ± 0.3a | 11.5 ± 0.5a, b | 12.2 ± 0.5a, b | 0.006 | 12.9 ± 0.5 | 11.4 ± 0.5 | 13.8 ± 1.0 | 12.3 ± 0.5 | 0.084 |
| Insulin (ng ml–1) | 0.20 ± 0.09 | 0.43 ± 0.07 | 0.53 ± 0.06 | 0.51 ± 0.11 | 0.060 | 0.20 ± 0.09 | 0.40 ± 0.06 | 0.48 ± 0.12 | 0.48 ± 0.11 | 0.212 |
| Leptin (ng ml–1) | 4.59 ± 0.51 | 5.41 ± 0.64 | 4.70 ± 0.61 | 6.93 ± 0.73 | 0.091 | 4.59 ± 0.51 | 5.22 ± 0.57 | 4.78 ± 0.66 | 6.70 ± 0.76 | 0.100 |
| TG (mmol l–1) | 2.31 ± 0.22a, b | 1.92 ± 0.13a | 1.60 ± 0.21a | 2.85 ± 0.31b | 0.002 | 2.31 ± 0.22 | 1.99 ± 0.22 | 2.25 ± 0.12 | 2.22 ± 0.21 | 0.706 |
| Total cholesterol (mmol l–1) | 3.66 ± 0.15 | 3.70 ± 0.11 | 3.76 ± 0.29 | 4.05 ± 0.28 | 0.586 | 3.66 ± 0.15 | 3.46 ± 0.23 | 4.02 ± 0.23 | 3.64 ± 0.15 | 0.245 |
| HDL cholesterol (mmol l–1) | 0.60 ± 0.06a, b | 0.58 ± 0.06a, b | 0.82 ± 0.08b | 0.35 ± 0.05a | 0.001 | 0.60 ± 0.06b | 0.64 ± 0.07b | 0.64 ± 0.02b | 0.41 ± 0.03a | 0.001 |
| LDL cholesterol (mmol l–1) | 3.06 ± 0.15 | 3.12 ± 0.11 | 2.95 ± 0.34 | 3.70 ± 0.27 | 0.152 | 3.06 ± 0.15 | 2.82 ± 0.21 | 3.38 ± 0.24 | 3.23 ± 0.18 | 0.261 |
| HDL/LDL ratio | 16:84a, b | 16:84a, b | 23:77b | 8:92a | 0.001 | 16:84b | 19:81b | 16:84b | 10:90a | 0.001 |
| 3 week female | n = 8 | n = 11 | n = 8 | n = 8 | n = 8 | n = 8 | n = 8 | n = 9 | ||
| Blood glucose AUC (mmol l–1 min–1) | 1118.7 ± 40.4 | 1069.0 ± 30.2 | 1082.8 ± 30.4 | 1113.5 ± 40.8 | 0.701 | 1118.7 ± 40.4 | 1086.4 ± 18.9 | 1142.0 ± 57.9 | 1176.7 ± 59.6 | 0.589 |
| Glucose (mmol l–1) | 13.5 ± 0.7b | 10.7 ± 0.4a | 11.7 ± 0.7a, b | 11.0 ± 0.5a, b | 0.015 | 13.5 ± 0.7 | 11.8 ± 0.8 | 13.3 ± 1.1 | 12.4 ± 0.8 | 0.524 |
| Insulin (ng ml–1) | 0.41 ± 0.14 | 0.78 ± 0.11 | 0.40 ± 0.09 | 0.52 ± 0.12 | 0.079 | 0.41 ± 0.14 | 0.51 ± 0.11 | 0.60 ± 0.16 | 0.49 ± 0.10 | 0.795 |
| Leptin (ng ml–1) | 4.29 ± 0.40 | 5.64 ± 0.50 | 4.72 ± 0.54 | 6.44 ± 0.75 | 0.056 | 4.29 ± 0.40 | 5.87 ± 0.66 | 4.91 ± 0.55 | 5.89 ± 0.54 | 0.119 |
| TG (mmol l–1) | 2.05 ± 0.22 | 1.85 ± 0.10 | 1.79 ± 0.23 | 2.25 ± 0.28 | 0.390 | 2.05 ± 0.22 | 2.15 ± 0.21 | 1.96 ± 0.18 | 2.10 ± 0.19 | 0.925 |
| Total cholesterol (mmol l–1) | 3.51 ± 0.21 | 3.70 ± 0.14 | 3.82 ± 0.28 | 3.91 ± 0.26 | 0.649 | 3.51 ± 0.21 | 3.50 ± 0.32 | 3.54 ± 0.23 | 3.51 ± 0.15 | 0.999 |
| HDL cholesterol (mmol l–1) | 0.57 ± 0.05a, b | 0.66 ± 0.07a, b | 0.75 ± 0.08b | 0.42 ± 0.06a | 0.016 | 0.57 ± 0.05a, b | 0.67 ± 0.07b | 0.71 ± 0.04b | 0.45 ± 0.05a | 0.005 |
| LDL cholesterol (mmol l–1) | 2.96 ± 0.22 | 3.05 ± 0.15 | 3.07 ± 0.32 | 3.49 ± 0.24 | 0.416 | 2.96 ± 0.22 | 2.82 ± 0.35 | 2.80 ± 0.26 | 3.06 ± 0.13 | 0.849 |
| HDL/LDL ratio | 15:85a, b | 18:82a, b | 21:79b | 10:90a | 0.017 | 15:85a, b | 21:79b | 21:79b | 12:88a | 0.004 |
Data are presented as mean ± SEM. The reported P‐value indicates the effect of treatment within each sex, as determined by the one‐way ANOVA. a,bDifferent superscript letters denote mean values that were significantly different from each other (P < 0.05) for each sex within each experimental grouping. AUC, area under the curve; TG, triglyceride; HDL, high‐density lipoprotein; LDL, low‐density lipoprotein. Significant P‐values are in bold.
Table 4.
Glucose tolerance AUC and plasma glucose, hormone and lipid concentrations of 12‐week‐old male and female offspring exposed to sucrose or HFCS‐55 during the prenatal and/or suckling periods
| C‐C | S‐S | S‐C | C‐S | P‐value | C‐C | H‐H | H‐C | C‐H | P‐value | |
|---|---|---|---|---|---|---|---|---|---|---|
| 12 week male | n = 8 | n = 5 | n = 8 | n = 8 | n = 8 | n = 8 | n = 9 | n = 9 | ||
| Blood glucose AUC (mmol l–1 min–1) | 1408.1 ± 75.9 | 1456.8 ± 66.7 | 1299.4 ± 106.3 | 1390.6 ± 104.9 | 0.651 | 1408.1 ± 75.9 | 1482.7 ± 78.8 | 1424.0 ± 109.4 | 1411.1 ± 45.2 | 0.918 |
| Glucose (mmol l–1) | 13.4 ± 0.8 | 12.6 ± 0.7 | 13.2 ± 1.4 | 11.9 ± 0.7 | 0.694 | 13.4 ± 0.8 | 14.4 ± 1.0 | 14.9 ± 1.2 | 14.6 ± 1.1 | 0.762 |
| Insulin (ng ml–1) | 2.78 ± 0.26 | 2.92 ± 0.60 | 3.23 ± 0.31 | 3.03 ± 0.20 | 0.789 | 2.78 ± 0.26 | 2.83 ± 0.22 | 3.95 ± 0.48 | 2.82 ± 0.30 | *0.070 |
| Leptin (ng ml–1) | 7.49 ± 0.58 | 7.61 ± 0.75 | 7.21 ± 0.60 | 5.52 ± 0.47 | *0.094 | 7.49 ± 0.58 | 6.77 ± 0.29 | 6.32 ± 0.13 | 6.77 ± 0.42 | *0.245 |
| TG (mmol l–1) | 1.85 ± 0.16 | 1.42 ± 0.05 | 1.70 ± 0.09 | 1.91 ± 0.24 | *0.279 | 1.85 ± 0.16 | 1.42 ± 0.17 | 1.77 ± 0.15 | 1.70 ± 0.12 | *0.226 |
| Total cholesterol (mmol l–1) | 1.93 ± 0.06 | 1.84 ± 0.08 | 1.81 ± 0.10 | 1.89 ± 0.11 | 0.784 | 1.93 ± 0.06 | 1.72 ± 0.08 | 1.85 ± 0.07 | 1.91 ± 0.07 | 0.190 |
| HDL cholesterol (mmol l–1) | 1.00 ± 0.07 | 1.10 ± 0.04 | 1.03 ± 0.04 | 1.01 ± 0.04 | 0.622 | 1.00 ± 0.07 | 1.15 ± 0.06 | 1.16 ± 0.07 | 1.15 ± 0.03 | *0.175 |
| LDL cholesterol (mmol l–1) | 0.96 ± 0.07 | 0.74 ± 0.07 | 0.79 ± 0.08 | 0.88 ± 0.10 | 0.321 | 0.96 ± 0.07b | 0.57 ± 0.04a | 0.69 ± 0.09a | 0.76 ± 0.05a, b | * 0.004 |
| HDL/LDL ratio | 50:50 | 60:40 | 57:43 | 54:46 | 0.145 | 50:50a | 67:33b | 63:37b | 61:39a, b | * 0.003 |
| 12 week female | n = 8 | n = 5 | n = 8 | n = 8 | n = 8 | n = 8 | n = 8 | n = 9 | ||
| Blood glucose AUC (mmol l–1 min–1) | 1592.9 ± 110.4 | 1417.8 ± 35.9 | 1563.5 ± 51.1 | 1399.9 ± 121.8 | 0.280 | 1592.9 ± 110.4 | 1389.0 ± 64.7 | 1427.5 ± 100.3 | 1346.8 ± 98.8 | 0.316 |
| Glucose (mmol l–1) | 13.6 ± 0.7 | 11.0 ± 0.8 | 12.2 ± 1.1 | 11.8 ± 0.8 | 0.283 | 13.6 ± 0.7 | 12.1 ± 0.9 | 14.3 ± 1.4 | 14.6 ± 0.9 | 0.343 |
| Insulin (ng ml–1) | 2.33 ± 0.27 | 3.33 ± 0.44 | 2.77 ± 0.47 | 2.76 ± 0.28 | 0.264 | 2.33 ± 0.27 | 2.97 ± 0.38 | 2.45 ± 0.39 | 2.47 ± 0.32 | *0.580 |
| Leptin (ng ml–1) | 5.84 ± 0.57 | 5.36 ± 0.44 | 4.99 ± 0.52 | 5.45 ± 0.69 | *0.763 | 5.84 ± 0.57 | 4.74 ± 0.71 | 5.69 ± ± 0.73 | 6.24 ± 0.42 | *0.385 |
| TG (mmol l–1) | 1.36 ± 0.24 | 1.17 ± 0.31 | 1.16 ± 0.04 | 1.54 ± 0.21 | *0.502 | 1.36 ± 0.24 | 1.50 ± 0.22 | 1.26 ± 0.17 | 1.10 ± 0.10 | *0.479 |
| Total cholesterol (mmol l–1) | 1.96 ± 0.07 | 1.97 ± 0.07 | 1.82 ± 0.03 | 1.75 ± 0.10 | 0.121 | 1.96 ± 0.07 | 1.75 ± 0.12 | 1.79 ± 0.07 | 1.86 ± 0.07 | 0.339 |
| HDL cholesterol (mmol l–1) | 1.06 ± 0.05 | 1.22 ± 0.10 | 1.17 ± 0.09 | 0.94 ± 0.05 | 0.063 | 1.06 ± 0.05a | 1.25 ± 0.06a, b | 1.34 ± 0.05b | 1.22 ± 0.06a, b | * 0.016 |
| LDL cholesterol (mmol l–1) | 0.90 ± 0.08 | 0.75 ± 0.07 | 0.65 ± 0.08 | 0.78 ± 0.09 | 0.184 | 0.90 ± 0.08b | 0.50 ± 0.07a | 0.49 ± 0.09a | 0.64 ± 0.05a, b | * 0.002 |
| HDL/LDL ratio | 54:46 | 62:38 | 64:36 | 55:45 | 0.183 | 54:46a | 70:30b | 74:26b | 66:34a, b | * 0.001 |
Data are presented as mean ± SEM. The reported P‐value indicates the effect of treatment within each sex, as determined by the one‐way ANOVA. a,bDifferent superscript letters denote mean values that were significantly different from each other (P < 0.05) for each sex within each experimental grouping. *A significant effect of offspring sex, independent of treatment, within each experimental grouping. AUC, area under the curve; TG, triglyceride; HDL, high‐density lipoprotein; LDL, low‐density lipoprotein.
Plasma glucose, hormone and lipid concentrations
At 3 weeks, plasma glucose concentrations were significantly lower in both male and female S‐S offspring compared to C‐C offspring (Table 3). Plasma insulin tended to be increased in S‐S females (P = 0.079) and S‐C males (P = 0.06). There was a trend toward elevated plasma leptin concentrations in offspring exposed to sucrose only during suckling (C‐S) in both males (P = 0.091) and females (P = 0.056). The HDL cholesterol concentration and the ratio of HDL/LDL cholesterol were increased in S‐C offspring compared to C‐S offspring in both males and females. Plasma TG was higher in 3‐week‐old C‐S males compared to S‐S and S‐C, but not C‐C, males (Table 3). There were no significant differences in plasma FFA concentrations between treatment groups at 3 weeks of age (males, P = 0.164; females, P = 0.368; Fig. 2 A). At 12 weeks, however, plasma FFAs were significantly increased in male S‐C offspring compared to C‐C offspring (P = 0.036), with a trend toward the same effect in females (P = 0.088; Fig. 2 B). There were no other effects of perinatal sucrose exposure on plasma hormones, glucose or lipids at either 3 weeks (Table 3) or 12 weeks (Table 4) of age.
Figure 2. Plasma free fatty acid concentrations.
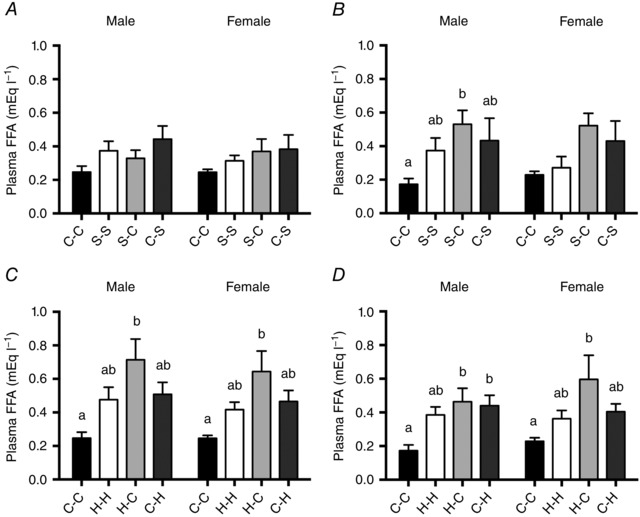
Plasma free fatty acid (FFA) concentrations of A, 3‐week‐old and B, 12‐week‐old offspring exposed to sucrose, and C, 3‐week‐old and D, 12‐week‐old offspring exposed to HFCS‐55 during the prenatal and/or suckling periods. Data are presented as mean ± SEM. a,bDifferent lower‐case letters denote mean values that were significantly different from each other (P < 0.05, one‐way ANOVA) within each experimental grouping (sucrose or HFCS‐55 exposure groups) and within each sex. There were no significant effects of offspring sex, independent of treatment.
Hepatic lipid content and fatty acid composition
There were no overall effects of exposure to sucrose during either the prenatal and/or the suckling periods on total hepatic fat content (males, P = 0.371; females, P = 0.141; Fig. 3 A) or hepatic TG, FFA or phospholipid concentrations at 3 weeks of age (Table 5). At 12 weeks, a significant effect of treatment was detected for total liver fat content in female offspring (P = 0.032), and for phospholipid concentration in male offspring (P = 0.036; Table 6), but the Bonferroni post hoc adjustment failed to identify any significant differences between treatment groups.
Figure 3. Hepatic lipid concentrations of 3‐week‐old offspring.
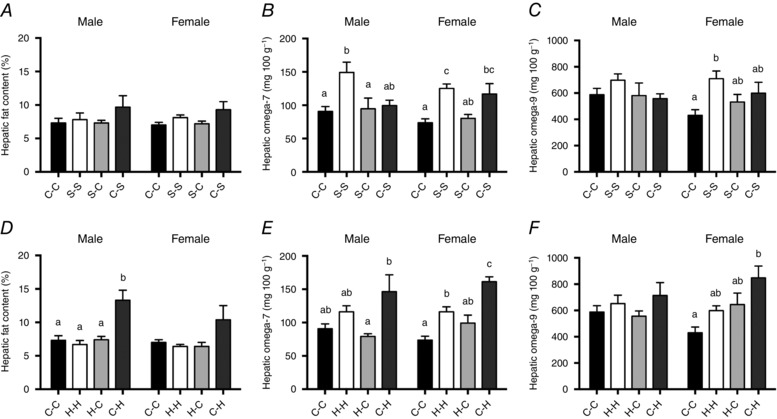
Total hepatic fat A, omega‐7 B, and omega‐9 C, content of 3‐week‐old offspring exposed to sucrose, and total hepatic fat D, omega‐7 E, and omega‐9 F, content of 3‐week‐old offspring exposed to HFCS‐55 during the prenatal and/or suckling periods. Data are presented as mean ± SEM. a,b,cDifferent lower case letters denote mean values that were significantly different from each other (P < 0.05, one‐way ANOVA) within each experimental grouping (sucrose or HFCS‐55 exposure groups) and within each sex. There were no significant effects of offspring sex, independent of treatment.
Table 5.
Hepatic lipid concentrations in 3‐week‐old male and female offspring exposed to sucrose or HFCS‐55 during the prenatal and/or suckling periods
| C‐C | S‐S | S‐C | C‐S | P‐value | C‐C | H‐H | H‐C | C‐H | P‐value | |
|---|---|---|---|---|---|---|---|---|---|---|
| 3 week male | n = 6 | n = 6 | n = 6 | n = 6 | n = 6 | n = 6 | n = 6 | n = 6 | ||
| TG (mg 100 g–1) | 1774 ± 218 | 1894 ± 259 | 1358 ± 256 | 1305 ± 98 | 0.196 | 1774 ± 218 | 1511 ± 208 | 1541 ± 148 | 2177 ± 252 | 0.140 |
| FFA (mg 100 g–1) | 161.8 ± 18.2 | 151.4 ± 8.7 | 134.1 ± 15.4 | 144.5 ± 13.0 | *0.592 | 161.8 ± 18.2 | 125.9 ± 10.0 | 148.9 ± 6.6 | 154.3 ± 10.9 | 0.229 |
| Phospholipid (mg 100 g–1) | 2232 ± 77 | 1977 ± 95 | 2313 ± 63 | 2130 ± 95 | *0.063 | 2232 ± 77a, b | 2091 ± 102a, b | 2391 ± 80b | 1959 ± 39a | * 0.009 |
| SFA (mg 100 g–1) | 1380 ± 92 | 1299 ± 80 | 1327 ± 89 | 1235 ± 50 | 0.626 | 1380 ± 92 | 1349 ± 53 | 1306 ± 40 | 1497 ± 175 | 0.631 |
| MUFA (mg 100 g–1) | 697.0 ± 56.5 | 937.9 ± 102.3 | 683.7 ± 111.1 | 674.2 ± 45.0 | 0.123 | 697.0 ± 56.5 | 778.3 ± 74.2 | 643.2 ± 44.2 | 858.0 ± 118.0 | 0.236 |
| n‐3 (mg 100 g–1) | 363.9 ± 13.5a, b | 330.0 ± 32.4a, b | 477.6 ± 56.1b | 326.6 ± 14.3a | 0.020 | 363.9 ± 13.5 | 400.7 ± 20.5 | 437.9 ± 3.2 | 376.0 ± 37.7 | 0.282 |
| n‐6 (mg 100 g–1) | 1240 ± 84 | 1030 ± 73 | 1294 ± 137 | 1033 ± 28 | 0.110 | 1240 ± 84 | 1147 ± 49 | 1230 ± 33 | 1247 ± 153 | 0.885 |
| 3 week female | n = 6 | n = 6 | n = 6 | n = 6 | n = 6 | n = 6 | n = 6 | n = 6 | ||
| TG (mg 100 g–1) | 1079 ± 146 | 1820 ± 304 | 1638 ± 223 | 1390 ± 220 | 0.154 | 1079 ± 146 | 1407 ± 121 | 2000 ± 353 | 2052 ± 245 | ⋀ 0.022 |
| FFA (mg 100 g–1) | 115.2 ± 7.3 | 146.6 ± 3.0 | 138.1 ± 16.6 | 112.9 ± 9.3 | *0.105 | 115.2 ± 7.3 | 117.1 ± 6.2 | 164.4 ± 28.0 | 143.6 ± 3.3 | 0.105 |
| Phospholipid (mg 100 g–1) | 2395 ± 78 | 2239 ± 90 | 2398 ± 65 | 2258 ± 61 | *0.291 | 2395 ± 78 | 2306 ± 84 | 2405 ± 84 | 2274 ± 124 | *0.703 |
| SFA (mg 100 g–1) | 1172 ± 57 | 1340 ± 86 | 1318 ± 28 | 1241 ± 79 | 0.317 | 1172 ± 57 | 1209 ± 48 | 1500 ± 176 | 1491 ± 103 | 0.076 |
| MUFA (mg 100 g–1) | 519.1 ± 49.8a | 842.2 ± 63.6b | 616.3 ± 63.5a, b | 732.8 ± 99.9a, b | 0.026 | 519.1 ± 49.8a | 718.5 ± 43.8a, b | 748.8 ± 98.9a, b | 1021.8 ± 106.8b | 0.003 |
| n‐3 (mg 100 g–1) | 331.1 ± 8.9a | 378.1 ± 29.7a, b | 437.9 ± 26.5b | 336.3 ± 24.2a | 0.023 | 331.1 ± 8.9 | 340.0 ± 21.7 | 477.4 ± 58.6 | 380.3 ± 36.3 | ^ 0.050 |
| n‐6 (mg 100 g–1) | 1039 ± 54 | 1134 ± 91 | 1226 ± 68 | 1037 ± 65 | 0.217 | 1039 ± 54 | 1030 ± 35 | 1395 ± 169 | 1240 ± 97 | 0.059 |
Data are presented as mean ± SEM. The reported P‐value indicates the effect of treatment within each sex, as determined by the one‐way ANOVA. a,bDifferent superscript letters denote mean values that were significantly different from each other (P < 0.05) within each experimental grouping. *A significant effect of offspring sex, independent of treatment, within each experimental grouping. ⋀While the one‐way ANOVA identified a significant effect of treatment, no significant differences were detected between treatments by the Bonferroni post hoc test. TG, triglyceride; MUFA, monounsaturated fatty acid; SFA, saturated fatty acid; FFA, free fatty acid; n‐3, omega‐3; n‐6, omega‐6.
Table 6.
Hepatic lipid concentrations in 12‐week‐old male and female offspring exposed to sucrose or HFCS‐55 during the prenatal and/or suckling periods
| C‐C | S‐S | S‐C | C‐S | P‐value | C‐C | H‐H | H‐C | C‐H | P‐value | |
|---|---|---|---|---|---|---|---|---|---|---|
| 12 week male | n = 6 | n = 5 | n = 6 | n = 6 | n = 6 | n = 6 | n = 6 | n = 6 | ||
| Total liver fat content (%) | 8.1 ± 1.9 | 7.0 ± 0.6 | 7.2 ± 0.9 | 5.1 ± 0.4 | 0.406 | 8.1 ± 1.9 | 5.4 ± 0.7 | 5.7 ± 0.8 | 6.7 ± 0.9 | *0.352 |
| TG (mg 100 g–1) | 1463 ± 128 | 1011 ± 19 | 1410 ± 224 | 1624 ± 128 | *0.279 | 1463 ± 128 | 1313 ± 184 | 1897 ± 195 | 1502 ± 245 | 0.204 |
| FFA (mg 100 g–1) | 104.9 ± 4.5 | 106.4 ± 2.5 | 114.8 ± 7.0 | 107.1 ± 6.6 | *0.601 | 104.9 ± 4.5 | 115.9 ± 6.4 | 124.8 ± 2.3 | 119.2 ± 10.2 | *0.252 |
| Phospholipid (mg 100 g–1) | 2367 ± 148 | 3407 ± 533 | 2406 ± 77 | 2327 ± 21 | ⋀, # 0.036 | 2367 ± 148 | 2421 ± 70 | 2649 ± 193 | 2571 ± 69 | 0.408 |
| SFA (mg 100 g–1) | 1275 ± 50 | 1196 ± 66 | 1290 ± 44 | 1250 ± 65 | *0.723 | 1275 ± 50 | 1255 ± 33 | 1433 ± 46 | 1278 ± 85 | 0.146 |
| MUFA (mg 100 g–1) | 641.6 ± 63.0 | 683.1 ± 180.5 | 683.3 ± 48.9 | 806.1 ± 97.6 | 0.694 | 641.6 ± 63.0 | 762.1 ± 95.5 | 834.5 ± 93.5 | 751.1 ± 115.3 | 0.551 |
| n‐3 (mg 100 g–1) | 261.6 ± 8.6 | 244.3 ± 15.4 | 268.5 ± 10.2 | 253.6 ± 6.7 | *0.420 | 261.6 ± 8.6 | 264.2 ± 5.6 | 289.9 ± 12.2 | 257.5 ± 20.1 | *0.315 |
| n‐6 (mg 100 g–1) | 1362 ± 123 | 1269 ± 35 | 1288 ± 70 | 1143 ± 29 | 0.344 | 1362 ± 123 | 1299 ± 56 | 1598 ± 75 | 1443 ± 184 | 0.350 |
| n‐7 (mg 100 g–1) | 112.4 ± 12.0 | 95.9 ± 5.5 | 116.9 ± 7.0 | 106.4 ± 7.0 | 0.385 | 112.4 ± 12.0 | 148.8 ± 8.4 | 129.1 ± 4.0 | 143.7 ± 10.1 | 0.052 |
| n‐9 (mg 100 g–1) | 506.4 ± 49.7 | 557.3 ± 158.0 | 505.9 ± 69.6 | 676.7 ± 81.6 | 0.507 | 506.4 ± 49.7 | 609.6 ± 92.4 | 687.3 ± 90.8 | 600.9 ± 116.4 | 0.580 |
| 12 week female | n = 6 | n = 5 | n = 6 | n = 6 | n = 6 | n = 6 | n = 6 | n = 6 | ||
| Total liver fat content (%) | 4.4 ± 0.2 | 4.1 ± 0.2 | 9.7 ± 2.3 | 5.6 ± 1.0 | ⋀ 0.032 | 4.4 ± 0.2 | 6.4 ± 1.0 | 6.4 ± 1.6 | 7.4 ± 0.6 | *0.261 |
| TG (mg 100 g–1) | 1883 ± 185 | 1324 ± 151 | 1951 ± 249 | 1927 ± 370 | *0.428 | 1883 ± 185 | 2110 ± 572 | 2350 ± 392 | 1665 ± 198 | 0.605 |
| FFA (mg 100 g–1) | 193.8 ± 42.4 | 138.0 ± 10.3 | 172.2 ± 11.4 | 189.4 ± 36.9 | *0.668 | 193.8 ± 42.4 | 163.1 ± 16.2 | 173.2 ± 18.3 | 237.3 ± 60.3 | *0.554 |
| Phospholipid (mg 100 g–1) | 2555 ± 93 | 2397 ± 69 | 2387 ± 65 | 2493 ± 42 | #0.372 | 2555 ± 93 | 2502 ± 77 | 2497 ± 57 | 2502 ± 66 | 0.939 |
| SFA (mg 100 g–1) | 1618 ± 260 | 1211 ± 67 | 1432 ± 56 | 1597 ± 194 | *0.458 | 1618 ± 260 | 1540 ± 137 | 1518 ± 99 | 1451 ± 272 | 0.951 |
| MUFA (mg 100 g–1) | 837.0 ± 195.3 | 511.3 ± 10.9 | 847.3 ± 91.4 | 875.3 ± 162.9 | 0.516 | 837.0 ± 195.3 | 694.7 ± 88.6 | 743.5 ± 80.4 | 864.0 ± 218.1 | 0.885 |
| n‐3 (mg 100 g–1) | 346.2 ± 52.8 | 268.0 ± 17.8 | 328.3 ± 11.4 | 363.8 ± 42.7 | *0.427 | 346.2 ± 52.8 | 330.3 ± 22.1 | 334.8 ± 23.9 | 358.3 ± 68.1 | *0.973 |
| n‐6 (mg 100 g–1) | 1471 ± 228 | 1175 ± 85 | 1157 ± 35 | 1349 ± 168 | 0.513 | 1471 ± 228 | 1365 ± 159 | 1479 ± 166 | 1291 ± 214 | 0.889 |
| n‐7 (mg 100 g–1) | 117.0 ± 18.1 | 86.4 ± 5.5 | 96.2 ± 6.8 | 107.8 ± 12.4 | 0.416 | 117.0 ± 18.1 | 121.0 ± 19.3 | 107.3 ± 9.8 | 127.7 ± 23.7 | 0.884 |
| n‐9 (mg 100 g–1) | 711.5 ± 177.0 | 419.6 ± 12.7 | 742.9 ± 89.3 | 756.4 ± 151.8 | 0.509 | 711.5 ± 177.0 | 648.8 ± 45.0 | 744.0 ± 126.2 | 726.2 ± 195.8 | 0.983 |
Data are presented as mean ± SEM. The reported P‐value indicates the effect of treatment within each sex, as determined by the one‐way ANOVA. a,bDifferent superscript letters denote mean values that were significantly different from each other (P < 0.05) within each experimental grouping. *A significant effect of offspring sex, independent of treatment, within each experimental grouping. #A significant interaction between treatment and sex, as determined by the two‐way ANOVA. ⋀While the one‐way ANOVA identified a significant effect of treatment, no significant differences were detected between treatments by the Bonferroni post hoc test. TG, triglyceride; MUFA, monounsaturated fatty acid; SFA, saturated fatty acid; FFA, free fatty acid; n‐3, omega‐3; n‐6, omega‐6; n‐7, omega‐7; n‐9, omega‐9.
Hepatic fatty acid composition was significantly altered by perinatal sucrose exposure in both male and female offspring at 3 weeks. Hepatic total MUFA content was increased in female S‐S offspring compared to C‐C offspring (Table 5). In terms of individual MUFAs, hepatic n‐7 MUFA content was higher in both male and female S‐S offspring compared to C‐C offspring, and n‐7 MUFA was also higher in C‐S females compared to C‐C females (males, P = 0.012; females, P = 0.001; Fig. 3 B). In females, S‐S offspring also had increased total hepatic n‐9 MUFA concentrations compared to C‐C offspring (P = 0.033; Fig. 3 C), but this effect was not present in males. Hepatic total n‐3 PUFA content was higher in S‐C females compared to the C‐C and C‐S groups, and was also higher in S‐C compared to C‐S offspring in males (Table 5). There were no effects of maternal sucrose consumption on hepatic SFA or n‐6 PUFA content in either male or female offspring at 3 weeks (Table 5). There were no significant differences between groups for the content of any individual fatty acids at 12 weeks of age in either male or female offspring (Table 6).
Effects of perinatal HFCS‐55 exposure
Body weight and growth
There were no effects of HFCS‐55 exposure during the prenatal and/or suckling periods on offspring body weight at any time point between birth and 12 weeks of age, nose–tail length or abdominal circumference (data not shown), or on body weight at post‐mortem at 3 weeks (Table 1) or 12 weeks (Table 2) of age.
Organ weights
While there were no effects of HFCS‐55 exposure on relative organ weights at 3 weeks (Table 1), at 12 weeks of age female H‐H offspring had a higher relative liver weight when compared to both C‐C and C‐H offspring, an effect not observed in males (Table 2). There were no effects of HFCS‐55 exposure during either the prenatal or the suckling periods on relative heart, adrenal, kidney or pancreas weights in 12‐week‐old offspring, independent of sex (Table 2).
Body fat mass
Exposure to HFCS‐55 during the suckling period alone was associated with increased relative omental fat mass in both male and female offspring at 3 weeks of age compared to C‐C offspring (Table 1). In males, total relative fat mass and relative subcutaneous fat mass were also both higher in C‐H compared to H‐C offspring, but not compared to C‐C offspring, with a trend toward increased relative visceral fat mass in male offspring exposed to HFCS‐55 during suckling, regardless of prenatal exposure (P = 0.056). At 12 weeks of age, however, males exposed to HFCS‐55 during both the prenatal and the suckling periods (H‐H) had a lower relative retroperitoneal fat mass and also tended (P = 0.063) to have a lower relative total visceral fat mass compared to C‐C offspring (Table 2). No other effects of perinatal HFCS‐55 exposure on relative fat mass were observed in offspring at 3 or 12 weeks.
Glucose tolerance
There was no effect of HFCS‐55 exposure on glucose tolerance AUC at either 3 weeks (Table 3) or 12 weeks (Table 4). There were also no effects on any individual blood glucose values during the glucose tolerance test for offspring at 3 or 12 weeks of age (data not shown).
Plasma glucose, hormone and lipid concentrations
At 3 weeks of age, plasma FFA concentrations were higher in offspring exposed to HFCS‐55 only during the prenatal period (H‐C) compared to C‐C offspring in both males and females (males, P = 0.008; females, P = 0.013; Fig. 2 C). This same elevation of plasma FFAs in the H‐C compared to the C‐C group was also observed at 12 weeks of age in both males and females (males, P = 0.006; females, P = 0.039), and at this age, FFA concentrations were also higher in C‐H compared to C‐C offspring in males (Fig. 2 D). At 3 weeks of age, both the HDL cholesterol concentration and the ratio of HDL/LDL cholesterol were lower in C‐H males compared to all other groups, and in C‐H females when compared to H‐H and H‐C only (Table 3). At 12 weeks of age, female H‐C offspring had higher HDL cholesterol compared to C‐C females. Plasma LDL cholesterol was decreased in male and female H‐H and H‐C offspring compared to C‐C offspring, accompanied by an increase in HDL/LDL ratio (Table 4). Plasma insulin tended to be increased in 12‐week‐old H‐C males (P = 0.07), but there were no other effects of perinatal HFCS‐55 exposure on plasma glucose, leptin or TG concentrations.
Hepatic lipid content and fatty acid composition
Exposure to HFCS‐55 during the suckling period only (C‐H) was associated with increased total liver fat content in 3‐week‐old males compared to C‐C, H‐H and H‐C offspring (P < 0.001), with a trend (P = 0.074) toward this same effect in females (Fig. 3 D). Male C‐H offspring had a lower phospholipid content compared to H‐C males only (Table 5). At 3 weeks of age, female C‐H offspring had elevated total MUFAs compared to C‐C females (Table 5). In addition, the n‐7 MUFA content of the liver was increased in females exposed to HFCS‐55 during the suckling period (C‐H and H‐H) compared to C‐C offspring (P < 0.001), and this effect was more pronounced in C‐H than in H‐H offspring (Fig. 3 E). Female C‐H offspring also had an increased hepatic n‐9 MUFA content compared to C‐C offspring (P = 0.004), an effect that was not observed in males (P = 0.348; Fig. 3 F). While the Bonferroni post hoc adjustment did not identify any significant differences between treatment groups, hepatic n‐3 PUFAs appeared to be elevated in 3‐week‐old H‐C females (P = 0.05), with a similar trend observed for hepatic n‐6 PUFAs (P = 0.059) in the same offspring. At 12 weeks, there were no significant changes in total hepatic lipid content nor the content of any of the individual fatty acids, despite a borderline effect on hepatic n‐7 MUFA concentration in males exposed to HFCS‐55 during suckling (P = 0.052).
Discussion
Despite fructose‐containing sweeteners being associated with detrimental health impacts in adults, the effect of maternal consumption of SSBs on the developing offspring is relatively unknown. We previously reported that maternal sucrose and HFCS‐55 consumption were both associated with increased energy intake in dams, but that the metabolic impact of these sugars differed, with sucrose‐fed dams exhibiting increased adiposity and dyslipidaemia, while those that consumed HFCS‐55 tended to develop hyperinsulinaemia (Toop et al. 2015). In this previous study, maternal HFCS‐55 also resulted in lower plasma FFA concentrations in both the dam and their newborn offspring (Toop et al. 2015). The current study builds on these previous findings by following up the offspring exposed perinatally to either sucrose or HFCS‐55 at 3 and 12 weeks of age. We have identified several effects, particularly in relation to body fat mass, plasma FFAs and hepatic lipid composition, and have shown that these are dependent on both the specific sugar involved and the timing of the exposure (i.e. prenatally or during the suckling period).
Neither developmental exposure to sucrose nor HFCS‐55 had any significant impact on offspring body weight at 3 or 12 weeks of age. Therefore, maternal sugar consumption did not appear to either impair or accelerate the postnatal growth trajectory of the offspring before or after weaning. This is consistent with the findings reported by Kendig et al. (2015), who also reported no impact of maternal consumption of a 10% (w/v) sucrose beverage during pregnancy on the body weight of weanling offspring. Other studies that have investigated the effects of maternal sucrose consumption during pregnancy and lactation (D'Alessandro et al. 2012, 2014; Samuelsson et al. 2013), or sucrose or HFCS consumption during either the pregnancy or lactation periods (Bocarsly et al. 2012), have generally reported increased body weight of offspring, dependent on both sex and age. The discrepancies between studies may be explained by differences in maternal sugar consumption, exposure window and the age at which offspring were evaluated.
The major findings of the current study relate to the significant impact of perinatal sucrose and HFCS‐55 exposure on offspring fat mass and hepatic lipid profile. The postnatal window is the major period in which rodents deposit white adipose tissue (Taylor & Poston, 2007), and consistent with other cross‐fostering models investigating the effect of exposure to maternal obesity (Gorski et al. 2006) or consumption of a high‐fat (Sun et al. 2012) or cafeteria (Gugusheff et al. 2013) diet during different developmental windows, exposure to either sucrose or HFCS‐55 during the suckling period was found to have a greater impact on adipose tissue deposition than exposure before birth. Thus, exposure to either sucrose or HFCS‐55 during the suckling period alone, but not during the prenatal period, was associated with increased visceral fat deposition in the 3‐week‐old offspring. This suggests that offspring consumed increased energy during this period, potentially from increased fat and/or energy content of the maternal milk. While these parameters were not measured in the current study, Chicco et al. (2016) reported that maternal consumption of a high‐sucrose diet was associated with increased saturated fat content of the milk. The increased fat mass observed in 3‐week‐old offspring appeared to be mainly driven by deposition in the omental depot. This is significant, as excess visceral fat accumulation is known to be more detrimental to metabolic health than excess fat storage in subcutaneous fat depots (Kershaw & Flier, 2004). Interestingly, visceral adiposity was not significantly increased in offspring exposed to either sugar during both the prenatal and suckling periods. This raises the interesting possibility that prenatal exposure to sugar produces physiological adaptations which ‘prepare’ the individual for a postnatal high‐sugar environment (i.e. a ‘predictive–adaptive’ response), where exposure to either sugar during the suckling period promoted fat deposition only in the absence of exposure earlier in development.
In contrast to reports in humans of increased childhood adiposity being associated with increased fat mass later in life (Biro & Wien, 2010), we found that the elevated fat mass observed at 3 weeks was either normalised, or in some cases actually reduced in comparison to controls, by 12 weeks (young adulthood). Importantly, this occurred despite all offspring having been fed the same diet (standard rodent chow) from weaning. Most notably, 12‐week‐old male offspring exposed to sucrose during the suckling period alone had a lower total relative fat mass and total visceral fat mass (driven by decreased relative omental and gonadal fat mass), while offspring exposed to HFCS‐55 during the prenatal and suckling periods had a lower retroperitoneal fat mass. To our knowledge, this is the first study to report that developmental exposure to sucrose or HFCS‐55 is associated with reduced fat mass in young adult offspring following weaning onto a control diet, as other studies have reported either increased adiposity (Samuelsson et al. 2013) or no change compared to controls (D'Alessandro et al. 2012, 2014). While the mechanism underlying the reduced adiposity remains unknown, it may involve altered adipocyte programming, previously reported in fructose‐exposed offspring (Alzamendi et al. 2010), in particular an upregulation of lipolysis in fat depots and associated increased mobilisation of TGs from adipose stores.
This is supported by our finding of long‐term elevated plasma FFAs in offspring exposed to either sucrose or HFCS‐55, particularly those exposed to sugar during the prenatal period only. FFAs are usually released from the adipose tissue via TG lipolysis when energy levels are low, but this can also occur as a result of aberrant regulation of adipose tissue lipolysis, such that there is a failure to suppress lipolysis when energy stores increase (Capurso & Capurso, 2012). At 3 and 12 weeks, the prenatally exposed offspring were no longer directly exposed to sucrose or HFCS‐55, with offspring consuming the same diet as controls, suggesting that the persistence of higher plasma FFAs at the latter time point is likely to be a consequence of altered adipose tissue programming. While the precise mechanism responsible for the elevated plasma FFAs in the current study remains unclear, it is well established that chronic elevations of circulating FFAs can promote ectopic fat storage, and is associated with adverse metabolic effects, including the development and progression of insulin resistance (Capurso & Capurso, 2012).
A major finding of the current study was that perinatal exposure to either sucrose or HFCS‐55 resulted in significant alterations in hepatic lipid composition, and in HFCS‐55 offspring, hepatic fat content. This is particularly important in light of evidence that intra‐hepatic fat content is more strongly correlated with insulin resistance than extra‐hepatic visceral adiposity (Fabbrini et al. 2009), and that the type of fatty acids which make up the hepatic fat also has important metabolic implications (Puri et al. 2007). In this study, 3‐week‐old male offspring exposed to HFCS‐55 during the suckling period alone had an overall increase in liver fat content compared to control offspring, with a similar trend observed in females. The overall increase in hepatic fat content observed in these offspring is likely to result from increased hepatic de novo lipogenesis, potentially due, at least in part, to an increased availability of circulating FFAs for lipid synthesis.
In addition to affecting total hepatic fat content, we also identified a number of significant effects of perinatal sugar exposure on hepatic lipid composition in the 3‐week‐old offspring. Furthermore, it appeared that consumption of a control chow diet from weaning until 12 weeks of age was sufficient to ameliorate the majority of changes in hepatic lipid content and composition. While both sucrose and HFCS‐55 exposure appeared to impact hepatic lipid composition at 3 weeks, particularly MUFA content, the critical window of exposure differed, with the majority of effects observed in response to HFCS‐55 exposure during the suckling period alone, but sucrose exposure across both the prenatal and the suckling periods. Independent of treatment group, the effects of sugar exposure on liver fatty acid composition were generally more pronounced in female offspring, which may not be surprising given previous evidence that adult female rats are more susceptible to hepatic effects resulting from fructose consumption (Vilà et al. 2011).
The major changes observed in hepatic fatty acid composition were in relation to n‐7, n‐9 and total MUFA content, and n‐3 PUFA content, and differed according to the sugar and window of exposure. Sucrose exposure during both the prenatal and suckling periods increased the hepatic n‐7 and n‐9 MUFA and total MUFA content at 3 weeks of age, and this effect was more pronounced in female offspring, with a smaller increase in n‐7 MUFAs in females exposed only during the suckling period. The critical window differed for HFCS‐55 exposure, such that while female offspring exposed during both the prenatal and suckling periods had increased hepatic n‐7 MUFA content, exposure during the suckling period alone increased total MUFAs, in addition to n‐7 and n‐9 MUFAs, only in female offspring. Both palmitoleic acid (16:1; n‐7) and oleic acid (18:1, n‐9), the two key n‐7 and n‐9 MUFAs, are synthesised de novo in the liver from the desaturation of palmitic acid (16:0) and stearic acid (18:0) by stearoyl‐CoA desaturase (SCD; also known as delta‐9 desaturase), an enzyme associated with the development of hepatic steatosis and obesity (Ntambi et al. 2002; Miyazaki et al. 2004). Therefore, one possible explanation is that perinatal exposure to sucrose or HFCS‐55 resulted in programmed changes in the expression and/or regulation of the SCD‐1 gene, increasing SCD‐1 activity, and consequently, n‐7 and n‐9 MUFA synthesis. In support of this, SCD‐1 expression has previously been shown to be increased in the liver of 3‐week‐old offspring of dams fed a high‐fat and high‐sucrose diet during pregnancy (Wanjihia et al. 2013) and in 6‐month‐old offspring exposed to a high‐fat diet during both the fetal and suckling periods (Seet et al. 2015).
The offspring exposed to sucrose and HFCS‐55 were not directly compared in the current study, and although many of the effects were similar, it appeared that the critical exposure period for hepatic lipid content and concentration in 3‐week‐old offspring differed between these sugars. The least metabolically favourable profile was observed in offspring exposed to sucrose during both the prenatal and suckling periods, but in offspring exposed to HFCS‐55 during suckling only. We believe that this difference may indicate a predictive–adaptive response in offspring exposed to HFCS‐55, such that exposure before birth induced physiological adaptations which conferred protection against the effects of subsequent exposure to HFCS‐55 in the postnatal period. This did not appear to occur in those exposed to sucrose. The underlying biological mechanisms remain to be determined, but may relate to different effects of the sugars on the expression of hepatic genes associated with fructose or lipid metabolism. Another possibility is that consumption of sucrose and HFCS‐55 by dams during lactation had different effects on milk composition, which could potentially account for the differential effects of exposure to HFCS‐55 and sucrose during the suckling period. It was recently reported that fructose is detectable in the breast milk of women, and the fructose concentration was positively associated with infant body weight and fat mass (Goran et al. 2017). Furthermore, Vickers et al. (2011) detected fructose in the stomach contents (a proxy for milk) of 10‐day‐old rat offspring from both control and fructose‐fed dams, with increased plasma fructose levels observed in offspring from fructose‐fed dams only. It is therefore plausible that high maternal fructose consumption, as in our study, may result in elevated fructose in rodent milk. There may have also been a difference in the concentrations of specific milk lipids, as previously reported by Chicco et al. (2016) for dams fed a high‐sucrose diet during lactation, or differences in other milk components. This needs to be investigated in future studies.
Perinatal sugar exposure was also associated with altered hepatic concentrations of n‐3 PUFAs, such that 3‐week‐old female offspring exposed to sucrose before birth had a higher hepatic n‐3 PUFA content compared to controls and those exposed during suckling only. This was unexpected, as n‐3 PUFAs are essential fatty acids that must be obtained from the diet (Mennitti et al. 2015), and intake of chow (the only source of n‐3 PUFAs) was reduced in sucrose‐fed dams (Toop et al. 2015). Placental fatty acid transfer is dependent on maternal plasma fatty acid concentrations, and there do not appear to be any mechanisms that compensate for low levels of maternally derived long‐chain PUFAs in the offspring (Innis, 2008). It is possible that this increase in hepatic n‐3 PUFA content could represent a compensatory response to the relative deficit of n‐3 PUFAs in the maternal diet, where the offspring of sucrose‐fed dams may have accumulated more n‐3 PUFAs during suckling, after being cross‐fostered to a control dam, an effect which persisted at 3 weeks of age. Studies have highlighted the importance of hepatic n‐3 in metabolic regulation, and high levels of n‐3 PUFAs in the liver, resulting from maternal feeding of an n‐3 PUFA‐enriched diet, have been associated with a favourable hepatic fatty acid profile in 3‐day‐old offspring, with increased fatty acid oxidation and reduced SCD‐1 expression (Novak et al. 2012).
The plasma cholesterol profile of offspring appeared to be altered by HFCS‐55 exposure, where 3‐week‐old offspring exposed during suckling had decreased HDL cholesterol and a decreased HDL/LDL ratio, suggestive of a more detrimental blood lipid profile in terms of cardiovascular disease risk and atherosclerosis (Assmann & Gotto, 2004; Grundy et al. 2014), which had disappeared by 12 weeks. Unexpectedly, 12‐week‐old male and female offspring prenatally exposed to HFCS‐55 had a higher HDL/LDL ratio than control offspring, suggestive of a more favourable lipid profile. However, the lipid profile of rodents differs from that of humans (Badimon et al. 2013), so care must be taken when interpreting these findings, particularly as there were no significant changes in plasma triglycerides in offspring.
While there were no effects of exposure to sucrose or HFCS‐55 on glucose tolerance, potential subtle alterations in glucose‐insulin metabolism are suggested by the lower plasma glucose concentrations observed in 3‐week‐old male and female offspring exposed to sucrose during the prenatal and suckling periods. In males, we observed an interesting reduction in relative pancreas weight at 12 weeks of age in offspring exposed to sucrose during either the suckling period alone, or both developmental windows. This is similar to previous findings by Srinivasan et al. (2003), who reported that postnatal consumption of a high‐carbohydrate milk formula by rats increased pancreatic islet number but decreased their size, and was associated with the development of hyperinsulinaemia, which persisted into adult life. While we acknowledge that organ weight is a crude measure of structure or function, our findings nevertheless suggest that pancreatic growth may be particularly sensitive to postnatal sucrose exposure, and this warrants further investigation. Another interesting observation was the decreased relative heart weight observed in 12‐week‐old female offspring exposed to sucrose during either the prenatal or the suckling periods only, a result that is not consistent with the increased heart weight and elevated blood pressure reported by Samuelsson et al. (2013) for females exposed to sucrose during both the prenatal and the suckling periods. Blood pressure was not measured in the current study, so it is unknown whether the smaller heart affected cardiovascular function. Importantly, the reduced relative pancreas and heart weights were not apparent until 12 weeks, which suggest that the full extent of the insult may not become apparent until early adulthood when organ maturation is complete.
While many studies have used rodents for the investigation of altered maternal nutrition during development, the significant differences in developmental timing between humans and rodents must be considered. Rat offspring are relatively under‐developed at birth when compared to humans, and it has been suggested that a rat at postnatal day 12 is approximately equal to a human newborn (Sengupta, 2013). Therefore, the prenatal intervention in this model is more comparable to early to mid‐gestation in human development, and the postnatal intervention would be more comparable to late gestation to early postnatal development in humans. Furthermore, it is important to note that the process of cross‐fostering, in the absence of any other insult, has been shown to affect the cardiovascular and metabolic phenotype of offspring, including increased appetite, body weight, adiposity and hyperinsulinaemia, in addition to increased blood pressure, compared to offspring that remained with their biological mother (Matthews et al. 2011). All offspring in the current study were cross‐fostered to reduce any potential confounding effects, but it cannot be excluded that any metabolic effects associated with the cross‐fostering procedure may have varied between offspring of different treatment groups.
Conclusions
In this study we report that perinatal exposure to maternal consumption of sucrose or HFCS‐55 appears to have some detrimental effects on the offspring, particularly on adiposity, plasma FFAs and hepatic lipid composition, which differed depending on the sugar and the window of exposure. One of the most interesting findings was the difference between critical windows of exposure for the respective sugars in relation to effects on hepatic lipid composition. Exposure to sucrose during both periods, but exposure to HFCS‐55 during sucking only, was associated with a less metabolically favourable hepatic fatty acid profile in 3‐week‐old offspring. Furthermore, the short‐term effects (3 weeks) resulting from exposure to a maternal diet high in sucrose or HFCS‐55 appear to be mostly ameliorated by consumption of a nutritionally balanced diet after weaning. However, these offspring may be at greater risk of a metabolic ‘second‐hit’, where exposure to an additional insult during adult life (nutritional or physiological) may strain the already predisposed organ systems, thereby exacerbating any outcomes compared to control offspring (Vickers, 2014), similar to that previously observed by D'Alessandro et al. (2012, 2014) for sucrose exposure.
Maternal consumption of fructose‐containing sugars appears to negatively affect long‐term programming of offspring in a rodent model, and further research is required to better understand these programmed changes and their potential implications on the capacity of the offspring to adapt to a secondary metabolic challenge in postnatal life. Importantly, our results indicate that exposure to sucrose and HFCS‐55 through the mothers diet, i.e. without direct consumption, is sufficient to produce negative impacts on metabolic health in the offspring. While we acknowledge the limitations of translating this research to humans, the results presented here suggest that limiting maternal consumption of added sugars may improve the short‐ and long‐term metabolic health of the offspring. This is particularly important as there are currently no specific nutritional guidelines regarding the consumption of added sugars by pregnant women. The results from this study also highlight the importance of maternal nutrition during the lactation period, which appears to be equally important as nutrition during pregnancy, and suggest that this should be considered in guidelines for maternal SSB or added sugar consumption.
Additional information
Competing interests
The authors declare no conflicts of interest, financial or otherwise.
Author contributions
C.R.T. participated in the design of the study, acquisition, analysis and interpretation of the data, drafting the manuscript and revising it critically for important intellectual content. B.S.M. participated in the design of the study, analysis and interpretation of the data, and critically revising the manuscript for important intellectual content. K.O'D. participated in the interpretation of the data, and critically revising the manuscript for important intellectual content. S.G. participated in the design of the study, acquisition, analysis and interpretation of the data, drafting the manuscript and revising it critically for important intellectual content. All authors approved the final version of the manuscript, agree to be accountable for all aspects of the work in ensuring that questions related to the accuracy or integrity of any part of the work are appropriately investigated and resolved. All persons designated as authors qualify for authorship, and all those who qualify for authorship are listed. Experiments were conducted at the University of South Australia and the University of Adelaide.
Funding
B.S.M. is funded by a Career Development Award from the National Health and Medical Research Council of Australia (APP1083009). C.R.T. was supported by an Australian Postgraduate Award.
Acknowledgments
The authors wish to thank Pamela Sim from The University of Adelaide for her help with the animal study and assays. We also thank the staff at the Reid Animal Facility at the University of South Australia for their assistance during the animal study, particularly Jayne Skinner. B.S.M. is funded by a Career Development Award from the National Health and Medical Research Council of Australia.
Linked articles This article is highlighted by a Perspective by Gugliucci. To read this Perspective, visit http://doi.org/10.1113/JP274438.
This is an Editor's Choice article from the 1 July 2017 issue.
References
- Alfaradhi M & Ozanne S (2011). Developmental programming in response to maternal over‐nutrition. Front Genet 2, 27. [DOI] [PMC free article] [PubMed] [Google Scholar]
- Alzamendi A, Castrogiovanni D, Gaillard RC, Spinedi E & Giovambattista A (2010). Increased male offspring's risk of metabolic‐neuroendocrine dysfunction and overweight after fructose‐rich diet intake by the lactating mother. Endocrinology 151, 4214–4223. [DOI] [PubMed] [Google Scholar]
- Armitage JA, Taylor PD & Poston L (2005). Experimental models of developmental programming: consequences of exposure to an energy rich diet during development. J Physiol 565, 3–8. [DOI] [PMC free article] [PubMed] [Google Scholar]
- Assmann G & Gotto AM (2004). HDL cholesterol and protective factors in atherosclerosis. Circulation 109(23 Suppl 1), III8–14. [DOI] [PubMed] [Google Scholar]
- Badimon L, Casani L & Vilahur G (2013). Models for the study of atherosclerosis and thrombosis In Animal Models for the Study of Human Disease, ed. Conn PM, pp. 221–239. Academic Press, Boston. [Google Scholar]
- Biro FM & Wien M (2010). Childhood obesity and adult morbidities. Am J Clin Nutr 91, 1499S–1505S. [DOI] [PMC free article] [PubMed] [Google Scholar]
- Bligh EG & Dyer WJ (1959). A rapid method of total lipid extraction and purification. Can J Biochem Physiol 37, 911–917. [DOI] [PubMed] [Google Scholar]
- Bocarsly ME, Barson JR, Hauca JM, Hoebel BG, Leibowitz SF & Avena NM (2012). Effects of perinatal exposure to palatable diets on body weight and sensitivity to drugs of abuse in rats. Physiol Behav 107, 568–575. [DOI] [PMC free article] [PubMed] [Google Scholar]
- Capurso C & Capurso A (2012). From excess adiposity to insulin resistance: the role of free fatty acids. Vascul Pharmacol 57, 91–97. [DOI] [PubMed] [Google Scholar]
- Chicco A, Creus A, Illesca P, Hein GJ, Rodriguez S & Fortino A (2016). Effects of post‐suckling n‐3 polyunsaturated fatty acids: prevention of dyslipidemia and liver steatosis induced in rats by a sucrose‐rich diet during pre‐ and post‐natal life. Food Funct 7, 445–454. [DOI] [PubMed] [Google Scholar]
- Clayton ZE, Vickers MH, Bernal A, Yap C & Sloboda DM (2015). Early life exposure to fructose alters maternal, fetal and neonatal hepatic gene expression and leads to sex‐dependent changes in lipid metabolism in rat offspring. PLOS ONE 10, e0141962. [DOI] [PMC free article] [PubMed] [Google Scholar]
- D'Alessandro ME, Oliva ME, Ferreira MR, Selenscig D, Lombardo YB & Chicco A (2012). Sucrose‐rich feeding during rat pregnancy‐lactation and/or after weaning alters glucose and lipid metabolism in adult offspring. Clin Exp Pharmacol Physiol 39, 623–629. [DOI] [PubMed] [Google Scholar]
- D'Alessandro ME, Oliva ME, Fortino MA & Chicco A (2014). Maternal sucrose‐rich diet and fetal programming: changes in hepatic lipogenic and oxidative enzymes and glucose homeostasis in adult offspring. Food Funct 5, 446–453. [DOI] [PubMed] [Google Scholar]
- Fabbrini E, Magkos F, Mohammed BS, Pietka T, Abumrad NA, Patterson BW, et al. (2009). Intrahepatic fat, not visceral fat, is linked with metabolic complications of obesity. Proc Natl Acad Sci USA 106, 15430–15435. [DOI] [PMC free article] [PubMed] [Google Scholar]
- Folch J, Lees M & Sloane Stanley GH (1957). A simple method for the isolation and purification of total lipides from animal tissues. J Biol Chem 226, 497–509. [PubMed] [Google Scholar]
- Goran MI, Dumke K, Bouret SG, Kayser B, Walker RW & Blumberg B (2013). The obesogenic effect of high fructose exposure during early development. Nat Rev Endocrinol 9, 494–500. [DOI] [PMC free article] [PubMed] [Google Scholar]
- Goran MI, Martin AA, Alderete TL, Fujiwara H & Fields DA (2017). Fructose in breast milk is positively associated with infant body composition at 6 months of age. Nutrients 9, 146. [DOI] [PMC free article] [PubMed] [Google Scholar]
- Gorski JN, Dunn‐Meynell AA, Hartman TG & Levin BE (2006). Postnatal environment overrides genetic and prenatal factors influencing offspring obesity and insulin resistance. Am J Physiol Regul Integr Comp Physiol 291, R768–778. [DOI] [PubMed] [Google Scholar]
- Grundy SM, Arai H, Barter P, Bersot TP, Betteridge DJ & Carmena R (2014). An International Atherosclerosis Society Position Paper: global recommendations for the management of dyslipidemia–full report. J Clin Lipidol 8, 29–60. [DOI] [PubMed] [Google Scholar]
- Gugusheff JR, Vithayathil M, Ong ZY & Muhlhausler BS (2013). The effects of prenatal exposure to a ‘junk food’ diet on offspring food preferences and fat deposition can be mitigated by improved nutrition during lactation. J Dev Orig Health Dis 4, 348–357. [DOI] [PubMed] [Google Scholar]
- Hales CN & Barker DJP (1992). Type 2 (non‐insulin‐dependent) diabetes mellitus: the thrifty phenotype hypothesis. Diabetologia 35, 595–601. [DOI] [PubMed] [Google Scholar]
- Innis SM (2008). Dietary omega 3 fatty acids and the developing brain. Brain Res 1237, 35–43. [DOI] [PubMed] [Google Scholar]
- Johnson RK, Appel LJ, Brands M, Howard BV, Lefevre M, Lustig RH, et al. (2009). Dietary sugars intake and cardiovascular health: a scientific statement from the American Heart Association. Circulation 120, 1011–1120. [DOI] [PubMed] [Google Scholar]
- Kendig MD, Ekayanti W, Stewart H, Boakes RA & Rooney K (2015). Metabolic effects of access to sucrose drink in female rats and transmission of some effects to their offspring. PLOS ONE 10, e0131107. [DOI] [PMC free article] [PubMed] [Google Scholar]
- Kershaw EE & Flier JS (2004). Adipose tissue as an endocrine organ. J Clin Endocrinol Metab 89, 2548–2556. [DOI] [PubMed] [Google Scholar]
- Lustig RH (2013). Fructose: it's “alcohol without the buzz”. Adv Nutr 4, 226–235. [DOI] [PMC free article] [PubMed] [Google Scholar]
- Matthews PA, Samuelsson AM, Seed P, Pombo J, Oben JA, Poston L, & Taylor PD (2011). Fostering in mice induces cardiovascular and metabolic dysfunction in adulthood. J Physiol 589, 3969–3981. [DOI] [PMC free article] [PubMed] [Google Scholar]
- McMillen IC & Robinson JS (2005). Developmental origins of the metabolic syndrome: prediction, plasticity, and programming. Physiol Rev 85, 571–633. [DOI] [PubMed] [Google Scholar]
- Mennitti LV, Oliveira JL, Morais CA, Estadella D, Oyama LM, Oller do Nascimento CM & Pisani LP (2015). Type of fatty acids in maternal diets during pregnancy and/or lactation and metabolic consequences of the offspring. J Nutr Biochem 26, 99–111. [DOI] [PubMed] [Google Scholar]
- Miyazaki M, Dobrzyn A, Sampath H, Lee SH, Man WC, Chu K, Peters JM, Gonzalez FJ & Ntambi JM (2004). Reduced adiposity and liver steatosis by stearoyl‐CoA desaturase deficiency are independent of peroxisome proliferator‐activated receptor‐alpha. J Biol Chem 279, 35017–35024. [DOI] [PubMed] [Google Scholar]
- Mukai Y, Kumazawa M & Sato S (2012). Fructose intake during pregnancy up‐regulates the expression of maternal and fetal hepatic sterol regulatory element‐binding protein‐1c in rats. Endocrine 44, 79–86. [DOI] [PubMed] [Google Scholar]
- Mukai Y, Ozaki H, Serita Y & Sato S (2014). Maternal fructose intake during pregnancy modulates hepatic and hypothalamic AMP‐activated protein kinase signaling in gender‐specific manner in offspring. Clin Exp Pharmacol Physiol 41, 331–337. [DOI] [PubMed] [Google Scholar]
- Novak EM, Keller BO & Innis SM (2012). Metabolic development in the liver and the implications of the n‐3 fatty acid supply. Am J Physiol Gastrointest Liver Physiol 302, G250–259. [DOI] [PubMed] [Google Scholar]
- Ntambi JM, Miyazaki M, Stoehr JP, Lan H, Kendziorski CM, Yandell BS, Song Y, Cohen P, Friedman JM & Attie AD (2002). Loss of stearoyl‐CoA desaturase‐1 function protects mice against adiposity. Proc Natl Acad Sci USA 99, 11482–11486. [DOI] [PMC free article] [PubMed] [Google Scholar]
- Puri P, Baillie RA, Wiest MM, Mirshahi F, Choudhury J, Cheung O, Sargeant C, Contos MJ & Sanyal AJ (2007). A lipidomic analysis of nonalcoholic fatty liver disease. Hepatology 46, 1081–1090. [DOI] [PubMed] [Google Scholar]
- Regnault TRH, Gentili S, Sarr O, Toop CR & Sloboda DM (2013). Fructose, pregnancy and later life impacts. Clin Exp Pharmacol Physiol 40, 824–837. [DOI] [PubMed] [Google Scholar]
- Rodríguez L, Panadero MI, Roglans N, Otero P, Álvarez‐Millán JJ, Laguna JC & Bocos C (2013). Fructose during pregnancy affects maternal and fetal leptin signaling. J Nutr Biochem 24, 1709–1716. [DOI] [PubMed] [Google Scholar]
- Rodríguez L, Otero P, Panadero MI, Rodrigo S, Álvarez‐Millán JJ & Bocos C (2015). Maternal fructose intake induces insulin resistance and oxidative stress in male, but not female, offspring. J Nutr Metab 2015, 158091. [DOI] [PMC free article] [PubMed] [Google Scholar]
- Rodríguez L, Panadero MI, Roglans N, Otero P, Rodrigo S, Álvarez‐Millán JJ, Laguna JC & Bocos C (2016). Fructose only in pregnancy provokes hyperinsulinemia, hypoadiponectinemia, and impaired insulin signaling in adult male, but not female, progeny. Eur J Nutr 55, 665–674. [DOI] [PubMed] [Google Scholar]
- Samuelsson A‐M, Matthews PA, Jansen E, Taylor PD & Poston L (2013). Sucrose feeding in mouse pregnancy leads to hypertension, and sex‐linked obesity and insulin resistance in female offspring. Front Physiol 4, 14. [DOI] [PMC free article] [PubMed] [Google Scholar]
- Sarı E, Yeşilkaya E, Bolat A, Topal T, Altan B, Fidancı K, Saldır M, Erdem G, Gülgün M, Kurt YG & Güven A (2015). Metabolic and histopathological effects of fructose intake during pregestation, gestation and lactation in rats and their offspring. J Clin Res Pediatr Endocrinol 7, 19–26. [DOI] [PMC free article] [PubMed] [Google Scholar]
- Seet EL, Yee JK, Jellyman JK, Han G, Ross MG & Desai M (2015). Maternal high‐fat‐diet programs rat offspring liver fatty acid metabolism. Lipids 50, 565–573. [DOI] [PMC free article] [PubMed] [Google Scholar]
- Sengupta P (2013). The laboratory rat: relating its age with human's. Int J Prev Med 4, 624–630. [PMC free article] [PubMed] [Google Scholar]
- Sloboda DM, Li M, Patel R, Clayton ZE, Yap C & Vickers MH (2014). Early life exposure to fructose and offspring phenotype: implications for long term metabolic homeostasis. J Obes 2014, 203474. [DOI] [PMC free article] [PubMed] [Google Scholar]
- Srinivasan M, Laychock SG, Hill DJ & Patel MS (2003). Neonatal nutrition: metabolic programming of pancreatic islets and obesity. Exp Biol Med (Maywood) 228, 15–23. [DOI] [PubMed] [Google Scholar]
- Stanhope KL, Schwarz JM & Havel PJ (2013). Adverse metabolic effects of dietary fructose: results from the recent epidemiological, clinical, and mechanistic studies. Curr Opin Lipidol 24, 198–206. [DOI] [PMC free article] [PubMed] [Google Scholar]
- Sun B, Purcell RH, Terrillion CE, Yan J, Moran TH & Tamashiro KL (2012). Maternal high‐fat diet during gestation or suckling differentially affects offspring leptin sensitivity and obesity. Diabetes 61, 2833–2841. [DOI] [PMC free article] [PubMed] [Google Scholar]
- Tappy L (2015). Health effects of sugars: in search of novel, unsuspected pathogenic pathways. J Nutr 145, 385–386. [DOI] [PubMed] [Google Scholar]
- Taylor PD & Poston L (2007). Developmental programming of obesity in mammals. Exp Physiol 92, 287–298. [DOI] [PubMed] [Google Scholar]
- Toop CR & Gentili S (2016). Fructose beverage consumption induces a metabolic syndrome phenotype in the rat: a systematic review and meta‐analysis. Nutrients 8, 577. [DOI] [PMC free article] [PubMed] [Google Scholar]
- Toop CR, Muhlhausler BS, O'Dea K & Gentili S (2015). Consumption of sucrose, but not high fructose corn syrup, leads to increased adiposity and dyslipidaemia in the pregnant and lactating rat. J Dev Orig Health Dis 6, 38–46. [DOI] [PubMed] [Google Scholar]
- Tu WC, Cook‐Johnson RJ, James MJ, Muhlhausler BS & Gibson RA (2010). Omega‐3 long chain fatty acid synthesis is regulated more by substrate levels than gene expression. Prostaglandins Leukot Essent Fatty Acids 83, 61–68. [DOI] [PubMed] [Google Scholar]
- Vickers MH (2014). Developmental programming and transgenerational transmission of obesity. Ann Nutr Metab 64(Suppl 1), 26–34. [DOI] [PubMed] [Google Scholar]
- Vickers MH, Clayton ZE, Yap C & Sloboda DM (2011). Maternal fructose intake during pregnancy and lactation alters placental growth and leads to sex‐specific changes in fetal and neonatal endocrine function. Endocrinology 152, 1378–1387. [DOI] [PubMed] [Google Scholar]
- Vilà L, Roglans N, Perna V, Sánchez RM, Vázquez‐Carrera M, Alegret M & Laguna JC (2011). Liver AMP/ATP ratio and fructokinase expression are related to gender differences in AMPK activity and glucose intolerance in rats ingesting liquid fructose. J Nutr Biochem 22, 741–751. [DOI] [PubMed] [Google Scholar]
- Wanjihia VW, Ohminami H, Taketani Y, Amo K, Yamanaka‐Okumura H, Yamamoto H, et al. (2013). Induction of the hepatic stearoyl‐CoA desaturase 1 gene in offspring after isocaloric administration of high fat sucrose diet during gestation. J Clin Biochem Nutr 53, 150–157. [DOI] [PMC free article] [PubMed] [Google Scholar]
- WHO (World Health Organization) (2014). Global Status Report on Noncommunicable Diseases 2014. World Health Organization, Geneva. [Google Scholar]
- WHO (World Health Organization) (2015). Guideline: Sugars Intake for Adults and Children. World Health Organization, Geneva. [PubMed] [Google Scholar]