

Abstract
Key points
Actomyosin ATP hydrolysis occurring during muscle contraction releases inorganic phosphate [Pi] in the myoplasm. High [Pi] reduces force and affects force kinetics in skinned muscle fibres at low temperature. These effects decrease at high temperature, raising the question of their importance under physiological conditions.
This study provides the first analysis of the effects of Pi on muscle performance in intact mammalian fibres at physiological temperature. Myoplasmic [Pi] was raised by fatiguing the fibres with a series of tetanic contractions.
[Pi] increase reduces muscular force mainly by decreasing the force of the single molecular motor, the crossbridge, and alters the crossbridge response to fast length perturbation indicating faster kinetics.
These results are in agreement with schemes of actomyosin ATPase and the crossbridge cycle including a low‐ or no‐force state and show that fibre length changes perturb the Pi‐sensitive force generation of the crossbridge cycle.
Abstract
Actomyosin ATP hydrolysis during muscle contraction releases inorganic phosphate, increasing [Pi] in the myoplasm. Experiments in skinned fibres at low temperature (10–12°C) have shown that [Pi] increase depresses isometric force and alters the kinetics of actomyosin interaction. However, the effects of Pi decrease with temperature and this raises the question of the role of Pi under physiological conditions. The present experiments were performed to investigate this point. Intact fibre bundles isolated from the flexor digitorum brevis of C57BL/6 mice were stimulated with a series of tetanic contractions at 1.5 s intervals at 33°C. As show previously the most significant change induced by a bout of contractile activity similar to the initial 10 tetani of the series was an increase of [Pi] without significant Ca2+ or pH changes. Measurements of force, stiffness and responses to fast stretches and releases were therefore made on the 10th tetanus of the series and compared with control. We found that (i) tetanic force at the 10th tetanus was ∼20% smaller than control without a significant decrease of crossbridge stiffness; and (ii) the force recovery following quick stretches and releases was faster than in control. These results indicate that at physiological temperature the increase of [Pi] occurring during early fatigue reduces tetanic force mainly by depressing the individual crossbridge force and accelerating crossbridge kinetics.
Keywords: crossbridge kinetics, fatigue, phosphate
Key points
Actomyosin ATP hydrolysis occurring during muscle contraction releases inorganic phosphate [Pi] in the myoplasm. High [Pi] reduces force and affects force kinetics in skinned muscle fibres at low temperature. These effects decrease at high temperature, raising the question of their importance under physiological conditions.
This study provides the first analysis of the effects of Pi on muscle performance in intact mammalian fibres at physiological temperature. Myoplasmic [Pi] was raised by fatiguing the fibres with a series of tetanic contractions.
[Pi] increase reduces muscular force mainly by decreasing the force of the single molecular motor, the crossbridge, and alters the crossbridge response to fast length perturbation indicating faster kinetics.
These results are in agreement with schemes of actomyosin ATPase and the crossbridge cycle including a low‐ or no‐force state and show that fibre length changes perturb the Pi‐sensitive force generation of the crossbridge cycle.
Abbreviations
- A0
steady force at which force relaxes after the stretch or release
- A1, A2 and A3
amplitude of exponential components (fraction of tension peak) of the force recovery
- As
amplitude of exponential force component of the tetanus rise
- Cb
crossbridge compliance at tetanus plateau
- Cf
myofilament compliance
- Cte
tendon compliance
- Ctot
total compliance of the fibre
- dlf
fibre length change
- dP
force change
- FDB
flexor digitorum brevis
- l0
fibre length (without tendons)
- lf
clip to clip fibre length (including tendons)
- ls
resting sarcomere length
- P
force on the tetanus rise or during quick recovery
- P0
plateau tetanic force
- k1, k2 and k3
rate constants of the exponential components of the force recovery
- ks
rate constant of the exponential force component of the tetanus rise
- y0
relative extension of the fibre elasticity without tendon
- y0f
relative extension of all the elastic components of the fibres at the tetanus plateau
Introduction
Actomyosin ATP hydrolysis occurring during muscle contraction releases inorganic phosphate (Pi) in the myoplasm, increasing Pi concentration. Pi release is closely coupled to and follows crossbridge force generation (Kawai & Halvorson, 1991; Dantzig et al. 1992; Chase et al. 1993; Tesi et al. 2000, 2002). Data in the literature show that even a moderate amount of muscle activity can increase [Pi] concentration by ∼2–4 times with respect to control (Wilson et al. 1988; Cady et al. 1989; Baker et al. 1994; Mizuno et al. 1994; Gorselink et al. 2001; Yoshida, 2002). In Ca2+‐activated skinned fibres and myofibrils, [Pi] greatly depresses the isometric tension: the increase from 0 to 25 mm reduced tension by 50% or more in rabbit psoas muscle (Cooke & Pate, 1985; Ranatunga et al. 2002; Tesi et al. 2002; Caremani et al. 2008). In addition to depressing tension, [Pi] increase alters the kinetics of actomyosin interaction as shown by the increase of the rate of force development found at high [Pi] in skinned fibres and myofibrils (Kawai & Halvorson, 1991; Walker et al. 1992; Regnier et al. 1995; Tesi et al. 2000, 2002; Caremani et al. 2008) and by the increased rate of tension recovery after a stretch (Ranatunga et al. 2002). Experiments investigating the effect of Pi have generally been performed in mammalian skinned fibre or myofibrils at low temperature (10–12°C); however, it has been shown that the depressant effect of Pi on force greatly decreases with increasing temperature (Debold et al. 2004). Skinned fibres and myofibrils allow us to alter directly the internal environment, and it is therefore relatively easy to increase [Pi] to the desired value; on the other hand it is difficult to do experiments at high temperature while maintaining the regular disposition of the sarcomeres. In addition, skinning introduces swelling of the fibre and loss of small proteins and other components normally present in intact fibres. It is therefore of interest to study the effects of intracellular [Pi] in intact fibres and at physiological temperature. This was the aim of this study.
Experiments were carried out on small fibre bundles isolated from the flexor digitorum brevis mouse muscle. Fibres were fatigued with a series of short isometric tetani at 1.5 s intervals, and the effects were examined after 10 tetani (early fatigue) when tetanic tension was down by ∼20%. Data in the literature showed that at this time [Pi] increased significantly (Mizuno et al. 1994; Gorselink et al. 2001), with little or no change of pH (Westerblad & Allen, 1992; Baker et al. 1994; Mizuno et al. 1994; Yoshida, 2002; Jones et al. 2009) and of myoplasmic [Ca2+], another factor of force alteration (Westerblad & Allen, 1991; Bruton et al. 2003). Only during later phases of fatigue, when tension was greatly reduced, was a [Ca2+] decrease observed. Thus, by exclusion, the most significant change occurring during early fatigue is the increase of Pi concentration. This gave us the opportunity to investigate the effect of [Pi] increase on crossbridge kinetics in intact fibre and at physiological temperature. We found that (i) tetanic force drop (∼20% of control) during the early fatigue occurred without a significant decrease of crossbridge stiffness; and (ii) both the development of tetanus rise upon stimulation and the force recovery following quick stretches and releases were faster than in control conditions. These results indicate that at high temperature the increase of [Pi] occurring during early fatigue reduces tetanic force mostly by depressing the individual crossbridge force and accelerating crossbridge kinetics.
Methods
Ethical approval
The animal use protocol was designed in compliance with the guidelines of the European Communities Council Directive 2010/63/UE and the recommendations for the care and use of laboratory animals and it was approved by the animal care committee of the University of Florence (Italy). All animals were killed by rapid cervical dislocation.
Animals
Thirteen mice (C57BL/6, male, aged 3–5 months, obtained from Envigo RMS Srl, Udine, Italy), were housed at controlled temperature room (21–24°C) with a 12–12 h light–dark cycle. Food and water were provided ad libitum.
Fibre preparation and measurements
Small bundles of up to 10 intact fibres were dissected from the flexor digitorum brevis (FDB) muscles as described previously (Colombini et al. 2009). Small aluminium clips, attached to tendons as close as possible to the fibre ends, were used to mount the fibres horizontally in an experimental chamber (capacity 0.38 ml) between the lever arms of a capacitance force transducer (resonance frequency, 17–33 kHz) and of an electromagnetic motor used to alter fibre length. Fibres were perfused continuously by means of a peristaltic pump at a rate of about 0.35 ml min−1 with a Tyrode solution of the following composition (mm): NaCl, 121; KCl, 5; CaCl2, 1.8; MgCl2, 0.5; Na2HPO4, 0.4; NaHCO3, 24; glucose, 5.5; EDTA, 0.1 and bubbled with 5% CO2–95% O2, which gave a pH of 7.4. Fetal calf serum (0.2%) was routinely added to the solution. All the experiments were performed at 33°C; however, in some of them isometric tension and force response to fast stretches and releases were investigated also at 19°C. Bipolar stimuli (0.5 ms duration and 1.5 times threshold strength) were applied across the fibres by means of two platinum‐plate electrodes mounted parallel to the fibre bundle. Resting fibres length, largest and smallest diameters and resting sarcomere length (l s) were measured under ordinary light illumination using a microscope fitted with a ×20 eyepieces and a ×5 or ×40 dry objective in the experimental chamber and checked on digital images acquired by a video camera (Infinity Camera, Lumenera Corp., Canada) using image processing software. Sarcomere length was measured by counting 10 sarcomeres on a calibrated scale on the acquired images. Fibres were stretched to the length at which tetanic force was maximal, corresponding to a mean sarcomere length of 2.54 ± 0.02 μm (n = 13). Mean clip to clip fibre length including tendons (l f) was 1198 ± 128 μm whereas fibre length without tendons (l 0) was 746 ± 45 μm. Mean tendon length was therefore 450 ± 94 μm. Cross‐sectional area of the bundles was calculated as abπ/4 where a and b are the smaller and the greater diameters (both measured at 2–3 different points along the fibre). Stimuli and fibre length changes were controlled with custom‐written software (LabView, National Instruments, Austin, TX, USA) which was also used to record force and length at sampling time of 1 ms or 10 μs point−1. Control tetanic contractions (400 ms duration, 120 Hz frequency) were performed at 90 s or greater intervals. Plateau tetanic force (P 0) was usually stable during the experiments, but if P 0 decreased by > 10%, the data were discarded.
The fibre bundles were stimulated repetitively with a series of 150 isometric tetani (400 ms, 120 Hz) evoked every 1.5 s. Stiffness and force responses to stretch (step time 150 μs, mean amplitude 0.68 ± 0.02% l f, n = 8) and release (step time 150 μs, and mean amplitude 0.61 ± 0.06% l f, n = 5) applied at tetanus plateau, were measured in control and throughout the whole fatigue; however, the data presented here refer mostly to the comparison of the control data with the data of the 10th tetanus since at this time, but not later, the drop of tetanic force due to early fatigue can be attributed almost exclusively to the increase of [Pi] (Wilson et al. 1988; Westerblad & Allen, 1991, 1992; Baker et al. 1994; Mizuno et al. 1994; Gorselink et al. 2001; Yoshida, 2002; Bruton et al. 2003; Jones et al. 2009).
Fibre stiffness measurements and correction for myofilament and tendon stiffness
To estimate the number of attached crossbridges, we measured fibre stiffness (Ford et al. 1977; Cecchi et al. 1982, 1986) during the tetanus rise and at plateau of control tetani and during fatigue, by applying small 4 kHz sinusoidal length changes (dl f) to one end of the bundle and by measuring the resulting force oscillations (dP) at the other end. Stiffness was expressed as (dP/P 0)/(dl f /l f). Mean dl f peak to peak amplitude was 1.4 ± 0.1 μm (n = 13) corresponding to 0.12 ± 0.01% l f whereas dP mean amplitude was 0.11 ± 0.01P 0. The use of 4 kHz sinusoidal oscillations avoided significant truncation from the quick force recovery (Ford et al. 1977) without introducing significant inertial artefact. None of the records used to measure stiffness in this paper, even at smaller forces, showed a phase shift between force and length sinusoids (for an extended discussion of this subject see Nocella et al. (2011)). Number of crossbridges and individual crossbridge force are here used as synonyms of number of average attached crossbridges and average force per attached crossbridge, respectively. Data were not corrected for the stiffness of the passive control and fatigued fibres, which was smaller than 1% of active stiffness.
Stiffness expressed as (dP/P 0)/(dl f /l f) is the stiffness of the whole bundles (including crossbridge, tendon and myofilament stiffness) and therefore to extract crossbridge stiffness, from which we estimated the crossbridge number, we needed to correct the data for myofilament and tendon stiffness. In principle, tendon compliance (the reciprocal of stiffness) could be calculated from the difference between length changes applied to the preparation and those measured at sarcomere level. However, our FDB preparations were too short and the oscillations applied too small to allow the use of a striation follower as we did in the past with frog single fibres (Colombini et al. 2007). Therefore the contribution of filament compliance to sarcomere compliance was taken from the data in the literature in mammalian muscle as ∼40% (Linari et al. 2004). The contribution of tendon compliance was calculated in the following way: first we measured y 0f, which represents the relative extension (% of l f) at the tetanus plateau of all the elastic components of the fibres: tendon, myofilament and crossbridges. The extension of the fibre elasticity, without tendon (% of l 0), was defined as y 0 (Ford et al. 1977), and hence the difference between y 0f and y 0 represents the extension of the tendon compliance. Y 0 was not measurable in our bundles and therefore it was taken from the available data in the literature for skinned rabbit fibres at 19°C (Linari et al. 2007) as ∼0.77% of sarcomere length or l 0, and this value was extrapolated at 33°C. Since y0 is directly proportional to the increase of force with temperature (Colombini et al. 2007), we measured tetanic force at 19°C and 33°C in the same bundles (n = 5). We found that force at 33°C was 1.41 ± 0.12 times greater than at 19°C. Therefore y 0 at 33°C was calculated as 1.41 × 0.77 = 1.09% of l 0 corresponding to an absolute length change of 746 μm (mean l 0) × 0.0109 or 8.13 μm. Y 0f measured with sinusoidal length oscillations at 4 kHz was 1.11 ± 0.08% l f. Mean l f was 1198 μm, and therefore y 0f corresponds to an absolute length change of 1198 × 0.0111 = 13.29 μm. The difference between 13.29 μm (y 0f) and 8.13 μm (y 0) of 5.16 μm is the length change absorbed by the tendons. Therefore tendon compliance amounts to 5.16/13.29 = 0.39 or 39% of the total fibre compliance. The remaining 61% is due to the sarcomeres and is distributed 40% to myofilaments and 60% to crossbridges (Linari et al. 2004). Thus, in our fibres at tetanus plateau, the mean compliances are distributed as follows: 39% tendon, 24% myofilaments and 37% crossbridges.
Analysis of tetanus rise and force recovery after quick stretch or release in control and fatigued contractions
The time courses of the force development following tetanic stimulation and force recovery after quick stretch or release were analysed on control tetani and on the 10th tetanus of the fatiguing series, approximately at the end of early fatigue. Tetanus rise was fitted with simple exponential equations which gave the best fitting. The fitting of the force recovery, which included phase 2, 3 and 4 of Ford et al. (1977), was made with a triexponential equation. All the fittings were carried out with the Levenberg–Marquardt algorithm available with the software OriginPro (2015; OriginLab Corp., Northampton, MA, USA).
Results
Figure 1 shows an example of experimental records and the experimental procedure in control and fatigued tetani at 33°C. A burst of sinusoidal length oscillations (10–12 cycles) at 4 kHz was applied at tetanus plateau to measure fibre stiffness. Oscillations were followed by a stretch or release to investigate the kinetics of force recovery after the length change.
Figure 1. Sample records illustrating the experimental procedure.
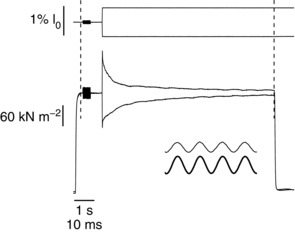
Superimposed sample records of force (lower traces) and length changes (upper traces) following the application of a short burst of sinusoidal length oscillation (thickened regions on the traces) followed by a stretch or release at tetanus plateau. The expanded burst of 4 kHz oscillations (inset) shows the absence of phase shift between force (lower trace) and length sinusoids (upper trace). To obtain the best resolution of fast and slow parts of the records, a double time base was used. The 10 ms time calibration refers to the part of the record inside the dashed vertical lines, and 1 s to the parts outside.
Stiffness and force time courses during early fatigue
The time course of mean force and fibre stiffness changes during early fatigue induced by a series of tetani elicited every 1.5 s in 13 fibres is shown in Fig. 2. Data are expressed relative to plateau control values of force and stiffness (expressed as Young's modulus), which were 366 ± 15 kN m−2 and 33.3 ± 0.4 MN m−2, respectively.
Figure 2. Time course of fibre force and stiffness at tetanus plateau during the initial part of fatigue.
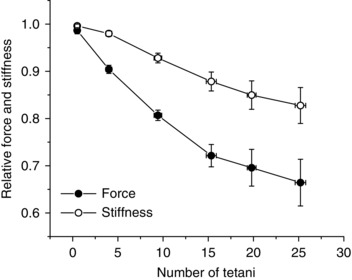
Force and stiffness data are expressed relative to plateau control values. Open circles, stiffness; filled circles, force. Mean values ± SEM (n = 13). Note that plotted fibre stiffness includes stiffness of crossbridge, myofilaments and tendons.
Both force and stiffness fall during fatigue; however, stiffness falls much less than force, in agreement with previous results (Nocella et al. 2011, 2013) and with a recent model of muscle contraction (Smith, 2014). After 10 tetani, force was reduced by ∼20% whereas stiffness fell by only ∼7%. The fall of force can be due to a reduction of crossbridge number or individual crossbridge force or both. A first qualitative answer to this point can be obtained by comparing the stiffness measured during fatigue with the stiffness measured during the tetanus rise, a condition in which the crossbridge stiffness (stiffness of the array of crossbridges) is proportional to the force developed (Bagni et al. 2005; Brunello et al. 2006). The stiffness on the tetanus rise was measured as shown in Fig. 3. Tension was recorded with and without length oscillations superimposed. By subtracting the two traces we obtained the force oscillations centred at zero tension (Fig. 3, trace d) whose peak to peak amplitude is modulated by the stiffness of the fibre. Successively, the absolute value of the peak to peak amplitude was low‐pass fast‐Fourier‐transform filtered at 300–500 Hz to recover the modulation, i.e. the stiffness. In this way stiffness was measured continuously during the tetanus rise (Fig. 3, trace a).
Figure 3. Stiffness and force measurements during the tetanus rise.
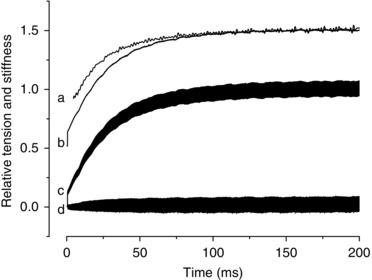
Sinusoidal length oscillations were applied throughout the tetanus rise to measure stiffness. Trace a, stiffness; b, force; c, force with oscillations superimposed; d, difference between c and b. Force and stiffness traces are shifted upward for clarity. The initial step rise of force visible on the tension trace is due to the short period of slow sampling at 1 ms/point preceding the fast sampling at 10 μs point−1.
The x–y plots of the stiffness data from six fibres during fatigue and tetanus rise are compared in Fig. 4. It can be seen that at any given force, stiffness is higher during fatigue. Since both relations were measured in the same fibres and tendon stiffness is not affected by fatigue (Nocella et al. 2011) the difference can only be attributed to a different crossbridge stiffness. A greater stiffness for the same fibre force means that during fatigue there are more crossbridges respect to tetanus rise, and therefore the force per crossbridge is smaller.
Figure 4. Force–stiffness relationships.
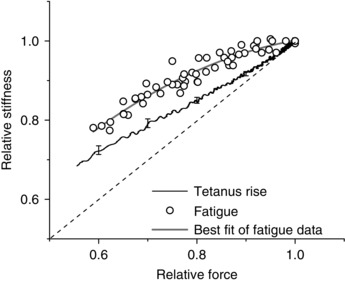
Force–stiffness relationship on the tetanus rise (noisy continuous line) and during fatigue (open circles). Data from the same 6 fibres. The open circles are individual stiffness data and the grey continuous line is the best fit with a polynomial equation used to find the mean values. The noisy continuous line is the average stiffness measured continuously during tetanus rise. The error bars are the SEM at 4 force levels showing the variability. The dashed line represents the direct proportionality between stiffness and force. The deviation of the stiffness on the tetanus rise from the direct proportionality expected from crossbridge stiffness is due to the presence of myofilament and tendon stiffness.
The quantitative changes of crossbridge number were obtained, as reported previously (Nocella et al. 2011) by correcting the fibre stiffness data during fatigue for the compliance of tendon and myofilaments. Calculation (see Methods) showed that mean tendon and filament compliances at plateau of control tetani were 39% and 24% of the total fibre compliance, respectively. However, since tendon compliance is non‐Hookean (Nocella et al. 2011), this proportion needs to be recalculated at each tension during fatigue to obtain crossbridge stiffness. This was done by using the force–stiffness relation during the tetanus rise shown in Fig. 4. Given the series disposition of crossbridges, myofilament and tendon elasticity, the use of the compliance (reciprocal of stiffness) is more convenient for calculation. Considering that crossbridge compliance on the tetanus rise is inversely proportional to the force developed, we can write:
Where C te is the tendon compliance, C tot is the total compliance of the fibre, C b is the crossbridge compliance at tetanus plateau, C f is the filament compliance (assumed to be Hookean), and P/P 0 is the relative force at which the measure was made. From the analysis described in Methods, C b = 0.37 and C f = 0.24. C tot, is the reciprocal of the stiffness data in Fig. 4. At a tension of 0.8P 0, for example, C tot = 1.17 and C te = 1.17 − (0.37 × 1.25) − 0.24 = 0.47, which is ∼20% greater than at P 0. The reciprocal of C te, tendon stiffness, is plotted as function of force in Fig. 5 together with crossbridge and myofilament stiffness.
Figure 5. Calculated crossbridge, myofilament and tendon stiffness as function of force during the tetanus rise.
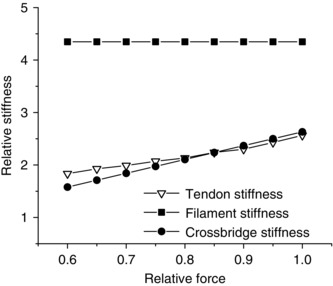
Stiffness is expressed with respect to total fibre stiffness at tetanus plateau taken as 1. Note that tendon stiffness (open triangles) rises with force in a similar, but not equal, way to crossbridge stiffness (filled circles). For the calculation we assumed that filament stiffness (filled squares) was Hookean.
By correcting the stiffness measured at each force during fatigue (data of Fig. 4) for the contribution of myofilament and tendon stiffness (data of Fig. 5), we obtained the crossbridge stiffness shown in Fig. 6 A (filled circles). For comparison we also plotted crossbridge stiffness during the tetanus rise (open triangles), which is simply proportional to force.
Figure 6. Crossbridge stiffness and force during fatigue and tetanus rise.
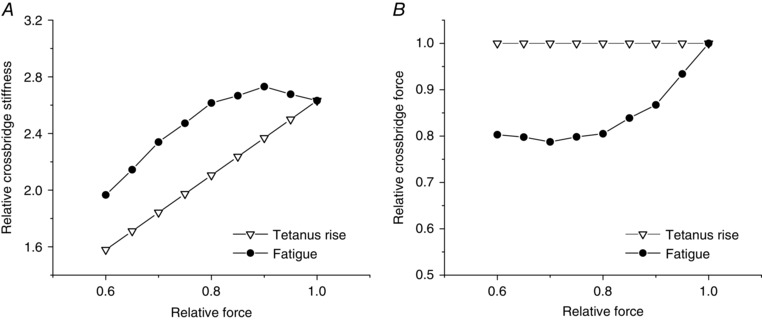
Crossbridge stiffness (A) and individual crossbridge force (B) during tetanus rise (open triangles) and fatigue (filled circles). Stiffness in A is expressed with respect to total fibre stiffness at tetanus plateau taken as 1. At any tension, crossbridge stiffness, proportional to crossbridge number, is higher during fatigue than during tetanus rise.
It can be seen that during the early fatigue crossbridge stiffness remains almost constant, increasing slightly, whereas force decreased by ∼20%. This confirms that fall of force is accounted for by a decrease of force per crossbridge rather than by a decrease of crossbridge number. This means that the drop of 7% of the fibre stiffness shown in Fig. 4 is due to the non‐linear stiffness of tendon elasticity. As tension decrease from 1 to 0.8P 0, tendon stiffness decreases and lowers the fibre stiffness. Figure 6 B shows the individual crossbridge force during fatigue, calculated by the ratio force/crossbridge stiffness, plotted against force. The force per crossbridge drops by about the same extent as fibre force up 0.8P 0, then it remains constant.
Early fatigue also affects the speed of tetanus rise, which becomes significantly faster in the 10th tetanus with respect to control. This can be seen in Fig. 7 A. The effect is qualitatively similar to that reported previously at lower temperature in mammalian intact (Nocella et al. 2011) and skinned fibre or myofibrils (Regnier et al. 1995; Tesi et al. 2000; Caremani et al. 2008). The fitting of the control tetanus rise required a single exponential equation. Two exponentials were instead necessary for fitting the 10th tetanus. The fit was made after the exclusion of the initial slow ‘foot’ of force, which was always smaller than 10% P 0. An example is shown in Fig. 7 B. The rate constant was 33 ± 1 s−1 (n = 8) in control, and 52 ± 2 s−1 for the faster rate and 11 ± 1 s−1 (n = 8) for the slower one in fatigued fibres. Relative amplitude was 0.94 ± 0.01P 0 in control condition, and 0.73 ± 0.02P 0 and 0.19 ± 0.02P 0 during fatigue for the faster and slower component, respectively.
Figure 7. Effects of early fatigue on the tetanus rise and fitting with a single exponential equation.
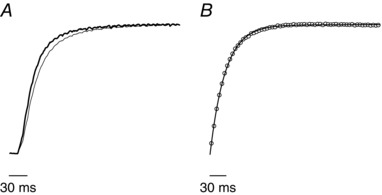
A, effects of early fatigue on the tetanus rise. Control, thin line; 10th tetanus, thick line. Both records are normalized for their respective P 0. B, fit (continuous line) of the control tetanus rise (empty circles). The fitting equation is , where A s is amplitude of exponential force component of the tetanus rise and k s is rate constant of the exponential force component of the tetanus rise. Experimental force data were sampled at 1 ms/point but the number of points plotted on the figure were reduced for clarity.
Stretch and release responses in control and during early fatigue
To examine crossbridge response to fast length perturbation (step time 150 μs), stretches (amplitude 0.68% l f) and releases (amplitude 0.61% l f), were applied in control tetanus and at the 10th tetanus of the fatigue when tension was down by ∼20% with respect to control. Figure 8 shows an example of the responses obtained.
Figure 8. Responses to stretch and release in control tetani and during fatigue.
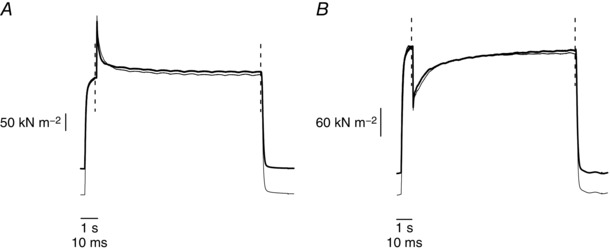
Sample records of force responses to stretch (A) and release (B) applied in control tetanus (thin line) and at the 10th tetanus of the fatigue protocol (thick line). Traces are vertically shifted to superimpose the tetanic force just before the stretch. Faster time base (10 ms calibration) refers to the record between the two dashed vertical lines, lower time base (1 s calibration) to the record outside the lines. Force recovery is faster in the 10th tetanus than in control.
The shape of the force recovery is similar to that described by Ford et al. (1977) in frog fibre at low temperature; there are only quantitative differences due to the different preparation and temperature. During early fatigue the force recovery from stretch and release is faster than in control. To quantify these changes, we fitted the whole recovery starting from the end of the length change up to the final steady tension, with a three‐exponential curve. The fitting included phase 2, 3 and 4 of force recovery (Ford et al. 1977) and was made on the force normalized between the start and the end of the recovery (taken as 0 and 1, respectively). Typical fits are shown in Fig. 9 and the results obtained are summarized in Table 1.
Figure 9. Fitting with a triexponential equation of force recovery from stretch (A) and release (B) applied at tetanus plateau in control tetani.
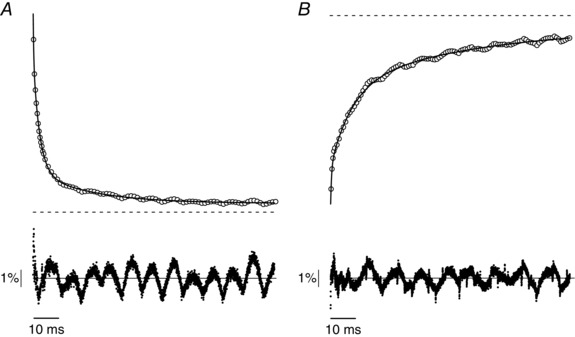
Top traces, forces (open circles) and fittings (continuous line); horizontal dashed line is the plateau force. Bottom traces, residuals. The noise is mostly due to oscillations of the stretcher lever arm. Stretch amplitude, 0.67% l f; release amplitude, 0.63% l f. The fitting equation is show in Table 1. Experimental force data were sampled at 10 μs point−1 but the number of points plotted on figures were reduced for clarity.
Table 1.
Fitting parameters of tension recovery following stretch and release in control and at 10th tetanus during fatigue
| Stretch (mean±SEM) | Release (mean±SEM) | |||
|---|---|---|---|---|
| Control | Early fatigue | Control | Early fatigue | |
| A 0 | 0.06 ± 0.01 | 0.12 ± 0.01* | 0.01 ± 0.03 | 0.007 ± 0.012 |
| A 1 | 0.23 ± 0.02 | 0.22 ± 0.03 | 0.17 ± 0.02 | 0.16 ± 0.01 |
| k 1 | 4.2 ± 0.9 | 4.5 ± 0.8 | 6 ± 1 | 4.3 ± 0.3 |
| A 2 | 0.55 ± 0.01 | 0.47 ± 0.02* | 0.45 ± 0.04 | 0.38 ± 0.05 |
| k 2 | 0.31 ± 0.02 | 0.50 ± 0.05* | 0.145 ± 0.008 | 0.21 ± 0.02* |
| A 3 | 0.16 ± 0.02 | 0.17 ± 0.02 | 0.33 ± 0.04 | 0.44 ± 0.02* |
| k 3 | 0.030 ± 0.001 | 0.045 ± 0.001* | 0.022 ± 0.001 | 0.025 ± 0.001* |
The fitting equation is: . A 0 (steady force at which force relaxes after the stretch or release) and A 1, A 2 and A 3 (amplitudes of the 3 exponential components) are expressed as the fraction of tension peak; rate constants k 1, k 2 and k 3 are expressed as 103 s−1. Asterisks indicate statistically significant changes (P < 0.05) with respect to control.
Fatigue affected the force recovery from stretches or releases in the same way: it increased the intermediate and the slower rate constants k 2 and k 3 but had no effect on the fastest rate constant k 1. Fatigue also increased A 0, the steady force attained at end of recovery after the stretch. A 0 was not different from zero after the release and was not affected by fatigue. A further effect was a slight amplitude reduction of the intermediate fitting component (A 2) for stretches and of the slower component (A 3) for releases.
Discussion
In this study we investigated the effects of fatiguing small bundles of mouse muscle fibres with a series of short tetani at physiological temperature on crossbridge characteristics. Tetanic force, stiffness, force development following stimulation and force transients following fast stretches or releases were studied in control tetani before fatigue and at the 10th tetanus of the fatiguing series when tension was reduced by ∼20%. 31P‐NMR experiments in the literature on different muscle preparations with a fatiguing protocol comparable to that used in this study have shown that [Pi] increased significantly (2–4 times) early during stimulation (Baker et al. 1994; Mizuno et al. 1994; Gorselink et al. 2001; Yoshida, 2002). Gorselink et al. (2001), in particular, showed that the stimulation of skeletal mouse muscle with 12 short consecutive tetani, a slightly fatiguing protocol very similar to ours, induced a ∼10% force reduction and reduced phosphocreatine to 53 μmol/g dry weight compared with 73.7 μmole/g dry weight of the control, with a corresponding increase of Pi concentration. A similar Pi increase was also shown by Mizuno et al. (1994) in rat skeletal muscle: the repetitive stimulation of the muscle at 1 Hz, for example, led to a [Pi] increase from 4.9 mm of the control to 14.3 mm after only 30 consecutive stimuli. The initial rapid increase of Pi was also shown by Baker et al. (1994) and by Yoshida (2002) in humans. All these experiments indicate that early fatigue is accompanied by a significant increase of Pi concentration even when tetanic force is reduced by only 20% or less. The increase of Pi during early fatigue was accompanied by almost no change in pH: Mizumo et al. (1994) observed a pH reduction of only 0.1 unit from 7.2 to 7.1 and a similar small reduction was found by Jones et al. (2009) in humans and by Baker et al. (1994) in rat. Westerblad and Allen (1992), in single mouse fibres, found a slight pH increase of 0.02 pH unit and a similar increase was found in humans by Yashida (2002). Myoplasmic [Ca2+], another factor of force alteration, remained constant or increased little during early fatigue. Only during later phases of fatigue, when tension was greatly reduced, a Ca2+ decrease was observed (Westerblad & Allen, 1991; Bruton et al. 2003). A seemingly contrasting results was reported by Allen et al. (2011): they found that Ca2+ fell during all the fatigue period. However, the first [Ca2+] measure was made when tension was already down by∼ 40%, when the early phase of fatigue was over and in about the same range of force reduction where a [Ca2+] fall is expected. On the bases of these results we assumed that changes of muscle characteristics during early fatigue are mostly attributable to [Pi] changes whereas pH and Ca2+ changes were of minor importance. Other possible factors involved in fatigue such as phosphorylations or increase of reactive oxygen species (ROS), are unlikely to produce a significant effect during the short period of early fatigue. Thus, slightly fatigued fibres gave us the opportunity to investigate the effects of increasing intracellular [Pi] in intact fibres and, most importantly, at physiological temperature. The results are discussed in relation with previous studies investigating Pi effects mostly made in skinned fibres and myofibrils and most often at low temperature (Kawai & Halvorson, 1991; Potma et al. 1995; Regnier et al. 1995; Tesi et al. 2000; Ranatunga et al. 2002; Tesi et al. 2002; Caremani et al. 2008).
Stiffness
To measure the crossbridge number during fatigue we corrected fibre stiffness data (Fig. 4) for tendon and myofilament stiffness to extract crossbridge stiffness. Corrected data showed that during early fatigue, crossbridge stiffness remained nearly constant indicating that the associated force decline was caused mainly by a reduction of the individual crossbridge force. Stiffness correction was made by taking y 0 from the literature and extrapolating its value at high temperature. We also assumed that crossbridges and myofilaments contribute to sarcomere compliance in the proportions of 60% and 40%, respectively (Linari et al. 2004) and for simplicity that both have a Hookean compliances although some data suggest a possible non‐linearity (Colombini et al. 2010). While these values and assumptions are subject to a degree of uncertainty, we showed earlier that calculation of crossbridge stiffness was relatively insensitive to changes in myofilament, crossbridge and tendon compliances: changing the ratio between crossbridge and myofilament compliances or changing tendon compliance by ±20% affects the calculated crossbridge stiffness by less than 2%. But more importantly, the data of Fig. 4 show that at the same force, stiffness during fatigue is higher than during the tetanus rise. As tendon stiffness does not change with fatigue (Nocella et al. 2011), and myofilament stiffness is not affected by [Pi] changes (Caremani et al. 2008), this difference can only be attributed to the increase of crossbridge stiffness (and number) during fatigue, independently of all the above assumptions. A greater number of crossbridges with the same total force means a smaller individual crossbridge force. It follows that [Pi] increase occurring during early fatigue reduces crossbridge individual force and this reduction accounts for almost all the tetanic force drop. A conclusion opposite to this, i.e. that increasing [Pi] decreases crossbridge number without altering individual crossbridge force, was reached in a report in skinned fibre at low temperature (Caremani et al. 2008). The reason for this discrepancy is uncertain but differences in the experimental conditions, especially temperature, may account for it: it is known in fact that the effects of Pi on force depression are much stronger at low than at high (physiological) temperature (Coupland et al. 2001; Debold et al. 2004). Thus it is possible that at low temperature increasing [Pi] induces a reduction of crossbridge number. Our data of Fig. 6 show that in contrast to the early fatigue, the drop of force occurring after the 10th tetanus (at force lower than ∼80% P 0) is accompanied by a proportional crossbridge stiffness reduction indicating a decrease of crossbridge number. Although this reduction could be due to later effects of fatigue (as decreasing of pH, decreasing calcium release, for example) it cannot be excluded that the further increase of [Pi] above that occurring at the 10th tetanus reduces crossbridge number without further effect on crossbridge individual force. Thus, in general, it is possible that Pi reduces force by reducing both the force per crossbridge and crossbridge number, but this last effect occurs mostly at high Pi concentration or at low temperature where Pi is more effective.
Tetanus rise
Figure 7 A shows that tension development during tetanus rise becomes faster in the 10th tetanus compared to control, in agreement with previous data at lower temperature (Caremani et al. 2008; Nocella et al. 2011). The best fitting of the data required only one exponential for the control and two exponentials for the 10th tetanus. The rate constant for control was 33 s−1. The two components of the 10th tetanus were 52 s−1, amplitude 0.73P 0 and 11 s−1, amplitude 0.19P 0. The meaning of the slower and smaller component is unknown; it could be due to a small force creeping due to possible sarcomere non‐homogeneity developing during fatigue. These results are equivalent to the finding in skinned fibre at low temperature showing that force redevelopment after a period of shortening at V max (Caremani et al. 2008), or in myofibrils after a release–restretch protocol (Regnier et al. 1995; Tesi et al. 2000), becomes faster, increasing [Pi]. Quantitative differences are likely to be due to the different experimental preparation and temperature. It should be also considered that tetanus rise and tension redevelopment after shortening at V max or after a release–restretch protocol are not strictly equivalent.
Effect of Pi on force transient following stretch or release
Stretch
Figure 8 A shows that the force response of the fibre to fast stretches is affected by the early fatigue. The comparison with control shows that tension peak of the 10th tetanus relaxes faster and to a higher steady tension. The fitting of the force recovery required three exponentials. The fastest rate constant k 1 was insensitive to early fatigue whereas the intermediate k2 and the slower one k 3 increased. These results can be compared with those of Ranatunga et al. (2002) showing a similar effect when [Pi] was raised up to 25 mm in skinned fibre at low temperature. There are, however, some experimental and procedural differences: Ranatunga et al. (2002) fitted only phase 2 of force recovery of Ford et al. (1977) and found two rate constants, 2a (fast) and 2b (slow). In this study the fitting was instead made on the complete force recovery involving phase 2, 3 and 4 of Ford et al. (1977) and required three rate constants. Since phase 2 in our data lasts for about 1.5–2 ms, the fastest rate constant k 1 of ∼4000 s−1 is attributable only to the fastest part of phase 2, which may be compared, when considering the different temperatures, to phase 2a of Ranatunga et al. (2002) (1000–2000 s−1). k 1 was not affected by fatigue, which seems equivalent to the insensitivity of phase 2a of Ranatunga et al. (2002) to [Pi]. The intermediate rate constant k 2 of 310 s−1 in the control tetanus includes the slower part of phase 2 and phase 3 and it is comparable to phase 2b of Ranatunga et al. (2002), which increased with [Pi]. Similarly, k 2 increased in the 10th tetanus. Again, quantitative differences with our experiments are likely to be due to the different experimental temperature. The smallest rate constant, k 3, describes the slower part of the recovery when tension approaches the steady state A 0. k 3 too is sensitive to [Pi], increasing in the 10th tetanus. The observations that the increased rate of tension development during tetanus rise and of force recovery after a stretch were also found in skinned fibre upon increasing [Pi] confirm the hypothesis that changes during early fatigue are mostly attributable to [Pi] increase. A further interesting effect of early fatigue was the increase of the steady level (A 0) at which force recovery settled after a stretch. A similar response to stretches was described previously and termed ‘static tension’ (Nocella et al. 2014; Rassier et al. 2015; Colombini et al. 2016). Static tension was independent of crossbridges and was attributed to stretching of titin filaments stiffened by the increase of intracellular [Ca2+] following activation (Bagni et al. 2004). Thus the increase of A 0 might be due to a stiffening of titin during fatigue, but further experiments are necessary to clarify this point.
Release
Figure 8 B shows the effects of early fatigue on the force transient following a quick release. With respect to the force transient of Ford et al. (1977), the amplitude of phase 2 is smaller and the reversal or reduction of the rate of force recovery, which represents phase 3, is very much reduced or missing. This difference is likely to be due to the different experimental temperature, as suggested by the comparison of the recovery at 19 and 33°C (data not shown). The force recovery is faster during early fatigue than in control. Both k 2 and k 3 increased whereas k 1 did not change, exactly as in the stretch experiments. In contrast, Ranatunga et al. (2002) were unable to find a change of 2b with increasing [Pi]; however, they did not exclude the possibility that this change could be present. Phase 4 represents the slow recovery of tension to the pre‐stretch level resembling the tetanic tension rise (Ford et al. 1977). Our results show that k 3 increased during early fatigue, similarly to the rate constant for the tetanus rise. The increase of k 3 also occurred during recovery from stretches.
Pi and crossbridge cycle
The effects of increased [Pi] on crossbridge force during early fatigue can be accounted for by schemes of actomyosin ATPase and crossbridge cycles in which a no‐force or a low‐force crossbridge state exists (Regnier et al. 1995). Elevated [Pi] can push the crossbridges into the low or no‐force generating configuration decreasing force but not stiffness. This model could also account for the decrease of crossbridge stiffness observed at later times during fatigue. Although this effect could be due to other factors playing a role in later phases of fatigue, such as decrease of pH, Ca2+ release or increased ROS, it cannot be excluded that part of this effect is due to the elevated [Pi] that can lead to crossbridge detachment. The increased rate of force rise is expected on a kinetic basis when intracellular [Pi] increases, and this has been demonstrated previously in skinned fibres and in small myofibril bundles (Hibberd et al. 1985; Millar & Homsher 1990; Tesi et al. 2000; Takagi et al. 2004; Caremani et al. 2008; Ranatunga, 2010). Increased [Pi] also increased the rate of force recovery after a fast length perturbation. Except for the very fast phase (k 1), which was insensitive, the intermediate and slow rate of recovery both increased with [Pi]. This is expected as the rate of tension recovery after a perturbation increases with [Pi] (Ranatunga et al. 2002). It follows that the slower part of phase 2 and phase 3 (k 2), and phase 4 (k 3) of the force transients following stretches and release, all represent perturbations of the [Pi]‐sensitive force generation step. This conclusion is similar to the previous ones correlating force generation with part of phase 2 (2b in Ranatunga et al. 2002), or phase 3 (Kawai et al. 1993; Wang & Kawai, 2001).
Conclusion
The results reported in this paper show that in intact muscle fibre at physiological temperature the increase of [Pi] induced by fatigue reduces tetanic force by depressing the individual crossbridge force. It is not excluded, however, that at low temperature when Pi effects are stronger or at [Pi] higher than that reached during early fatigue, Pi decreases force also by reducing crossbridge number. High [Pi] also increases the rate constant for force development during the tetanus rise and for tension recovery after a quick stretch or release as expected from current schemes of actomyosin ATPase and the crossbridge cycle.
Additional information
Competing interests
The authors declare that they have no competing interests.
Author contributions
Experiments were carried out at the Division of Physiology, Department of Experimental and Clinical Medicine, University of Florence. The authors contributed to the paper as follows: G.G. and B.C. designed the research; M.N. and B.C. performed the research; M.N., G.C. and B.C. analysed and interpreted the data, and wrote the manuscript. All authors have approved the final version of the manuscript and agree to be accountable for all aspects of the work. All persons designated as authors qualify for authorship, and all those who qualify for authorship are listed.
Funding
This study was supported by the Ministero dell'Università e della Ricerca (MIUR‐PRIN project 2010R8JK2X Cecchi‐Colombini), ECRF 2011.0302 and University of Florence (ex 60%‐Colombini2013), Italy. The funders had no role in study design, data collection and analysis, decision to publish, or preparation of the manuscript.
Acknowledgements
We wish to thank Prof. Chiara Tesi for helpful comments and discussions.
References
- Allen DG, Clugston E, Petersen Y, Röder IV, Chapman B & Rudolf R (2011). Interactions between intracellular calcium and phosphate in intact mouse muscle during fatigue. J Appl Physiol (1985) 111, 358–366. [DOI] [PubMed] [Google Scholar]
- Bagni MA, Cecchi G & Colombini B (2005). Crossbridge properties investigated by fast ramp stretching of activated frog muscle fibres. J Physiol 565, 261–268. [DOI] [PMC free article] [PubMed] [Google Scholar]
- Bagni MA, Colombini B, Geiger P, Berlinguer Palmini R & Cecchi G (2004). Non‐cross‐bridge calcium dependent stiffness in frog muscle fibres. Am J Physiol Cell Physiol 286, C1353–C1357. [DOI] [PubMed] [Google Scholar]
- Baker AJ, Carson PJ, Miller RG & Weiner MW (1994). Metabolic and nonmetabolic components of fatigue monitored with 31P‐NMR. Muscle Nerve 17, 1002–1009. [DOI] [PubMed] [Google Scholar]
- Brunello E, Bianco P, Piazzesi G, Linari M, Reconditi M, Panine P, Narayanan T, Helsby WI, Irving M & Lombardi V (2006). Structural changes in the myosin filament and cross‐bridges during active force development in single intact frog muscle fibres: stiffness and X‐ray diffraction measurements. J Physiol 577, 971–984. [DOI] [PMC free article] [PubMed] [Google Scholar]
- Bruton J, Tavi P, Aydin J, Westerblad H & Lännergren J (2003). Mitochondrial and myoplasmic [Ca2+] in single fibres from mouse limb muscles during repeated tetanic contractions. J Physiol 551, 179–190. [DOI] [PMC free article] [PubMed] [Google Scholar]
- Cady EB, Jones DA, Lynn J & Newham DJ (1989). Changes in force and intracellular metabolites during fatigue of human skeletal muscle. J Physiol 418, 311–325. [DOI] [PMC free article] [PubMed] [Google Scholar]
- Caremani M, Dantzig J, Goldman YE, Lombardi V & Linari M (2008). Effect of inorganic phosphate on the force and number of myosin cross‐bridges during the isometric contraction of permeabilized muscle fibers from rabbit psoas. Biophys J 95, 5798–5808. [DOI] [PMC free article] [PubMed] [Google Scholar]
- Cecchi G, Griffiths PJ & Taylor S (1982). Muscular contraction: kinetics of crossbridge attachment studied by high‐frequency stiffness measurements. Science 217, 70–72. [DOI] [PubMed] [Google Scholar]
- Cecchi G, Griffiths PJ & Taylor S (1986). Stiffness and force in activated frog skeletal muscle fibers. Biophys J 49, 437–451. [DOI] [PMC free article] [PubMed] [Google Scholar]
- Chase PB, Martyn DA, Kushmerick MJ & Gordon AM (1993). Effects of inorganic phosphate analogues on stiffness and unloaded shortening of skinned muscle fibres from rabbit. J Physiol 460, 231–246. [DOI] [PMC free article] [PubMed] [Google Scholar]
- Colombini B, Bagni MA, Romano G & Cecchi G (2007). Characterization of actomyosin bond properties in intact skeletal muscle by force spectroscopy. Proc Natl Acad Sci USA 104, 9284–9289. [DOI] [PMC free article] [PubMed] [Google Scholar]
- Colombini B, Benelli G, Nocella M, Musaro A, Cecchi G & Bagni MA (2009). Mechanical properties of intact single fibres from wild‐type and MLC/mIgf‐1 transgenic mouse muscle. J Muscle Res Cell Motil 30, 199–207. [DOI] [PubMed] [Google Scholar]
- Colombini B, Nocella M & Bagni MA (2016). Non‐crossbridge stiffness in active muscle fibres. J Exp Biol 219, 153–160. [DOI] [PubMed] [Google Scholar]
- Colombini B, Nocella M, Bagni MA, Griffiths PJ & Cecchi G (2010). Is the cross‐bridge stiffness proportional to tension during muscle fiber activation? Biophys J 98, 2582–2590. [DOI] [PMC free article] [PubMed] [Google Scholar]
- Cooke R & Pate E (1985). The effects of ADP and phosphate on the contraction of muscle fibers. Biophys J 48, 789–798. [DOI] [PMC free article] [PubMed] [Google Scholar]
- Coupland ME, Puchert E & Ranatunga KW (2001). Temperature dependence of active tension in mammalian (rabbit psoas) muscle fibres: effect of inorganic phosphate. J Physiol 536, 879–891. [DOI] [PMC free article] [PubMed] [Google Scholar]
- Dantzig JA, Goldman YE, Millar NC, Lacktis J & Homsher E (1992). Reversal of the cross‐bridge force‐generating transition by photogeneration of phosphate in rabbit psoas muscle fibres. J Physiol 451, 247–278. [DOI] [PMC free article] [PubMed] [Google Scholar]
- Debold EP, Dave H & Fitts RH (2004). Fiber type and temperature dependence of inorganic phosphate: implications for fatigue. Am J Physiol Cell Physiol 287, C673–C681. [DOI] [PubMed] [Google Scholar]
- Ford LE, Huxley AF & Simmons RM (1977). Tension responses to sudden length change in stimulated frog muscle fibres near slack length. J Physiol 269, 441–515. [DOI] [PMC free article] [PubMed] [Google Scholar]
- Gorselink M, Drost MR, Coumans WA, van Kranenburg GP, Hesselink RP & van der Vusse GJ (2001). Impaired muscular contractile performance and adenine nucleotide handling in creatine kinase‐deficient mice. Am J Physiol Endocrinol Metab 281, E619–E625. [DOI] [PubMed] [Google Scholar]
- Hibberd MG, Dantzig JA, Trentham DR & Goldman YE (1985). Phosphate release and force generation in skeletal muscle fibers. Science 228, 1317–1319. [DOI] [PubMed] [Google Scholar]
- Jones DA, Turner DL, McIntyre DB & Newham DJ (2009). Energy turnover in relation to slowing of contractile properties during fatiguing contractions of the human anterior tibialis muscle. J Physiol 587, 4329–4338. [DOI] [PMC free article] [PubMed] [Google Scholar]
- Kawai M & Halvorson HR (1991). Two step mechanism of phosphate release and the mechanism of force generation in chemically skinned fibers of rabbit psoas muscle. Biophys J 59, 329–342. [DOI] [PMC free article] [PubMed] [Google Scholar]
- Kawai M, Saeki Y & Zhao Y (1993). Crossbridge scheme and the kinetic constants of elementary steps deduced from chemically skinned papillary and trabecular muscles from the ferret. Circ Res 73, 35–50. [DOI] [PubMed] [Google Scholar]
- Linari M, Bottinelli R, Pellegrino MA, Reconditi M, Reggiani C & Lombardi V (2004). The mechanism of the force response to stretch in human skinned muscle fibres with different myosin isoforms. J Physiol 554, 335–352. [DOI] [PMC free article] [PubMed] [Google Scholar]
- Linari M, Caremani M, Piperio C, Brandt P & Lombardi V (2007). Stiffness and fraction of myosin motors responsible for active force in permeabilized muscle fibers from rabbit psoas. Biophys J 92, 2476–2490. [DOI] [PMC free article] [PubMed] [Google Scholar]
- Millar NC & Homsher E (1990). The effect of phosphate and calcium on force generation in glycerinated rabbit skeletal muscle fibers. J Biol Chem 265, 20234–20240. [PubMed] [Google Scholar]
- Mizuno T, Takanashi Y, Yoshizaki K & Kondo M (1994). Fatigue and recovery of phosphorus metabolites and pH during stimulation of rat skeletal muscle: an evoked electromyography and in vivo 31P‐nuclear magnetic resonance spectroscopy study. Eur J Appl Physiol Occup Physiol 69, 102–109. [DOI] [PubMed] [Google Scholar]
- Nocella M, Cecchi G, Bagni MA & Colombini B (2013). Effect of temperature on crossbridge force changes during fatigue and recovery in intact mouse muscle fibers. PLoS One 8, e78918. [DOI] [PMC free article] [PubMed] [Google Scholar]
- Nocella M, Cecchi G, Bagni MA & Colombini B (2014). Force enhancement after stretch in mammalian muscle fiber: no evidence of cross‐bridge involvement. Am J Physiol Cell Physiol 307, C1123–C1129. [DOI] [PubMed] [Google Scholar]
- Nocella M, Colombini B, Benelli G, Cecchi G, Bagni MA & Bruton J (2011). Force decline during fatigue is due to both a decrease in the force per individual cross‐bridge and the number of cross‐bridges. J Physiol 589, 3371–3381. [DOI] [PMC free article] [PubMed] [Google Scholar]
- Potma EJ, van Grass IA & Stienen GJ (1995). Influence of inorganic phosphate and pH on ATP utilization in fast and slow skeletal muscle fibers. Biophys J 69, 2580–2589. [DOI] [PMC free article] [PubMed] [Google Scholar]
- Ranatunga KW (2010). Force and power generating mechanism(s) in active muscle as revealed from temperature perturbation studies. J Physiol 588, 3657–3670. [DOI] [PMC free article] [PubMed] [Google Scholar]
- Ranatunga KW, Coupland ME & Mutungi G (2002). An asymmetry in the phosphate dependence of tension transients induced by length perturbation in mammalian (rabbit psoas) muscle fibres. J Physiol 542, 899–910. [DOI] [PMC free article] [PubMed] [Google Scholar]
- Rassier DE, Leite FS, Nocella M, Cornachione AS, Colombini B & Bagni MA (2015). Non‐crossbridge forces in activated striated muscles: A titin dependent mechanism of regulation? J Muscle Res Cell Motil 36, 37–45. [DOI] [PubMed] [Google Scholar]
- Regnier M, Morris C & Homsher E (1995). Regulation of the cross‐bridge transition from a weakly to strongly bound state in skinned rabbit muscle fibers. Am J Physiol Cell Physiol 269, C1532–C1539. [DOI] [PubMed] [Google Scholar]
- Smith DA (2014). A new mechanokinetic model for muscle contraction, where force and movement are triggered by phosphate release. J Muscle Res Cell Motil 35, 295–306. [DOI] [PubMed] [Google Scholar]
- Takagi Y, Shuman H & Goldman YE (2004). Coupling between phosphate release and force generation in muscle actomyosin. Philos Trans R Soc Lond B Biol Sci 359, 1913–1920. [DOI] [PMC free article] [PubMed] [Google Scholar]
- Tesi C, Colomo F, Nencini S, Piroddi N & Poggesi C (2000). The effect of inorganic phosphate on force generation in single myofibrils from rabbit skeletal muscle. Biophys J 78, 3081–3092. [DOI] [PMC free article] [PubMed] [Google Scholar]
- Tesi C, Colomo F, Nencini S, Piroddi N & Poggesi C (2002). Characterization of the cross‐bridge force‐generating step using inorganic phosphate and BDM in myofibrils from rabbit skeletal muscles. J Physiol 541, 187–199. [DOI] [PMC free article] [PubMed] [Google Scholar]
- Walker JW, Lu Z & Moss RL (1992). Effect of Ca2+ on the kinetics of phosphate release in skeletal muscle. J Biol Chem 267, 2459–2466. [PubMed] [Google Scholar]
- Wang G & Kawai M (2001). Effect of temperature on elementary steps of the cross‐bridge cycle in rabbit soleus slow twitch muscle fibres. J Physiol 531, 219–234. [DOI] [PMC free article] [PubMed] [Google Scholar]
- Westerblad H & Allen DG (1991). Changes of myoplasmic calcium concentration during fatigue in single mouse muscle fibers. J Gen Physiol 98, 615–635. [DOI] [PMC free article] [PubMed] [Google Scholar]
- Westerblad H & Allen DG (1992). Changes of intracellular pH due to repetitive stimulation of single fibres from mouse skeletal muscle. J Physiol 449, 49–71. [DOI] [PMC free article] [PubMed] [Google Scholar]
- Wilson JR, McCully KK, Mancini DM, Boden B & Chance B (1988). Relationship of muscular fatigue to pH and diprotonated Pi in humans: a 31P‐NMR study. J Appl Physiol (1985). 64, 2333–2339. [DOI] [PubMed] [Google Scholar]
- Yoshida T (2002). The rate of phosphocreatine hydrolysis and resynthesis in exercising muscle in humans using 31P‐MRS. J Physiol Anthropol Appl Human Sci 21, 247–255. [DOI] [PubMed] [Google Scholar]