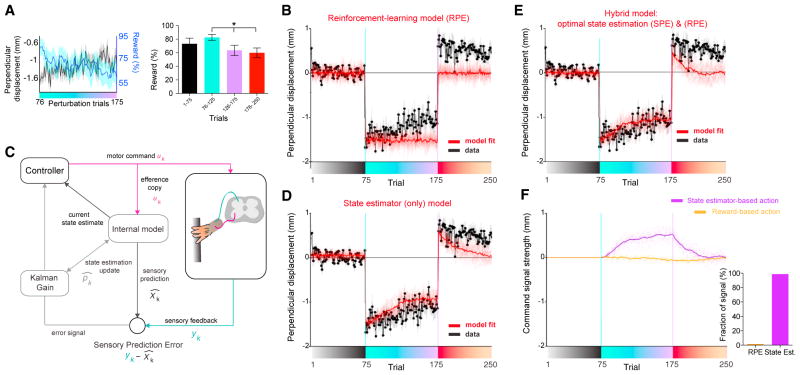
Figure 2. Model-Based Analysis Shows that the Adaptation Can Be Explained by Learning from Sensory Prediction Errors.
(A) Left: average perpendicular displacement (black) and average reward rate (cyan) across the perturbation block (n = 27 sessions, from n = 7 mice). Right: reward rate during indicated trials, mean ± SEM. *p = 0.01 Wilcoxon signed rank test (first ten versus last ten perturbation block).
(B) Best model fit using an actor-critic reinforcement-learning model, demonstrating a poor fit. Data from perpendicular displacement (at position 2) is shown in black (as in Figure 1C). Average best model fit is shown in red. As this model has several sources of noise (see STAR Methods), ten realizations of the model with best parameters are shown in soft lines and the solid line shows the average. Only the perturbation trials are used for fitting.
(C) Schematic of the state estimator model: the efference copy of a motor command is used to generate predicted sensory feedback (internal model), which is contrasted with the actual feedback (SPE), then weighted by a Kalman gain, to then update the state estimate to drive future actions (see STAR Methods).
(D) As in (B) but for the optimal state estimator model.
(E) As in (B) but for hybrid model of an actor-critic reinforcement-learning model and a state estimator model.
(F) The hybrid model’s motor command consists of three components derived from the optimal state estimator (Kalman filter and SPE), the optimal policy estimated by reinforcement-learning (RPE), and exploratory search noise. Left: the magnitude of the first two components corresponding to command signal (orange, RPE-based; purple, SPE-based). Right: quantification of the relative power ratio of contribution of those control signals from the best model fit.

