Abstract
Background
Modeling the complex development and growth of tumor angiogenesis using mathematics and biological data is a burgeoning area of cancer research. Architectural complexity is the main feature of every anatomical system, including organs, tissues, cells and sub-cellular entities. The vascular system is a complex network whose geometrical characteristics cannot be properly defined using the principles of Euclidean geometry, which is only capable of interpreting regular and smooth objects that are almost impossible to find in Nature. However, fractal geometry is a more powerful means of quantifying the spatial complexity of real objects.
Methods
This paper introduces the surface fractal dimension (Ds) as a numerical index of the two-dimensional (2-D) geometrical complexity of tumor vascular networks, and their behavior during computer-simulated changes in vessel density and distribution.
Results
We show that Ds significantly depends on the number of vessels and their pattern of distribution. This demonstrates that the quantitative evaluation of the 2-D geometrical complexity of tumor vascular systems can be useful not only to measure its complex architecture, but also to model its development and growth.
Conclusions
Studying the fractal properties of neovascularity induces reflections upon the real significance of the complex form of branched anatomical structures, in an attempt to define more appropriate methods of describing them quantitatively. This knowledge can be used to predict the aggressiveness of malignant tumors and design compounds that can halt the process of angiogenesis and influence tumor growth.
Background
The term "angiogenesis" defines the fundamental process of the development and growth of new blood vessels from the pre-existing vasculature, and is essential for reproduction, development and wound repair [1]. Under these conditions, it is highly regulated: i.e. "turned on" for brief periods of time (days) and then completely inhibited.
The cyclic nature of the microvascular bed in the corpus luteum provides a unique experimental model for examining the discrete physiological steps of angiogenesis in the life cycle of endothelial cells which, together with pericytes (supportive vascular smooth muscle cells), carry all of the genetic information necessary to form tubes, branches and entire capillary networks.
However, many human diseases (including solid tumors) are driven by persistently up-regulated angiogenesis [1]. In some non-malignant processes, such as pyogenic granuloma or keloid formation [2], angiogenesis is prolonged but still self-limited; however, this is not true of tumor angiogenesis which, once begun, continues indefinitely until the entire tumor is eradicated or the host dies. Without blood vessels, tumors cannot grow beyond a critical size (1–2 mm) or metastasize to another organ.
Angiogenesis is one of the most complex dynamic processes in biology, and is highly regulated by a balance of pro- and anti-angiogenic molecules. It is now widely accepted that the "angiogenic switch" is "off" when the effects of pro-angiogenic molecules is balanced by that of anti-angiogenic molecules, and "on" when the net balance is tipped in favor of angiogenesis [1,3]. Pro- and anti-angiogenic molecules can be secreted from cancer cells, endothelial cells, stromal cells, blood, and the extra-cellular matrix [4,5], the relative contributions of which are likely to change with tumor type and site, as well as with tumor growth, regression and relapse [1].
Although considerable advances have been made in our molecular and cellular knowledge of the promotion, mediation and inhibition of angiogenesis, very little is known about its underlying complex dynamics. Vasculature and more generally tubular organs develop in a wide variety of ways involving many cell processes [6-8].
In mathematical terms, angiogenesis is a non-linear dynamic system that is discontinuous in space and time, but advances through qualitatively different states. The word state defines the configuration pattern of the system at any given moment, and a dynamic system can be represented as a set of different states and a number of transitions from one state to another over a certain time interval [9,10].
At least seven critical steps have so far been identified in the sequence of angiogenic events on the basis of sprout formation: a) endothelial cells are activated by an angiogenic stimulus; b) the endothelial cells secrete proteases to degrade the basement membrane and extra-cellular matrix; c) a capillary sprout is formed as a result of directed endothelial cell migration, d) grows by means of cell mitoses and migration, and e) forms a lumen and a new basement membrane; f) two sprouts come together to form a capillary loop; and g) second-generation capillary sprouts begin to form [1,11,12] (Fig. 1).
Figure 1.
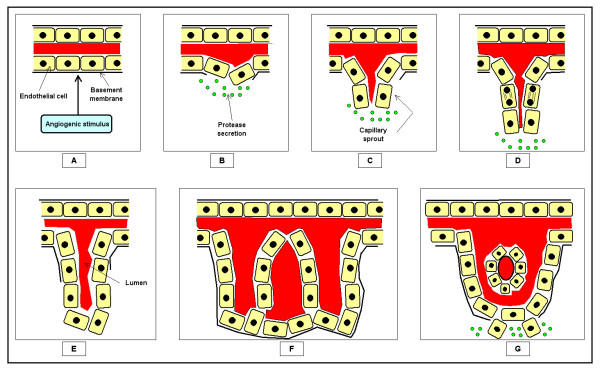
Angiogenesis is a complex dynamic process that evolves through different states and a number of transitions between two successive states. At least seven critical steps have so far been identified in the sequence of angiogenic events on the basis of sprout formation.
The progression of these states generates a complex ramified structure that irregularly fills the surrounding environment (Fig. 2). The main feature of the newly generated vasculature is the structural diversity of the vessel sizes, shapes and connecting patterns.
Figure 2.

The space-filling property of the vascular system is quantified by the fractal dimension (D), which falls between two topological integer dimensions. A. A Euclidean three-dimensional space (i.e. a cube) can contain a branching structure (i.e. the vascular system) without this entirely filling its internal space. B. Two-dimensional sectioning of the vascular network makes it possible to identify a variable number of vessels depending on the geometrical complexity of the system at any particular level of sectioning. C. The geometrical complexity of a 2-D section (s1, s2, s3) of the vascular network depends in the number of sectioned vessels and their distribution pattern.
Tumor vessels are structurally and functionally abnormal [1,3]: unlike normal vessels, they are highly disorganized, tortuous and dilated, and have uneven diameters, and excessive branching and shunts. This may be mainly due to the heterogeneous distribution of angiogenic regulators, such as vascular-endothelial growth factor (VEGF), basic fibroblastic growth factor (bFGF) and angiopoietin [5,13], leading to chaotic tumor blood flow, and hypoxic and acidic tumoral regions [5,14-16]. Moreover, although it is commonly believed that the endothelial cells making-up tumor vessels are genetically stable, diploid cells (and thus different from genetically unstable neoplastic cells), tumor vasculature seems to be much more unpredictable [17].
These conditions all reduce the effectiveness of treatments, modulate the production of pro- and anti-angiogenic molecules, and select a subset of more aggressive cancer cells with higher metastatic potential [1].
A large number of clinical trials of anti-angiogenic therapies are being conducted throughout the world, but investigators are still concerned about how to achieve the maximum benefit from them and how to monitor patient response. There are currently no markers of the net angiogenic activity of a tumor that can help investigators to design specific anti-angiogenic treatment strategies [5,18], but it is reasonable to resume that the quantification of various aspects of tumor vasculature may provide an indication of angiogenic activity.
One often-quantified element of tumor vasculature is microvessel density (MVD), which is used to allow a histological assessment of tumor angiogenesis. The results of studies carried out over the last decade have suggested the value of using tumor MVD as a prognostic index in a wide variety of solid cancers, and it has also recently been assumed that MVD may reveal the degree of angiogenic activity in a tumor. On the basis of these assumptions, the quantification of MVD is thought to be a surrogate marker of the efficacy of anti-angiogenic agents as well as a means of assessing which patients are good candidates for anti-angiogenic therapy. However, MVD has a number of substantial limitations, mainly due to the complex biology characterizing tumor vasculature [17], and the highly irregular geometry that the vascular system assumes in real space, which cannot be measured using the principles of Euclidean geometry because it is only capable of interpreting regular and smooth objects that are almost impossible to find in Nature.
However, quantitative descriptors of its geometrical complexity can be usefully abstracted from the fractal geometry introduced by Benoit Mandelbrot in 1975 [20,21]. We here discuss the surface fractal dimension (DS) as a quantitative index of the 2-D geometrical complexity of vascular networks and their behavior during computer-simulated changes in vessel density and distribution.
Geometrical properties of a vascular network
The human vascular system can be geometrically depicted as a complex fractal network of vessels that irregularly branch with a systematic reduction in their length and diameter [19].
Fractal objects are mainly characterized by four properties: a) the irregularity of their shape; b) the self-similarity of their structure; c) their non-integer or fractal dimension; and d) scaling, which means that the measured properties depends on the scale at which they are measured [22].
One particular feature of fractal objects is that the schemas defining them are continuously repeated at decreasing orders of magnitude, and so the form of their component parts is similar to that of the whole [20,21]: this property is called self-similarity. Unlike geometrical self-similarity, which only concerns mathematical fractal objects in which every smaller piece is an exact duplicate of the whole (e.g. Koch's snowflake curve, Sierpinski's triangle and Menger's sponge), statistical self-similarity concerns all complex anatomical systems, including tumor vasculature. The smaller pieces constituting anatomical entities are rarely identical copies of the whole, but more frequently "similar" to it and, in such systems, the statistical properties of the pieces are proportional to the statistical properties of the whole [23].
Dimension is a numerical attribute of an object that does not depend on its process of generation, and has been defined in two ways. The first is the topological or Euclidean dimension (Fig. 3), which assigns an integer to every point or set of points in Euclidean space (E): 0 to a point (defined as that which has no part); 1 to a straight line (defined as a length without thickness), 2 to a plane surface (defined as having length and thickness, but no depth); and 3 to three-dimensional figures (a volume defined by length, thickness and depth). The second was introduced by the mathematicians Felix Hausdorff and Abram S. Besicovitch, who attributed a real number to every natural object in E lying between the topological dimensions 0 and 3 (Fig. 3).
Figure 3.
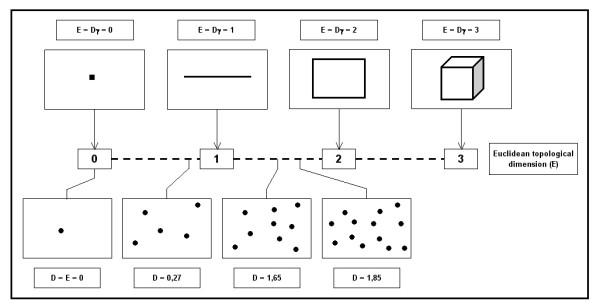
Fractal dimensioning of the 2-D complexity of a vascular network. The figure shows four idealized cross-sectioned vascular patterns that not only have a different number of vessels, but also clearly different distributions: the geometrical complexity arising from these two variables determines the value of the surface fractal dimension.
Benoit Mandelbrot uses the symbol Dγ to indicates the topological dimension, and the symbol D to indicate that of Hausdorff-Besicovitch (also called the fractal dimension). The Dγ and D of all Euclidean figures are coincident (Dγ = D), but this is not true of fractal objects in which D is always >Dγ.
As no anatomical entity corresponds to a regular Euclidean figure, their dimension is always expressed by a non-integer number falling between two integer topological dimensions. In our case (Fig. 2), the vascular network has a dimension lying between 2 (plane surface) and 3 (volume), and any two-dimensional section of a vascular system (as in the case of a histological section) has a dimension lying between 0 (the dimension of a single isolated point) and 2 when the sectioned vessels entirely fill a plane surface (Figs. 3 and 4).
Figure 4.
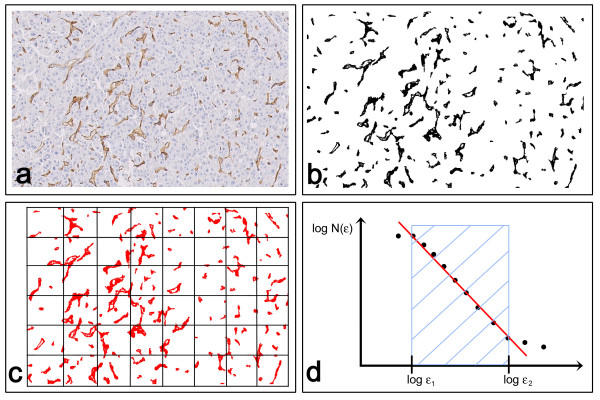
Computer-aided estimate of the surface fractal dimension (Ds) of a vascular network in 2-D biopsy sections. A. Hepatocellular carcinoma section stained with antibodies raised against CD31 (Dako, Milan, Italy) that specifically react with vessels. B. Image segmentation: immunopositive vessels are specifically selected on the basis of the similarity of the color of adjacent pixels. C. Determination of Ds using the box-counting algorithm. Briefly, the method counts the number of boxes of length ε required to cover the object being measured, indicated as N(ε). D. Prototypical curve obtainable using the box-counting method that highlights the so-called fractal windows ranged by box size ε1 and ε2, and represents the appropriate region in which to estimate the dimension. Box sizes of more than ε2 approach the size of the image until one box covers it completely, at which point N(ε) = 1 and the slope = 0. Box sizes smaller than ε1 approach a single pixel or the resolution of the image: in this region, box counting simply gives the area of the image.
Anatomical structures are also hierarchical systems that operate at different spatial and temporal scales, and different patterns can change, appear or disappear depending on the scale of magnification [22]. A fundamental characteristic is that the process operating at a given scale cannot be important at higher or lower scales [23].
The irregularity and self-similarity underlying scale changes are the main attributes of the architectural complexity of both normal and pathological biological entities [22-26]. In other words, the shape of a self-similar object does not change when the scale of measure changes because every part of it is similar to the original object; however, the magnitude and other geometrical parameters (e.g. the outline perimeter) of an irregular object differ when inspected at increasing resolutions that reveal an increasing number of details [25]. Over the last decade, accumulating experimental evidence has shown that the fractal patterns or self-similar structures of biological tissues can only be observed within the scaling window of an experimentally established measure of length ε1-ε2 (Fig. 4), within which experimental data sets follow a straight line with a slope (1-D): i.e. the fractal dimension remains invariant at different magnifications [20-27].
Methods
Computer-aided modeling of two-dimensional vascular tree complexity
We have developed a computer model to simulate the geometrical complexity of a histological two-dimensional section of a tumor vascular tree that automatically generates an unlimited number of images with a changeable density of vessels irregularly distributed on a planar surface.
In order to simplify the model, we considered all of the vessels as rounded, unconnected objects of equal magnitude (Fig. 5). As the parameters of a model must be as few as possible and it is necessary to reduce mathematical complexity [28-30], we included only two variables: a) the number of vessels; and b) their distribution in the surrounding environment. The vessel distribution patterns were randomly generated using different time-dependent seeds for random number function generation.
Figure 5.
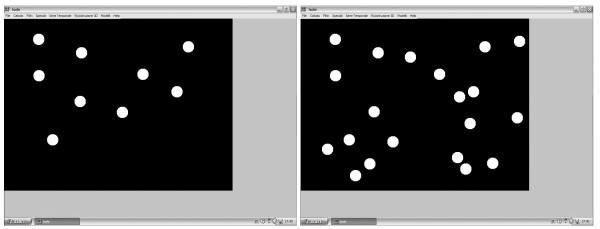
Computer-aided procedure used to quantify the surface fractal dimension of a simulated two-dimensional image of the vascular system. Prototypical 2-D simulated microscopy images of the vascular system with different vessel numbers and distribution were automatically generated, and their Ds was determined.
One thousand images were automatically generated for each vessel density (from five to 50 vessels, with the number being increased by five in each group), and their DS were estimated using the box-counting method [22].
DS was automatically estimated using the equation:
![]()
where ε is the side-length of the box, and N(ε) the smallest number of boxes of side ε required to completely contain the irregular object (Fig. 4).
As the zero limit cannot be applied to biological images, DS was estimated by means of the equation:
(2) DS = d
where d is the slope of the graph of log [N(ε)] against log (1/ε), in a fixed range of side-lengths (ε 1-ε 2) empirically evaluated by visualization [20-29].
Statistical analysis
All of the data are expressed as mean values ± standard deviation, and the results were analysed using the Statistica software package (StatSoft Inc. Tulsa, USA). Unvaried analysis was performed by means of the Student t as required for parametric variables. p values of less than 0.05 were considered statistically significant.
Results
The computer-aided simulations showed that different DS values can be obtained for images with the same vessel density (Fig. 6). As the only variable in these images is the vessel distribution pattern, DS depends on the irregular arrangement of the vessels in the surrounding environment. DS also significantly increased (p <0.05) when higher vessel densities were considered in the system (Fig. 6) because of the greater space filled by the vascular component (as shown in Fig. 3); the increased density of the vessels reduces the variability in their space-filling properties, and thus the standard deviation (Fig. 6).
Figure 6.
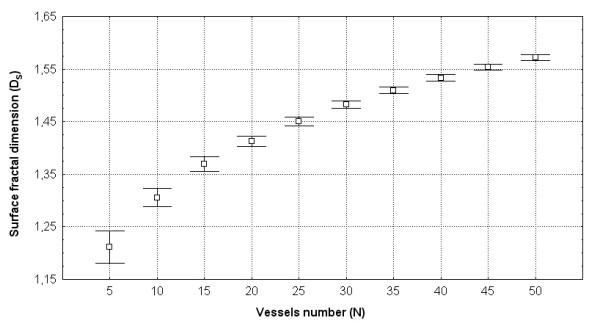
The behavior of Ds during a simulated increase in vessel density. The graph shows that different Dsvalues can be obtained for images with the same vessel density. As the only variable in these images is their distribution pattern, Ds depends on the irregular arrangement of the vessels in the surrounding environment (note the standard deviation of each cell density group). Ds also increases significantly when a higher vessel density is introduced into the system because of the greater space filled by the vascular component. The increase in vessel density reduces the variability of their space-filling properties, thus reducing the standard deviation.
Discussion and conclusions
One of the most important and distinctive characteristics of biological systems is the complexity of their shape (geometrical or spatial complexity) and functions (behavioral complexity). Complexity is a real quality of organized biological matter that is mainly manifested in the living world as diversity and organization. No two anatomical systems are exactly alike because of the enormous variability not only between the different members of a population, but also between the component parts of an organism. The word complexity has long been used descriptively in order to describe, for example, a large number of genes or cellular interconnections [33], but complexity can also reside in the structure of a system (i.e. an intricate architecture or the existence of many different component parts with varying interactions) or its non-linear functions (i.e. physiological rhythms are rarely strictly periodic but fluctuate irregularly over time) [34].
The vascular system is a complex network consisting of branched tubes of different sizes that are irregularly settled in the surrounding environment [6,7]. This geometrical characteristic highlights the complexity of its generating process in space and time, and greatly biases any quantitative method that tends to idealize it as a smooth and regular Euclidean object.
However, both normal and tumor vasculature can more properly be considered fractal objects because of their irregular shape (spatial conformation), self-similar structure, non-integer dimension and dependence on the scale of observation (scaling effect) [19,35-37].
We here discuss the estimate of DS as a quantitative index of the 2-D spatial complexity of the vascular tree, in order to provide a closer-to-reality measure of this complex anatomical entity (Figs. 3 and 4).
The theory underlying DS was abstracted from fractal geometry, which is also called the geometry of irregularity [20,21]. The concept of spatial conformation has played a fundamental role in the study of biological macromolecules in chemistry (particularly biochemistry) since the early 1950s. However, it has only been introduced in the science of morphology as theoretical morphology, which studies extant organismal forms (complex structures of interdependent and subordinate elements whose relationships and properties are largely determined by their function in the whole) as a subset of the range of theoretically possible morphologies [32].
The significance of DS also comes from the fact that, like any other complex biological system, the vascular tree cannot be correctly quantified by measuring its individual properties (i.e. micro-vessel density, MVD). DS is a parameter that depends on: a) the number of vessels; b) the spatial relationships between the vascular components; and c) the interactions between the vascular components and the surrounding environment. In other words, its estimate is "ecologically" important because it provides a quantitative index of the "habitat structure".
As computer models are crucial for scientific procedures, and the modeling process itself represents the hypothetical-deductive approach in science [30-32], we developed a simple computer-aided model capable of generating an unlimited number of 2-D images of a simulated vascular network. The model was simplified by using a minimum amount of mathematical complexity and only two variables: the number of vessels and their pattern of distribution. A total of 10,000 images showing a different number of unconnected vessels irregularly distributed on a planar surface were automatically generated (Fig. 5) and, interestingly, it was found that DS increased with the number of vessels making up the system (Fig. 6); furthermore, its value changed when the same number of vessels were differently distributed in the surrounding environment.
In other words, it is plausible that an equal number of vessels may have different space-filling properties depending on their distribution pattern. These results suggest the usefulness of this model when comparing real vasculature configurations in order to explore the morphological variability that can be produced in nature, as it is now well known that aberrant vascular architectures in tumors may affect the uniform delivery of specific drugs to all cancer cells [15].
The model also suggests that:
a) Ds can be an estimate of the 2-D geometrical complexity of the vascular system. As 2-D vascular complexity depends on the number of vessels and their distribution pattern, the use of MVD quantification alone to measure the angiogenic dependence of a tumor is strongly biased because the number of vessels does not reflect the number of tumor cells that can be supported by a vessel. Moreover the metabolic needs of cancer cells vary with the tissue of origin and change with tumor progression [18].
b) DS depends on the degree of vessel contiguity and continuity. These two geometrical properties determine what is called the intercapillary distance, and are not only involved in the spatial complexity of tumor vasculature, but also reflect the inviolable demand of a growing tumor for sufficient levels of nutrition and oxygen exchange. Inter-capillary distances are locally defined by the net balance between pro- and anti-angiogenic molecules in each microtissue region, as well as by non-angiogenic factors such as the oxygen and nutrient consumption rates of tumor cells. In normal tissue, vessel density fairly accurately reflects cell metabolic demands because evolutionary pressures have led to close and efficient coupling between vascular supply and metabolic needs. In tumors, the close coupling between vascular density and oxygen or nutrient consumption (i.e. the environment) may be loosened [18], thus altering not only the number of vessels but also the whole vascular architecture [15,38].
c) DS falls between 0 (corresponding to the Euclidean dimension of a point) and 2 (the dimension of a plane). The more DS tends towards 2, the more the analyzed vascular configuration tends to fill a 2-D space and the greater its geometrical complexity.
In conclusion, the present study indicates that the complex geometry of tumor vasculature and its well-known biological characteristics [18] mean that vascular network cannot be measured on the basis of MVD estimates alone. These findings also support the findings of various authors who have shown the uselessness of MVD as a predictor of anti-angiogenic treatment efficacy or for stratifying patients in therapeutic trials [14,39-41].
Scientific knowledge develops through the evolution of new concepts, and this process is usually driven by new methodologies that provide previously unavailable observation. The potential broad applicability of the proposed quantitative index makes it possible to explore the range of the morphological variability of vasculature that can be produced in nature, thus increasing its diagnostic importance in cancer research.
Abbreviations
Ds, Surface fractal dimension; 2-D, two-dimensional; VEGF, Vascular-endothelial growth factor; bFGF, basic fibroblastic growth factor; MVD, microvessel density.
Competing interests
The author(s) declare that they have no competing interests.
Authors' contributions
FG conceived, coordinated and designed the study and drafted the manuscript; CR, PC, BF, EEF, EC, MCI participated in designing the study and drafting the manuscript. All of the authors have read and approved the final manuscript.
Pre-publication history
The pre-publication history for this paper can be accessed here:
Contributor Information
Fabio Grizzi, Email: fabio.grizzi@humanitas.it.
Carlo Russo, Email: carlo.russo@humanitas.it.
Piergiuseppe Colombo, Email: piergiuseppe.colombo@humanitas.it.
Barbara Franceschini, Email: barbara.franceschini@humanitas.it.
Eldo E Frezza, Email: Eldo.Frezza@ttuhsc.edu.
Everardo Cobos, Email: Everardo.Cobos@ttuhsc.edu.
Maurizio Chiriva-Internati, Email: maurizio.chirivainternati@ttuhsc.edu.
References
- Carmeliet P. Angiogenesis in health and disease. Nature Medicine. 2003;9:653–670. doi: 10.1038/nm0603-653. [DOI] [PubMed] [Google Scholar]
- Woolf N. Pathology. Basic and Systemic. WB Saunders Company, London; 1998. [Google Scholar]
- Fidler IJ, Ellis LM. Neoplastic angiogenesis – not all blood vessels are created equal. New England Journal of Medicine. 2004;351:215–216. doi: 10.1056/NEJMp048080. [DOI] [PubMed] [Google Scholar]
- Fukumura D, Xavier R, Sugiura T, Chen Y, Park EC, Lu N, Selig M, Nielsen G, Taksir T, Jain RK, Seed B. Tumor induction of VEGF promoter activity in stromal cells. Cell. 1998;94:715–725. doi: 10.1016/S0092-8674(00)81731-6. [DOI] [PubMed] [Google Scholar]
- Tandle A, Blazer DG, Libutti SK. Antiangiogenic gene therapy of cancer: recent developments. Journal of Translational Medicine. 2004;2:22. doi: 10.1186/1479-5876-2-22. [DOI] [PMC free article] [PubMed] [Google Scholar]
- Hogan BL, Kolodziej PA. Organogenesis: molecular mechanisms of tubulogenesis. Nat Rev Genet. 2002;3:513–23. doi: 10.1038/nrg840. [DOI] [PubMed] [Google Scholar]
- Lubarsky B, Krasnow MA. Tube morphogenesis: making and shaping biological tubes. Cell. 2003;112:19–28. doi: 10.1016/S0092-8674(02)01283-7. [DOI] [PubMed] [Google Scholar]
- Parker LH, Schmidt M, Jin SW, Gray AM, Beis D, Pham T, Frantz G, Palmieri S, Hillan K, Stainier DY, De Sauvage FJ, Ye W. The endothelial-cell-derived secreted factor Egfl7 regulates vascular tube formation. Nature. 2004;428:754–758. doi: 10.1038/nature02416. [DOI] [PubMed] [Google Scholar]
- Abraham R. Complex dynamics. Aerial Press, Santa Cruz; 1991. [Google Scholar]
- Abraham R, Shaw C. Dynamics, The geometry of behavior. Second. Addison-Wesley, Reading MA; 1992. [Google Scholar]
- Folkman J, Klagsbrun M. Angiogenic factors. Science. 1987;235:442–7. doi: 10.1126/science.2432664. [DOI] [PubMed] [Google Scholar]
- Colville-Nash PR, Willoughby DA. Growth factors in angiogenesis: current interest and therapeutic potential. Molecular Medicine Today. 1997;3:14–23. doi: 10.1016/S1357-4310(96)10048-4. [DOI] [PubMed] [Google Scholar]
- Jain RK, Schlenger K, Hockel M, Yuan F. Quantitative angiogenesis assays: progress and problems. Nature Medicine. 1997;3:1203–1208. doi: 10.1038/nm1197-1203. [DOI] [PubMed] [Google Scholar]
- Harris AL. Hypoxia – a key regulatory factor in tumor growth. Nat Rev Cancer. 2002;2:38–47. doi: 10.1038/nrc704. [DOI] [PubMed] [Google Scholar]
- Munn LL. Aberrant vascular architecture in tumors and its importance in drug-based therapies. Drug Discovery Today. 2003;8:396–403. doi: 10.1016/S1359-6446(03)02686-2. [DOI] [PubMed] [Google Scholar]
- Stergiopulos N, Porret CA, De Brouwer S, Meister JJ. Arterial vasomotion: effect of flow and evidence of nonlinear dynamics. Am J Physiol. 1998;274:H1858–64. doi: 10.1152/ajpheart.1998.274.6.H1858. [DOI] [PubMed] [Google Scholar]
- Streubel B, Chott A, Huber D, Exner M, Jager U, Wagner O, Schwarzinger I. Lymphoma-specific genetic aberrations in microvascular endothelial cells in B-cell lymphomas. New England Journal of Medicine. 2004;351:250–259. doi: 10.1056/NEJMoa033153. [DOI] [PubMed] [Google Scholar]
- Hlatky L, Hahnfeldt P, Folkman J. Clinical application of antiangiogenic therapy: microvessel density, what it does and doesn't tell us. Journal National Cancer Institute. 2002;94:883–893. doi: 10.1093/jnci/94.12.883. [DOI] [PubMed] [Google Scholar]
- Grizzi F, Colombo P, Barbieri B, Franceschini B, Roncalli M, Chiriva-Internati M, Muzzio PC, Dioguardi N. Correspondence re: E. Sabo et al., Microscopic analysis and significance of vascular architectural complexity in renal cell carcinoma. Clinical Cancer Research. 2001;7:3305–3307. [PubMed] [Google Scholar]
- Mandelbrot BB. Les objets fractals: forme, hasard et dimension. Flammarion, Paris; 1975. [Google Scholar]
- Mandelbrot BB. The Fractal Geometry of Nature. Freeman, San Francisco; 1982. [Google Scholar]
- Grizzi F, Franceschini B, Chiriva-Internati M, Hermonat PL, Shah G, Muzzio PC, Dioguardi N. Science, Technology and Education of Microscopy: an Overview. Formatex, Spain; 2003. The complexity and the Microscopy in the anatomical sciences. [Google Scholar]
- Bassingthwaighte JB, Liebovitch LS, West BJ. Fractal physiology. Oxford University Press, New York; 1994. [Google Scholar]
- Losa GA. Rivista di Biologia. Vol. 95. Biology Forum; 2002. Fractal morphometry of cell complexity; pp. 239–250. [PubMed] [Google Scholar]
- Nonnenmacher TF, Baumann G, Barth A, Losa GA. Digital image analysis of self-similar cell profiles. Int J Biomed Comput. 1994;37:131–138. doi: 10.1016/0020-7101(94)90135-x. [DOI] [PubMed] [Google Scholar]
- Losa GA, Nonnenmacher TF. Self-similarity and fractal irregularity in pathologic tissues. Mod Pathol. 1996;9:174–182. [PubMed] [Google Scholar]
- Dollinger JW, Metzler R, Nonnemacher TF. Bi-asymptotic fractals: Fractals between lower and upper bounds. J Phys A: Math Gen. 1998;31:3839–3847. doi: 10.1088/0305-4470/31/16/012. [DOI] [Google Scholar]
- Paumgartner D, Losa G, Weibel ER. Resolution effect on the stereological estimation of surface and volume and ist interpretation in terms of fractal dimension. Journal of Microscopy. 1981;121:51. doi: 10.1111/j.1365-2818.1981.tb01198.x. [DOI] [PubMed] [Google Scholar]
- Cross SS. Fractals in pathology. J Pathol. 1988;182:1–8. doi: 10.1002/(SICI)1096-9896(199705)182:1<1::AID-PATH808>3.3.CO;2-2. [DOI] [PubMed] [Google Scholar]
- Massoud TF, Hademenos GJ, Young WL, Gao E, Pile-Spellman J, Vinuela F. Principles and philosophy of modeling in biomedical research. FASEB Journal. 1998;12:275–285. doi: 10.1096/fasebj.12.3.275. [DOI] [PubMed] [Google Scholar]
- Weiss JN, Qu Z, Garfinkel A. Understanding biological complexity: lessons from the past. FASEB Journal. 2003;17:1–6. doi: 10.1096/fj.02-0408rev. [DOI] [PubMed] [Google Scholar]
- McGhee GR. Theoretical morphology: the concept and its applications. Columbia University Press, New York; 1998. [Google Scholar]
- Szathmary E, Jordan F, Csaba P. Can genes explain biological complexity? Science. 2001;292:1315–1316. doi: 10.1126/science.1060852. [DOI] [PubMed] [Google Scholar]
- Golbeter A. Biochemical oscillations and cellular rhythms. The molecular bases of periodic and chaotic behavior. Cambridge University Press; 1996. [Google Scholar]
- Baish JW, Jain RK. Cancer, angiogenesis and fractals. Nature Medicine. 1998;4:984. doi: 10.1038/1952. [DOI] [PubMed] [Google Scholar]
- Baish JW, Jain RK. Fractals and cancer. Cancer Research. 2000;60:3683–3688. [PubMed] [Google Scholar]
- Bassingthwaighte JB, King RB, Roger SA. Fractal nature of regional myocardial blood flow heterogeneity. Circulation Research. 1989;65:578–590. doi: 10.1161/01.res.65.3.578. [DOI] [PMC free article] [PubMed] [Google Scholar]
- Padera TP, Stoll BR, Tooredman JB, Capen D, di Tomaso E, Jain RK. Pathology: cancer cells compress intratumor vessels. Nature. 2004;427:695. doi: 10.1038/427695a. [DOI] [PubMed] [Google Scholar]
- Uzzan B, Nicolas P, Cucherat M, Perret GY. Microvessel density as a prognostic factor in women with breast cancer: a systematic review of the literature and meta-analysis. Cancer Research. 2004;64:2941–2955. doi: 10.1158/0008-5472.can-03-1957. [DOI] [PubMed] [Google Scholar]
- Hansen S, Sorensen FB, Vach W, Grabau DA, Bak M, Rose C. Microvessel density compared with the Chalkley count in a prognostic study of angiogenesis in breast cancer patients. Histopathology. 2004;44:428–436. doi: 10.1111/j.1365-2559.2004.01848.x. [DOI] [PubMed] [Google Scholar]
- Fox SB. Tumor angiogenesis and prognosis. Histopathology. 1997;30:294–301. doi: 10.1046/j.1365-2559.1997.d01-606.x. [DOI] [PubMed] [Google Scholar]


