Abstract
Background
There is a substantial discrepancy between in vitro and in vivo experiments. The purpose of the present work was development of a theoretical framework to enable improved prediction of in vivo response from in vitro bioassay results.
Results
For dose-response curve reaches a plateau in vitro we demonstrated that the in vivo response has only one maximum. For biphasic patterns of biological response in vitro both the bimodal and biphasic in vivo responses might be observed.
Conclusion
As the main result of this work we have demonstrated that in vivo responses might be predicted from dose-effect curves measured in vitro.
Background
In vitro bioassay is very useful in biomedical experiments. It has the potential to yield very important data about molecular mechanism of action of any biologically active compounds. However, the major challenge for such experiments is extrapolation to in vivo responses. Unfortunately, there is a substantial discrepancy between in vitro and in vivo experiments, and there is a paucity of work directed to prediction of in vivo response from in vitro bioassay. So, the purpose of the present work was development of a theoretical framework to enable improved prediction of in vivo response from in vitro bioassay results.
Results
A survey of literature revealed that most cases of dose-effect curves for in vitro experiments fall into three classes. They are:
• monophasic response;
• biphasic pattern;
• bimodal or polymodal dose-effect curve.
MONOPHASIC RESPONSE is the form most commonly reported in articles on in vitro bioassay. In these cases, with increasing dose of biologically active substance (BAS), the cellular response increases to a maximum (dose-response curve reaches a plateau). The most general schemes exhibiting this class of response can be classified as 3 classes:
(I) BAS regulation of enzyme activity,
(II) Ligand interaction with one type of receptor, and
(III) Ligand interaction with negatively cooperative receptors.
We will consider these three classes:
(I): BAS might regulate enzyme activity. It might be:
• substrate:
E+S ←→ ES → E+P → cell response, (scheme 1)
where E is enzyme, S is substrate, ES is enzyme-substrate complex, P is product. Cellular response is suggested to be proportional to product concentration.
Scheme (2) approximates the classic Michaelis scheme [1].
• enzyme activator (A)
E+S ←→ ES → E+P → cell response
E+A ←→ EA (scheme 2)
EA+S ←→ EAS → EA+P → cell response increasing,
Scheme (3) is characteristic of many BAS. The majority of these groups are vitamins and minerals, which are known to be enzyme cofactors and serve to increase enzyme activity.
• enzyme inhibitor (I)
E+S ←→ ES → E+P → cell response
E+I ←→ EI → no cell response, (scheme 3)
For example, there is the large class of drugs, whose action can be described with the help of scheme (4). This class is called "inhibitors of angiotensin-converting enzyme". These drugs are commonly used for hypertension treatment and prevention [2].
(II) Ligand interaction with one type of receptors:
L+R ←→ LR → cell response (scheme 4)
where L is ligand (BAS), R is receptor, LR is ligand-receptor complex.
Scheme (4) is "classic" receptor theory as described by Clark (1937) [3].
For example, kinetic schemes of such type were proved in the case of estrogen regulation of gene expression [4], apolipoprotein AI, CII, B and E synthesis [5].
(III) Ligand interaction with negative cooperative receptors
L+R ←→ LR
L+LR ←→ L2R → cell response (5)
where L2R is complex ligand-receptor complexes.
Scheme (5) is characteristic for insulin receptors [6].
Kinetic equations for schemes (1)–(5) are well known [7]. They include "classic" Michaelis [1] and Clark [3] equations. It can be shown, due to the first order Taylor series, equations for the schemes (1)–(4) can be re-formulated from particle counter theory as:
y = B*x/(1+A*x) (6)
and for scheme (5):
y = B*x2/(1+A*x2) (7)
where x is incoming signal (x is BAS concentration). For scheme (1) x is substrate concentration, for scheme (2) it is activator concentration, for scheme (3) it is inhibitor concentration, for schemes (4) and (5) it is ligand concentration. y is cellular response for the in vitro system. A and B are scaling coefficients.
The BAS concentration in the whole organism changes as a function of time according to equation (14) (see Methods.) i.e.
x(t) = C(t) = C0[exp(-kelγt)-exp(-k1t)] (8)
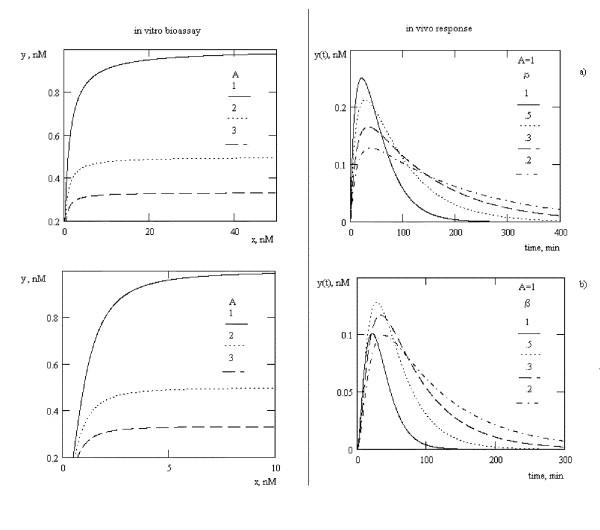
We used equation (8) as the incoming signal, substituted this into equations (6) and (7) and solved analytically using Math Cad 8 graphing software (MathSoft Inc., Cambridge, MA, USA) to predict in vivo responses for monomodal in vitro dose-effect curves for schemes (1)–(5). We used illustrative values from works [8,9] and demonstrated that for such in vitro dose-effect curves, the in vivo response has only one maximum (fig. 1).
Figure 1.
In vivo response for monophasic dose-effect curves measured in vitro. B = 1. a) equation (6), b) equation (7). kel = 0.0714 1/min, k1 = 0.0277 1/min, C0 = 1 nM, γ = β. Illustrative values for fig. 1, 2, 4 taken from Veldhuis et al., (1993) [8] and similar to those measured by Baumann et al., (1987)9 for the clearance of growth hormone (GH).
We define β (degree of conjugation) as the proportion of BAS that is free of binding proteins and is available to interact with cognate receptors. The larger is β, the larger the proportion of "free" BAS (see Methods). For equation (6) the value of this maximum is increasing as β increases; for equation (7) this value is maximum for mid-range β values.
BIPHASIC PATTERNS OF BIOLOGICAL RESPONSE
In this case, in in vitro experiments the low doses of BAS stimulate cellular response, and the high doses inhibit it. So, a maximum is observed on the dose-response curve. The most common kinetic schemes for such response are:
• Negative back loop (substrate and product inhibition):
a) E+S ←→ ES → E+P → cellular response
ES+S ←→ ES2 (9)
b) E+S ←→ ES → E+P → cellular response
ES + P ↔ ESP
Such schemes are characteristic of glucose metabolism [1].
• Presence of two receptor types: one type stimulates cellular response, another type inhibits it.
L+R ←→ LR → "positive" cellular response
L+R' ←→ LR' → "negative" cellular response (10)
where R are receptors of the first type, R' are receptors of the second type, LR, LR' are ligand-receptor complexes with different receptor types.
This mechanism has been proven for estrogen regulation of nitric oxide synthase (activity in the rat aorta [10]; protein pS2 expression in hormone-dependent tumors [11] and so on.
• Desensitization of cellular receptors
L+R ←→ LR → positive cellular response
LR → decrease in receptor number (11)
It has been suggested, that mechanism (11) is basic for drug tolerance [7]. For example, this mechanism was described for uretal cell stimulation by 17-β-estradiol. Before estradiol treatment, expression of estrogen receptors mRNA in cells was much higher then after 12-days estradiol administration [12]. It is well known that endogenous opioid receptors become down regulated after chronic exposure to exogenous opioids [13] and receptor down-regulation has often been observed to follow acute exposure to hormones including growth hormone [14].
• Change of effector's molecule conformation:
"Active" conformation + ligand suplus ←→ "Passive" conformation (12)
Scheme (12) was suggested by Bootman and Lipp (1999) [15] for Ca++ regulation of 1,4,5-trisphosphate activity. The authors suggested that Ca++ surplus induces a change in Ca++-channel conformation from "open" or "active" to "closed" or "passive" [15].
For schemes (9)–(12), due to the first order Taylor series, this kinetic equation can be derived:
y = A*x*exp(-B*x) (13)
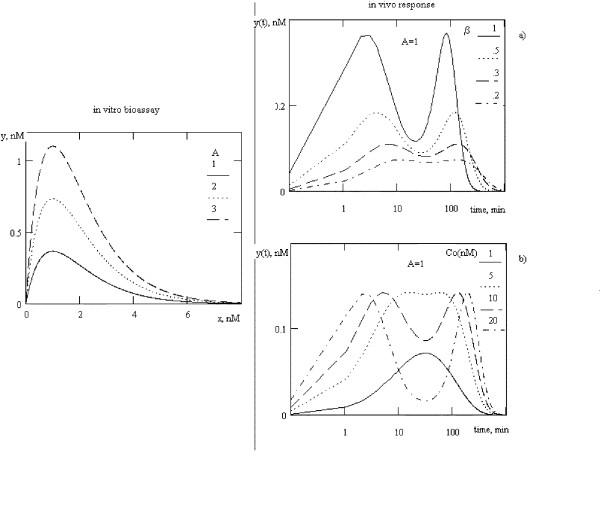
Using equation (13), we obtained a prediction of in vivo biphasic dose-effects curves (fig. 2). As is apparent from the figure, the magnitude and the analytical appearance of in vivo response is affected by the dose of BAS and its degree of conjugation (β). Both the bimodal and biphasic in vivo responses might be observed for biphasic dose-effect curves. Changes of dose of BAS concentration or its conjugation with blood proteins (or their concentration) might dramatically change the form of in vivo response. For the simulations shown in Figure 2 we used values for kel and k1 and blood volume (4.9 liters) based on measurements by Baumann et al. (1987) [9] and Veldhuis et al. (1993) [8] for growth hormone secretion, clearance and pulsatility. Polymodal biological responses are commonly observed in biological systems. It has been demonstrated, that in some experimental systems, administration of a single, bolus dose of hormone produces a polymodal response [16].
Figure 2.
In vivo response for biphasic dose-effect curves measured in vitro. B = 1. a) variation of β, C0 = 1 nM, b) variation of C0, β = .388. kel = 0.0714 1/min, k1 = 0.0277 1/min, γ = β.
Bimodal dose-effect curves are usually observed for BAS with regulatory activity [17,18]. The mechanism of their formation is still unclear. From our point of view, bimodal dose-response curve might be described by superposition of two biphasic dose-effect curves with different B value. This might be observed in cascade system of signal transduction and amplification. If x regulate intermediate z formation in biphasic way with B1, and z has biphasic response on y formation with B2, then if B1<B2, summary dose-effect curve (y concentration from x) is bimodal (fig. 3). Differences in B1 and B2 value define the maximum points. For example, with B2 increasing, the interpeak distance will also increase.
Figure 3.
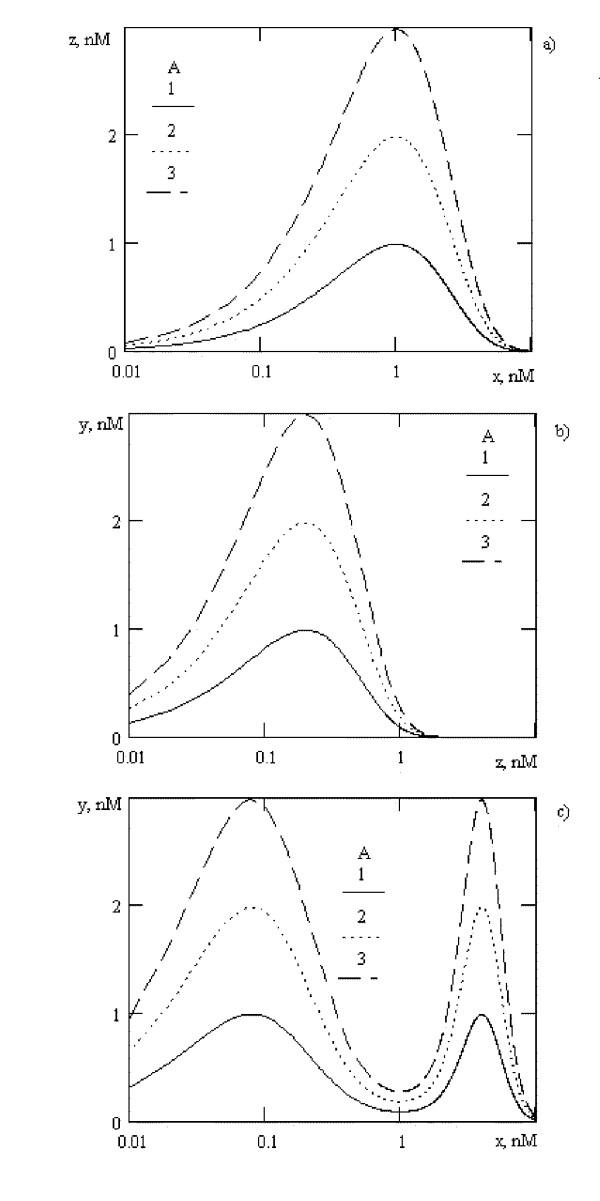
Possible mechanism of bimodal dose-effect curve formation for in vitro systems. a) intermediate z formation as function of x concentration, B1 = 1, b) final product y formation as function of z concentration, B2 = 5, c)summary dose-response curve. See comments in the text of the article.
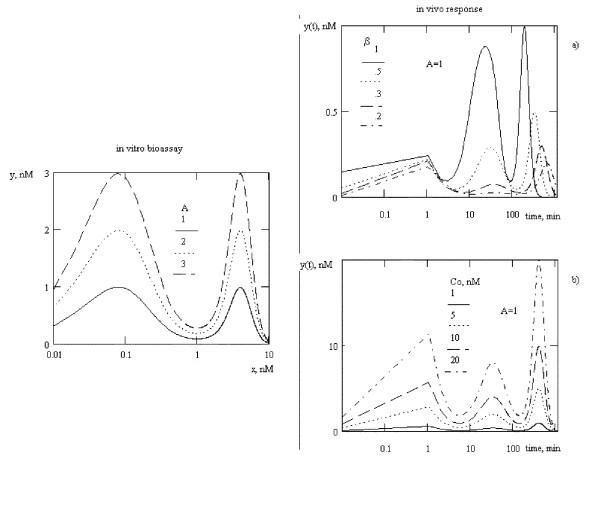
For systems, which have bimodal dose-effect curve in vitro, the polymodal response in vivo is observed (fig. 4). The form of this response might be change to "seems constant" due to BAS concentration of β value. The differences of maximum values are observed, this differences is time-dependent: the highest maximum is observed with the longest observation. It might be demonstrated, that with change of B2 value to 20, only bimodal in vivo response will be observed. So, the form and the value of maximums are dependent from the dose of BAS and degree of conjugation.
Figure 4.
In vivo response for bimodal dose-effect curves measured in vitro. B1 = 1, B2 = 5. a) variation of β, C0 = 1 nM, b) variation of C0, β = .388. kel = 0.0714 1/min, k1 = 0.0277 1/min, γ = β.
Discussion
Analogues of hormones are commonly used in medicine for hormone replacement therapy (for example in post-menopausal women), for oral contraception, as anabolic drugs, for asthma therapy and so on [2]. But engineered modifications of hormones, growth factors or their analogs are likely to differ from the native analogues in their affinity for binding proteins. In view of this, an important practical consequence of our simulations results are that the testing of newly designed hormones in in vivo systems (with endogenous binding proteins) will require measurements of acute biological response at multiple concentration and time points. For longer-term responses requiring protein synthesis (such as a secretion of body mass or longitudinal bone growth), it could be argued that such multiple time point studies would not be as important. However, in so far as long term biological responses are the consequence of critical initial events which may require threshold concentrations of free hormone, or repeated patterns of hormone exposure over prolonged periods [16,19], this assumption may not be justified.
Another application of our work may be the study of hormone functions in glandular tumour disorders. With these disorders, there is usually serious metabolic or hormonal dysfunction. From our point of view, it may be not only due to gland biosynthesis of abnormal hormone. Tumour-produced hormones may not differ structurally from their normal analogues. The dysfunctional occurs due to abnormal concentrations of hormones, which are synthesised by tumours. As it follows from our results, changes in concentrations can dramatically change the form and value of biological response. On the other hand, in many tumour disorders the concentrations of binding proteins are changed. For example, in ovarian carcinoma the changes of sex binding protein and ratio free/bound sex hormones (β) are observed [20]. As follows from our results, this can dramatically change the biological response to such hormones, i.e. apparent biological functions. So with testing in vitro such hormones seems to be normal (and they may be normal), but in vivo they may have abnormal effects due to changes of their binding protein concentration, or ratio free/bound hormone.
Conclusion
So, as a result of this work we have demonstrated that in vivo responses might be predicted from dose-effect curves measured in vitro. For monophasic curves, in vivo response is proportional to BAS concentration. For the most complex in vitro curves, the value and the form of in vivo response depends in a predictable way on the dose of BAS and its degree of conjugation.
Methods
To obtain the discussed results we used linear pharmacokinetics model:
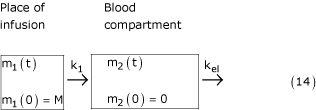
where: m1(t) mass of biologically active substance (BAS) in the place of infusion, m2(t) mass of BAS in compartment (blood), k1,kel constants of hormone diffusion from place of infusion to blood and excretion form blood (accordingly).
Many of biologically active substances are conjugate into complexes with blood proteins (for example: GH, nerves growth factor, IGF-1):
B+P ⇔K HP (15)
where B is BAS, P is blood protein, BP is BAS-protein complex, K is dissociation constant.
For many BAS, concentration of free (not bound with blood proteins) BAS is equal to:
[B] ≈β [B0] (16)
where β is constant ("degree of conjugation"), [B] is concentration of free BAS, [B0] is initial concentration of BAS. If β = 1 then BAS dose not conjugate with protein. If β = 0 then all BAS is in conjugate form.
It may be that only conjugate BAS (for example, bilirubin), or only unconjugated BAS can be excreted form the blood (for example, sex hormones). This means that for scheme (14) the law of mass action will be written in the next way:
dm1/dt = -k1m1, m1(0) = M
dm2/dt = k1m1 - γkelm2, m2(0) = 0 (17)
where γ is a constant. γ = 1-β if only conjugate form of BAS can be excreted and γ = β if only unconjugated form is excreted.
But γ is a constant with respect to t: γ = const(t). This means that solution of system (17) is:
C(t) = C0[exp(-kelγt)-exp(-k1t)] (18)
where C(t) is BAS concentration in the blood compartment (C = m2/V, V = const (about 5 liters) is blood volume), C0 is seems initial BAS concentration (C0 = M/V).
Contributor Information
Ross Barnard, Email: barnard@biosci.uq.edu.au.
Konstantin G Gurevich, Email: kgurevich@newmail.ru.
References
- Lehninger AL, Nelson DL, Cox MM. Principles of biochemistry. Worth Publish: NY; 1982. p. 1013. [Google Scholar]
- Gilman AG. The pharmacological basis of therapeutics. McGrawHill: New York, St Louis, San Francisco; 1996. p. 1141. [Google Scholar]
- Clark AJ. General Pharmacology. In: Heubner W, Schuller J, editor. Handbuch der Experimentellen Pharmakologie, supplement 4. Springer Verlag: Berlin; 1937. pp. 4–190. [Google Scholar]
- Ponchon M, Lause P, Maiter D. In vitro effects of oestradiol on galanin gene expression in rat anterior pituitary cells. J Neuroendocrinol. 2000;12:559–564. doi: 10.1046/j.1365-2826.2000.00489.x. [DOI] [PubMed] [Google Scholar]
- Tam SP, Archer TK, Deeley RG. Biphasic effects of estrogen on apolipoprotein synthesis in human hepatoma cells: mechanism of antagonism by testosterone. Proc Natl Acad Sci USA. 1986;83:3111–3115. doi: 10.1073/pnas.83.10.3111. [DOI] [PMC free article] [PubMed] [Google Scholar]
- Alberts B, Dennis B, Lewis J, Raff M, Roberts K, Watson JD. Molecular biology of the cell. Vol. 2. Garland publishing Inc: New York, London; 1989. p. 540. [Google Scholar]
- Varfolomeev SD, Gurevich KG. Biokinetics. Fair-press: Moscow; 1999. p. 720. [Google Scholar]
- Veldhuis JD, Johnson ML, Faunt LM, Mercado M, Baumann G. Influence of high affinity growth hormone binding protein on plasma profiles of free and bound GH and on the apparent half-life of GH. J Clin Invest. 1993;91:629–641. doi: 10.1172/JCI116243. [DOI] [PMC free article] [PubMed] [Google Scholar]
- Baumann G, Amburn K, Buchanan TA. The effect of circulating growth hormone-binding protein on metabolic clearance, distribution and degradation of human growth hormone. J Clin Endocrinol Metab. 1987;64:657–660. doi: 10.1210/jcem-64-4-657. [DOI] [PubMed] [Google Scholar]
- Binko J, Murphy TV, Majewski H. 17-Beta-estradiol enhances nitric oxide synthase activity in endothelium-denuded rat aorta. Clin Exp Pharmacol Physiol. 1998;25:120–127. doi: 10.1111/j.1440-1681.1998.tb02188.x. [DOI] [PubMed] [Google Scholar]
- Marsigliante S, Biscozzo L, Leo G, Storelli C. Biphasic Scatchard plots of oestrogen receptors are associated with low pS2 levels in human breast cancers. Cancer Lett. 1999;144:17–23. doi: 10.1016/S0304-3835(99)00178-0. [DOI] [PubMed] [Google Scholar]
- Meikle A, Forsberg M, Sahlin L, Masironi B, Tasende C, Rodriguez-Pinon M, Garofalo EG. A biphasic action of estradiol on estrogen and progesterone receptor expression in the lamb uterus. Reprod Nutr Dev. 2000;40:283–293. doi: 10.1051/rnd:2000132. [DOI] [PubMed] [Google Scholar]
- Borgland SL. Acute opioid receptor desensitization and tolerance: is there a link? Clin Exp Pharmacol Physiol. 2001;28:147–154. doi: 10.1046/j.1440-1681.2001.03418.x. [DOI] [PubMed] [Google Scholar]
- Maiter D, Underwood LE, Maes M, Ketelslegers JM. Acute down-regulation of the somatogenic receptos in rat liver by a single injection of growth hormone. Endocrinology. 1988;122:1291–1296. doi: 10.1210/endo-122-4-1291. [DOI] [PubMed] [Google Scholar]
- Bootman MD, Lipp P. Calcium signaling: ringing changes to the 'bell-shaped curve'. Curr Biol. 1999;9:R876–R878. doi: 10.1016/S0960-9822(00)80072-X. [DOI] [PubMed] [Google Scholar]
- Nielsen HK, Jorgensen JOL, Brixen K, Moller N, Charles P, Christensen JS. 24-h Profile of serum osteocalcin in growth hormone (GH) deficient patients with and without GH treatment. Growth Regulation. 1991;1:153–159. [PubMed] [Google Scholar]
- Burlakova EB, Konradov AA, Khudiakov IV. The actions of chemical agents at ultralow doses on biological objects. Izv Akad Nauk SSSR (Biol) 1990;22:184–193. [PubMed] [Google Scholar]
- Zaitzev SV, Efanov AM, Sazanov LA. The main regularities and possible action mechanisms of biologically active substances in supersmall doses. Russian Chemical J. 1999;XLIII:28–33. [Google Scholar]
- Isaksson OGP, Jansson J-O, Clark RG, Robinson I. Significance of the secretory pattern of growth hormone. News in Physiological Sciences. 1986;1:44–47. [Google Scholar]
- Hamilton-Fairley D, White D, Griffiths M, Anyaoku V, Koistinen R, Seppala M, Franks S. Diurnal variation of sex hormone binding globulin and insulin-like growth factor binding protein-1 in women with polycystic ovary syndrome. Clin Endocrinol (Oxf) 1995;43:159–165. doi: 10.1111/j.1365-2265.1995.tb01910.x. [DOI] [PubMed] [Google Scholar]


