

Abstract
Objectives:
To define pQCT precision errors, least-significant-changes, and identify associated factors for bone outcomes at the radius and tibia in children.
Methods:
We obtained duplicate radius and tibia pQCT scans from 35 children (8-14yrs). We report root-mean-squared coefficient of variation (CV%RMS) and 95% limits-of-agreement to characterize repeatability across scan quality and least-significant-changes for bone outcomes at distal (total and trabecular area, content and density; and compressive bone strength) and shaft sites (total area and content; cortical area content, density and thickness; and torsional bone strength). We used Spearman’s rho to identify associations between CV% and time between measurements, child’s age or anthropometrics.
Results:
After excluding unanalyzable scans (6-10% of scans per bone site), CV%RMS ranged from 4% (total density) to 19% (trabecular content) at the distal radius, 4% (cortical content) to 8% (cortical thickness) at the radius shaft, 2% (total density) to 14% (trabecular content) at the distal tibia and from 2% (cortical content) to 6% (bone strength) at the tibia shaft. Precision errors were within 95% limits-of-agreement across scan quality. Age was associated (rho -0.4 to -0.5, p <0.05) with CV% at the tibia.
Conclusion:
Bone density outcomes and cortical bone properties appeared most precise (CV%RMS <5%) in children.
Keywords: Precision Error, peripheral Quantitative Computed Tomography, Coefficient of Variation, Scan Quality, Pediatrics
Introduction
Peripheral quantitative computed tomography (pQCT) has been increasingly used in pediatric research over the past two decades. Three dimensional pQCT data is attractive when assessing growing long bones for several reasons. First, pQCT images provide information of both trabecular and cortical bone properties. Second, measures include volumetric bone mineral density which is independent of body size and in contrast to the size-dependent planar measure of areal bone mineral density[1-3]. Third, information of bone area and geometry (mineral distribution within imaged cross-section) are important when estimating long bone strength and monitoring bone strength development at the extremities[4].
When monitoring bone development in the growing skeleton or comparing bone properties between groups of children, it is important to assess if observed changes or differences are beyond the measurement errors and meaningful[5,6]. Information of measurement precision, related least significant changes (LSC) and sources of error when measuring the growing skeleton assist design, execution and interpretation of pediatric bone studies[1,3]. For example, evidence of precision errors related to image quality can be used to guide selection of images requiring rescanning and exclusion from the analysis. The available evidence of pQCT precision errors in children is limited and relies on data from selected skeletal sites of small study samples (Table 1)[1,2,8-14]. Thus, our primary objective was to characterize pQCT precision errors in bone area, (volumetric) density, content, and estimated strength measurements at the distal and shaft sites of both the radius and tibia in children. Our second objective was to define least significant changes for these bone outcomes and to assess whether precision errors were associated with scan quality, time between repeated measurements or child’s age, height, weight, body mass index (BMI) or limb length.
Table 1.
Summary of pQCT studies reporting precision errors for bone outcomes in children.
| Referencea | Participants | Days Apart; Repositioning; # of Scans | Skeletal Site | SV Reference Line | pQCT Scanner and Software | Pixel size and scan speed | Total and Trabecular Bone (CalcBD) | Cortical Bone (CortBD) | pQCT Precision CV% or CV%RMS |
|---|---|---|---|---|---|---|---|---|---|
| Adams et al., 2014 | Boys and girls: All ages (n=51-56) 6-10y (n=24-28) 11-18y (n=27-30) | 0; Yes; 2 | Tibia 3%, 8mm, and 38% |
Medial proximal edge of growth plate | Stratec XCT 2000 manufacturer’s software | Pixel Size (mm): 0.4 Scan Speed: (mm/s): 25 | Contour Mode: 1 Threshold (mg/cm3): 200 (3%) and 711 (38%) Peel Modeb: 4 (3%) Threshold: 600 (3%) Peel Mode: 2 (38%) Threshold: 711 (38%) | Separation Mode: 2 Threshold (mg/cm3): 711 (38%) | 3% TrD = All:1.4; 6-10y:1.5; 11-18y:1.3 8mm TrD = 2.5;2.7; 2.5 38% CoTh = 1.4; 1.3; 1.5 38% CoD = 0.5; 0.5; 0.5 38% EndoC = 1.6; 1.7; 1.5 38% PeriC = 0.4; 0.5; 0.3 38% SSIp = 2.8; 2.8; 2.8 |
| Binkley et al., 2014; Binkley & Specker, 2016 | Boys and girls (n=9; 5-11y) | 0; Yes; 2 | Non-dominant radius 4% and 20% | On most proximal end of growth plate | Stratec XCT 2000 manufacturer’s software (v6.00B) | Pixel Size (mm): 0.4 Scan Speed: (mm/s): 20 | Contour Mode: 2 Peel Mode: 2 Threshold: 400 | Separation Mode: 1 Threshold: 710 (280 for SSIp) |
4% TrC = 4.2
4% TrA =4.3
4% TrD = 1.9 4% ToC = 2.7 4% ToA = 2.8 4% ToD = 1.7 20% ToA = 0.9 20% CoA = 1.9 20% CoC = 2.5 20% CoTh = 2.7 20% CoD = 0.4 20% PeriC = 0.5 20% EndoC = 1.4 20% SSIp = 4.9 |
| Binkley & Specker, 2000 | Boys and girls (n=11; 3-5y) | 0; Yes; 2 | Left tibia 20% | No scout view | Stratec XCT 2000 manufacturer’s software (v5.4B) | Pixel Size (mm): 0.4 Scan Speed: (mm/s): 20 | Contour Mode: 2 Peel Mode: 2 Threshold: 400 | Separation Mode: 1 Threshold: 710 |
ToA = 3.1
CoA = 4.5 CoTh = 6.8 |
| Binkley et al., 2002 | Boys and girls (n=6; 6-14y) | 0; Yes; 2 | Left tibia 20% | No scout view | Stratec XCT 2000 manufacturer’s software (v5.4B) | Pixel Size (mm): 0.4 Scan Speed: (mm/s): 30 | Contour Mode: 2 Peel Mode: 2 Threshold: 400 | Separation Mode: 1 Threshold: 710 |
CoA = 1.9
CoD = 0.5 PeriC = 1.4 |
| Detter et al., 2014 | Healthy children (n=13; age NR) | NR; Yes; 2 | Tibia 4% and 38% and radius 4% and 66% | On physeal plate of tibia and radius | Stratec XCT 2000 manufacturer’s software | Pixel Size (mm): NR Scan Speed: (mm/s): NR | NR | NR | 4% Tib TrD = 1.7 38% Tib CoA = 1.1 38% Tib CoD = 0.5 4% Rad TrD = 3.4 66% Rad CoA = 4.6 66% Rad CoD = 1.4 |
| Dyson et al., 1997 | Boys and girls (n=12; 10.5±1.7y) | NR; Yes; 2 | Left radius 6% | On the most proximal part of the distal end of the radius | Stratec XCT 960 manufacturer’s software (v5.0) | Pixel Size (mm): NR Scan Speed: (mm/s): NR | NR | NR | ToA = 12.2 ToD = 7.9 TrA = 12.3 TrD = 5.8 CoA = 16.5 CoD = 14.7 |
| Specker & Binkley, 2003 | Young children (n= 11; 3-4y) | 0; Yes; 2 | Tibia 20% | No scout view | Stratec XCT 2000 manufacturer’s software (v5.4B) | Pixel Size (mm): 0.4 Scan Speed: (mm/s): 20 | Contour Mode: 2 Peel Mode: 2 Threshold: 400 | Separation Mode: 1 Threshold: 710 |
CoA = 5.4 PeriC = 3.6 ToA = 3.6 Co Th = 7.8 |
Information complemented by personal communication with Drs. Zemel, Binkley, Blimkie, MacDonald and Specker.
Peel mode separates trabecular bone from total bone. Abbreviations: CV = Coefficient of variation calculated as the ratio of the standard deviation to the mean; CoA = Cortical area; CoC = Cortical content; CoD = Cortical density; CoTh = Cortical thickness; EndoC = Endosteal circumference; NR = Not reported; PeriC = Periosteal circumference; PeriW = Periosteal width; pQCT = Peripheral quantitative computed tomography; SSIp = Polar strength strain index; Rad = Radius; SV = Scout view; Tib = Tibia; ToA = Total area; ToC = Total content; ToD = Total density; TrA = Trabecular area; Trabecular content; TrD = Trabecular density.
Methods
Participants
We recruited 35 children between the ages of 8 and 14 years (mean chronological age: 10.5, SD 1.7 years) from a cohort study assessing bone development in healthy children. We obtained informed assent from each child and consent from their parents or guardians. Our study complied with the World Medical Association Declaration of Helsinki and was approved by the University of Saskatchewan Biomedical Research Ethics Board.
Measurements
Anthropometrics
Anthropometric measurements were completed at the first visit only. Height was measured using a wall-mounted Harpenden stadiometer (Holtain Limited Crymych, UK), without shoes, and using standardized methodology[15]. Weight was measured using a calibrated scale (Toledo Scale Company, Ontario, Canada). The length of the ulna of the dominant arm was measured as the distance between the olecranon process and the ulnar styloid process with an anthropometric sliding caliper (Segmometer; Rosscraft Innovations, Canada)[15]. The length of the tibia of the dominant leg was measured as the distance between the base of the medial malleolus and the superior margin of the medial epicondyle[15]. Anthropometric measurements (height, weight, limb lengths) were taken three times at the first visit and the median values were used for the calculation of scanning sites (limb lengths) and in statistical analyses.
pQCT data acquisition
A single operator (WD) scanned the dominant forearm and lower leg using pQCT (XCT 2000, Stratec Medizintechnik GmbH, Pforzheim, Germany). Participants identified their dominant forearm as their preferred writing hand and dominant leg as their preferred kicking foot. If a participant was unsure which leg they would kick a ball with, we measured the leg ipsilateral to the dominant arm. If the participant had suffered a fracture at the dominant limb, then the non-dominant limb was measured. The operator first obtained a scout view over the wrist and ankle joints and placed a reference line above the growth plate using the reference of the bone-cartilage interface (white radiopaque shadow) just below the proximal edge of the medial epiphysis (Figure 1)[16]. Cross-sectional images were then scanned at the distal (4% of ulna and tibia lengths proximal to the reference line) and shaft (65% of ulna and 66% tibia lengths) sites using following parameters: 0.4 mm pixel size, 2.4 mm slice thickness and 20 mm/s scanning speed. We attempted a rescan if the movement artifact was severe enough to cause the cortex to appear incomplete at one or more points of the scan (Figure 2A). The same operator performed repeated scanning with a minimum of one day between scans (mean time between scans: 26.9, SD 18.4 days) and manually defined the region of interest (ROI) around each radius and tibia image, excluding possible movement artefacts as illustrated (Figure 2A).
Figure 1.
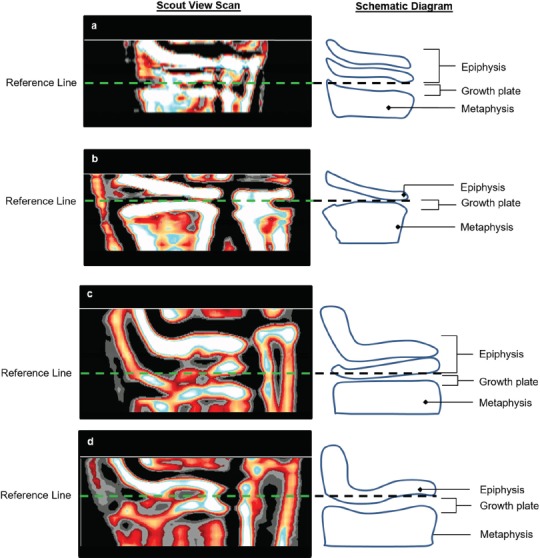
Reference line placement at the proximal edge of the slightly flattened part of the medial epiphysis in scout views illustrating some variability of density at the a) radius and c) tibia epiphyses, likely from the superimposition of the oblique edges of the articular surface in this position; and more homogeneous appearance to the density at the b) radius and d) tibia epiphyses, with the articular surface of the radius positioned more perpendicular to the detector.
Figure 2.
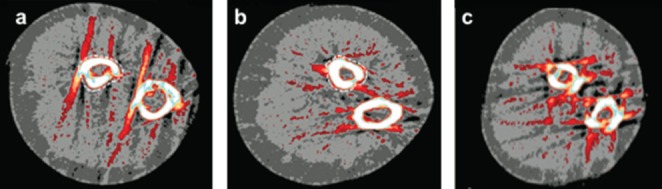
Example images illustrating scan quality with the region if interest (ROI) defined around the 65% radius (white dotted line) site: a) Scan with broken cortex (defined as incomplete cortex at one or more points); b) Scan rated 5 according to qualitative analysis[18]; c) Unanalyzable scan (ROI could not be defined without assumption of bone shape).
pQCT data quality analysis
Prior to image analysis, we defined scan quality including movement/ring artifacts in the repeated scans and recorded any errors or inconsistencies in the reference line placements. We first excluded scans that could not be analyzed due to extensive movement artifacts (and beam hardening) without assumption of bone shape (Figure 2C) or due to incorrectly placed reference line (reference line was placed at the top of the epiphysis as per our adult protocol, N=2)[17]. In total, we excluded 5 (7%) distal radius, 7 (10%) radius shaft, 6 (9%) distal tibia and 4 (6%) tibia shaft scans. We excluded all scans from one participant due to significant movement artifacts and refusal to repeat scans. Scans from the remaining 34 participants were independently rated by three reviewers. In a side by side comparison, each of the three reviewers (WD, KB, CK) evaluated the scout view scans for each participant’s first and second measurement to determine if the reference lines were placed consistently between the first and second scans. Following this, they viewed the corresponding cross-sectional images from both distal and shaft sites to determine if the cortex was intact, and further rated the shaft sites scans based on the qualitative analysis of the scans using the visual inspection scale of 1-5[18]. If there was a disagreement between the reviewers a fourth reviewer (SK) reviewed and made the final decision as to what category the scout view or cross-sectional image would be included. Resulting categories included: A) All analyzable scans; B) scans with consistent reference line placement by excluding scans with inconsistent reference line placement; C) scans with intact cortex by excluding images with broken cortical bone (Figure 2A); or D) scans rated ≤4 based on the scan quality assessment by excluding images rated 5 (Figure 2B) according to the visual inspection scale 1-5[18]. The last category (D) pertained to the shaft scans only[18].
pQCT data analysis
A single operator (KB) analyzed images using manufacturer software (Stratec Medical, version 6). At the distal radius and tibia sites, we used Contour Mode 1 (with outer threshold of 200 mg/cm3) to define: Total area (ToA; mm2), content (mg/mm), and density (ToD; mg/cm3); and estimated bone strength in compression (BSIc; mg2/mm4). BSIc was calculated as the product of ToA and ToD squared (BSIc= ToA x ToD2; mm4)4]. We used Peel Mode 2 (with a threshold of 480 mg/cm3) to define: trabecular area (mm2), content (mg/mm), and density (mg/cm3). At the shaft sites, we used Contour Mode 1 with outer threshold of 280 mg/cm3 for total bone and Separation Mode 4 (with outer threshold of 280 mg/cm3 and inner threshold of 480 mg/cm3) for cortical bone outcomes: total area (mm2) and content (mg/mm); cortical area (mm2), content (mg/mm), and density (mg/cm3); and estimated bone strength in torsion (mm3). We used circular ring mode for cortical thickness (mm).
Statistical analyses
Precision errors were assessed by calculating coefficient of variation root-mean-squared (CV%RMS) for each outcome as recommended[5] and presented herein:
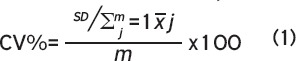
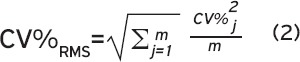
Where SD is equivalent to the standard deviation of the repeat measurements, is equivalent to the mean of the repeat measurements, and m is the sample size. We calculated the LSC by multiplying CV%RMS by 2.77[6,19-21]. We reported CV%RMS and LSC for all scan quality categories (A-D). We also assessed precision errors by combining categories B & C as well as B & D and the precision errors appeared comparable to errors reported in categories B, C and D (data not shown). We used Bland-Altman plots to evaluate if repeated scans (despite scan quality) would fit within the 95% limits-of-agreement defined by excluding scans with quality issues[22]. We calculated Spearman’s correlation coefficients (rho) to characterize associations across precision errors (CV%) and time between measurements, child’s age, height, weight, BMI or limb length. We set significance as p<0.05.
Results
The anthropometric results were: mean height 143.8 (SD 12.6) cm; weight 37.9 (11.1) kg; BMI 18.0 (2.4); ulna length 229.1 (23.5) mm; and tibia length 465.7 (35.1) mm.
Precision errors (CV%RMS)
For scans at the distal radius, CV%RMS ranged from 4.2% for total density to 19.3% for trabecular content (Table 2). For scans at the distal tibia, CV%RMS ranged from 2.1% for total density to 14.4% for trabecular content (Table 2). For scans at the radius shaft, CV%RMS ranged from 4.4% for cortical content to 7.6% for cortical thickness (Table 2). For scans at the tibia shaft, CV%RMS ranged from 1.7% for cortical content to 6.2% for bone strength in torsion (Table 2).
Table 2.
Mean, CV%RMS, and LSC for repeated bone outcomes at the distal and shaft sites of radius and tibia based on scan quality.
| Distal Radius | Distal Tibia | |||||||||||
|---|---|---|---|---|---|---|---|---|---|---|---|---|
| A) All Scans (n = 30) | B) Consistent Reference Line (n = 29) | A) All Scans (n = 29) | B) Consistent Reference Line (n = 24) | |||||||||
| Mean (SD) | CV%RMS | LSC | Mean (SD) | CV%RMS | LSC | Mean (SD) | CV%RMS | LSC | Mean (SD) | CV%RMS | LSC | |
| ToA (mm2) | 250.9 (54.0) | 10.5 | 29.0 | 251.8 (52.5) | 9.0 | 24.9 | 714.6 (142.0) | 8.9 | 24.6 | 711.4 (139.1) | 7.2 | 19.8 |
| ToC (mg/mm) | 71.7 (16.7) | 8.3 | 23.0 | 71.0 (16.3) | 6.3 | 17.5 | 204.0 (42.6) | 8.1 | 22.4 | 207.4 (42.5) | 6.7 | 18.6 |
| ToD (mg/cm3) | 287.1 (32.3) | 4.2 | 11.7 | 283.3 (32.6) | 4.3 | 12.0 | 286.6 (31.6) | 2.1 | 5.9 | 292.8 (31.4) | 1.7 | 4.6 |
| TrA (mm2) | 226.7 (52.5) | 15.2 | 42.1 | 228.5 (51.2) | 13.3 | 36.9 | 644.1 (144.6) | 11.3 | 31.2 | 637.1 (144.0) | 9.1 | 25.1 |
| TrC (mg/mm) | 57.2 (13.5) | 19.3 | 53.3 | 57.1 (13.1) | 16.2 | 44.8 | 159.5 (37.1) | 14.4 | 39.9 | 160.2 (38.2) | 11.7 | 32.4 |
| TrD (mg/cm3) | 252.0 (22.1) | 4.9 | 13.6 | 249.8 (22.3) | 3.4 | 9.3 | 247.3 (20.4) | 3.5 | 9.8 | 251.0 (20.5) | 3.0 | 8.3 |
| BSIc (mg2/mm4) | 20.8 (6.1) | 8.0 | 22.1 | 20.3 (6.0) | 6.0 | 16.6 | 59.0 (16.5) | 7.8 | 21.6 | 61.2 (16.8) | 6.7 | 18.5 |
| Radius Shaft | ||||||||||||
| A) All Scans (n = 28) | B) Consistent Reference Line (n = 27) | C) Intact Cortex (n = 26) | D) Qualitative Analysis18 (n = 17) | |||||||||
| Mean (SD) | CV%RMS | LSC | Mean (SD) | CV%RMS | LSC | Mean (SD) | CV%RMS | LSC | Mean (SD) | CV%RMS | LSC | |
| ToA (mm2) | 120.9 (27.1) | 6.7 | 18.6 | 121.4 (27.5) | 6.4 | 17.8 | 121.6 (27.9) | 6.9 | 19.1 | 124.2 (30.0) | 6.4 | 17.7 |
| CoA (mm2) | 75.1 (14.6) | 5.1 | 14.2 | 75.2 (14.8) | 5.1 | 14.2 | 75.4 (15.0) | 5.0 | 13.7 | 77.1 (17.1) | 4.3 | 11.9 |
| CoC (mg/mm) | 63.6 (15.0) | 4.4 | 12.2 | 63.7 (15.3) | 4.5 | 12.4 | 64.1 (15.4) | 4.2 | 11.7 | 66.4 (17.6) | 2.1 | 5.8 |
| CoD (mg/cm3) | 843.6 (67.8) | 4.5 | 12.4 | 843.4 (69.0) | 4.5 | 12.5 | 847.4 (68.9) | 4.6 | 12.8 | 856.8 (71.9) | 3.6 | 9.8 |
| CoTh (mm) | 2.4 (0.4) | 7.6 | 21.0 | 2.4 (0.4) | 7.7 | 21.2 | 2.4 (0.4) | 7.6 | 21.0 | 2.5 (0.5) | 3.9 | 10.9 |
| SSIp (mm3) | 184.1 (54.0) | 6.2 | 17.3 | 185.1 (54.8) | 5.6 | 15.6 | 186.8 (55.2) | 6.2 | 17.2 | 197.1 (60.0) | 5.4 | 15.0 |
| Tibia Shaft | ||||||||||||
| A) All Scans (n = 31) | B) Consistent Reference Line (n = 26) | C) Intact Cortex (n = 30) | D) Qualitative Analysis18 (n = 27) | |||||||||
| Mean (SD) | CV%RMS | LSC | Mean (SD) | CV%RMS | LSC | Mean (SD) | CV%RMS | LSC | Mean (SD) | CV%RMS | LSC | |
| ToA (mm2) | 469.3 (80.4) | 5.8 | 16.2 | 472.9 (75.6) | 6.2 | 17.2 | 469.5 (81.8) | 5.9 | 16.5 | 466.9 (85.6) | 6.2 | 17.1 |
| CoA (mm2) | 244.7 (44.9) | 1.9 | 5.4 | 250.6 (42.2) | 1.7 | 4.7 | 245.5 (45.4) | 2.0 | 5.4 | 242.9 (47.1) | 2.0 | 5.5 |
| CoC (mg/mm) | 215.9 (45.3) | 1.7 | 4.6 | 221.4 (44.4) | 1.5 | 4.2 | 217.2 (45.5) | 1.4 | 3.9 | 216.4 (48.0) | 1.4 | 3.8 |
| CoD (mg/cm3) | 880.3 (47.1) | 2.5 | 6.9 | 880.8 (50.9) | 2.5 | 6.9 | 882.6 (46.1) | 2.2 | 6.2 | 888.3 (43.1) | 2.3 | 6.3 |
| CoTh (mm) | 3.8 (0.6) | 4.1 | 11.4 | 3.9 (0.6) | 4.1 | 11.4 | 3.8 (0.6) | 4.2 | 11.6 | 3.8 (0.6) | 4.3 | 12.0 |
| SSIp (mm3) | 1324.9 (360.0) | 6.2 | 17.3 | 1353.7 (349.2) | 6.7 | 18.6 | 1332.0 (364.0) | 6.2 | 17.2 | 1327.0 (384.1) | 6.3 | 17.4 |
Abbreviations: BSIc = Bone strength index against compression; CoA = Cortical area; CoC = Cortical content; CoD = Cortical density; CoTh = Cortical thickness; CV%RMS = Percent coefficient of variation root-mean squared; LSC = Least significant change; SD = Standard deviation; SSIp = Bone strength index against torsion; ToA = Total area; ToC = Total content; ToD = Total density; TrA = Trabecular area; TrC = Trabecular content; TrD = Trabecular density.
Least significant change (LSC)
For all scans at the distal radius, LSC ranged from 11.7% for total density to 53.3% for trabecular content (Table 2). For scans at the distal tibia, LSC ranged from 5.9% for total density to 39.9% for trabecular content (Table 2). For scans at the radius shaft, LSC ranged from 12.2% for cortical content to 21.0% for cortical thickness (Table 2). For scans at the tibia shaft, LSC for bone outcomes ranged from 4.6% for cortical content to 17.3% for bone strength in torsion (Table 2).
Precision errors, scan quality and other factors associated with precision errors
At the distal sites, CV%RMS appeared comparable between all scans and the scans with consistent reference line placement at both the radius and the tibia (Table 2). At the shaft sites, selection of better quality scans in terms of intact cortices did not appear to improve CV%RMS when compared to all scans either at the radius or tibia shafts (Table 2). Τhe majority of precision errors for all scans, including scans with quality issues were within 95% of the limit of agreement based on scans without quality issues (Figure 3). Number of days between the repeated scans was positively associated (rho=0.34) with cortical area precision error at the radius only (Table 3). Child’s age was negatively correlated (rho: -0.50 to -0.38) to precision errors of total density, total and trabecular area and content at the distal tibia and total area at the tibia shaft (Table 3). Height and limb length were negatively correlated (rho: -0.45 to -0.41) to trabecular density at the distal radius and total area at the tibia shaft only (Table 3). Child’s weight and BMI were not related to any precisions outcomes (data not shown).
Figure 3.
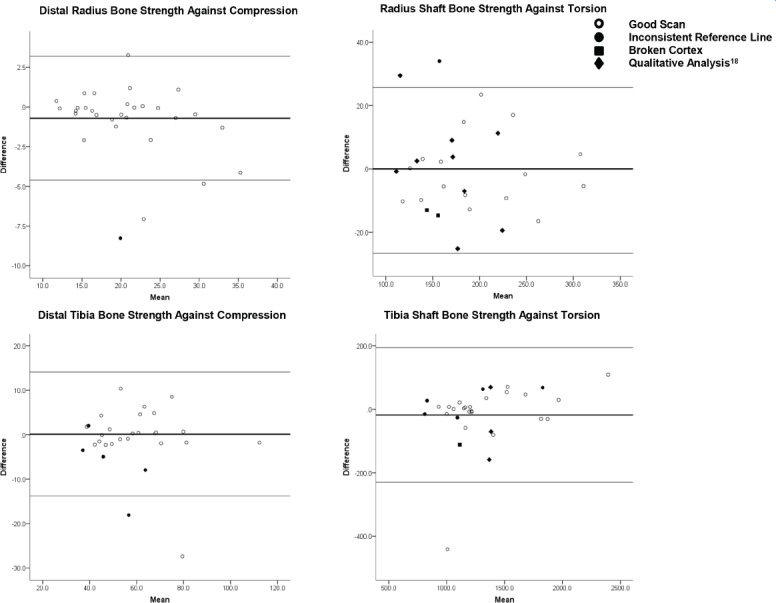
Bland-Altman plots illustrating the difference between repeated bone strength measures as a function of their mean: a) Distal radius bone strength against compression; b) Radius shaft bone strength against torsion; c) Distal tibia bone strength against compression; d) Tibia shaft bone strength against torsion. Thin lines represent 95% limits of agreement of scans with consistent reference lines and intact cortices. Thick lines represent mean difference. Open circles identify good scans (i.e. scans with no quality issues). Closed shapes identify scans with quality issues, defined as inconsistent reference line placement (circle), broken cortex (square), or rated 5 according to qualitative analysis (diamond)[18].
Table 3.
Correlations (Spearman rho) between precision errors (CV%RMS) and days between repeat measures, participant age, and anthropometrics.
| Days Between Measures | Age | Height | Limb Length | |||||
|---|---|---|---|---|---|---|---|---|
| rho | p-value | rho | p-value | rho | p-value | rho | p-value | |
| Distal Radius (n=29) | ||||||||
| TrD (mg/cm3) | 0.36 | 0.051 | -0.30 | 0.120 | -0.41 | 0.028 | -0.45 | 0.014 |
| Distal Tibia N=28 | ||||||||
| ToA (mm2) | 0.21 | 0.270 | -0.49 | 0.008 | -0.25 | 0.195 | -0.21 | 0.297 |
| ToC (mg/mm) | 0.12 | 0.524 | -0.40 | 0.047 | -0.24 | 0.218 | -0.17 | 0.377 |
| ToD (mg/cm3) | 0.32 | 0.092 | -0.38 | 0.048 | -0.20 | 0.315 | -0.15 | 0.434 |
| TrA (mm2) | 0.21 | 0.279 | -0.50 | 0.007 | -0.23 | 0.243 | -0.18 | 0.352 |
| TrC (mg/mm) | 0.27 | 0.159 | -0.48 | 0.011 | -0.28 | 0.150 | -0.21 | 0.273 |
| Radius Shaft (n = 28) | ||||||||
| CoA (mm2) | 0.39 | 0.043 | -0.07 | 0.716 | -0.07 | 0.736 | -0.08 | 0.680 |
| Tibia Shaft (n=30) | ||||||||
| ToA (mm2) | -0.11 | 0.542 | -0.46 | 0.010 | -0.42 | 0.022 | -0.41 | 0.023 |
Abbreviations: CoA = Cortical area: ToA = Total area; ToC = Total content; ToD = Total density; TrA = Trabecular area; TrC = Trabecular content; TrD = Trabecular density.
Discussion
To our knowledge, this is the first study to characterize precision errors (CV%RMS), LSC and related factors for pQCT measured bone outcomes at the distal and shaft sites of radius and tibia in children. Overall, precision errors appeared lowest (<5%) for total and trabecular density at the distal sites and cortical bone density at the shaft sites while total and trabecular bone area and content at the distal sites appeared least precise (8-19%). Precision errors at the distal sites ranged from 2-19% and at shaft sites from 2-8% resulting in a range of LSCs from 6-53% at the distal sites and 5-21% at the shaft sites. It has to be noted, that we excluded 6-10% of the images prior to the quality analysis mainly due to extensive artifacts that prevented defining region of interest without assumption of bone shape. Our exclusion included two scans obtained with erroneously placed reference lines (placed according to our adult scanning protocol). After removing scans considered unanalyzable, the quality of the scan appeared to have a minor role in repeatability of bone outcomes at radius and tibia.
Comparison between previously reported pQCT precision errors in children (Table 1) and current findings is challenging due to differences in calculating precision errors; scanned skeletal sites; data acquisition and analysis methodology. Our precision errors appeared somewhat larger than previously estimated errors (Table 1), which may relate to our sample size (small samples with inadequate degrees of freedom lead to underestimation of precision errors)[5], reporting conservative estimates (CV%RMS) and repeating measurement one or more days apart in our study[5,6,25]. Overall, these findings suggest that image analysis methods may be important for precision and outcome selection in pediatric studies. For example, cortical bone properties at the tibia shaft appeared most precise with precision errors ≤2% for cortical content and area, resulting to LSC of 5%. In contrast, precision error of cortical thickness was more than doubled resulting to LSC of 11%. The reason for more favorable precision of cortical area versus thickness may be related to assumption of circular shape of bone in the thickness calculation. This assumption may apply only for bone sites with a cylindrical cortex (such as humeral midshaft)[24] and should be applied with caution to non-cylindrical bone sites such as tibia shaft. In addition, selection of analysis modes and thresholds may also be important[25]. Our precision for total and trabecular bone properties appeared lower than for cortical bone suggesting that methods defining periosteal bone surface and separating trabecular bone from total bone could be improved. Due to poor precision of trabecular area and content reporting these outcomes may not be practical. Advances in pQCT image analysis may improve capturing the cortical and trabecular bone boundary more accurately and result to better measurement precision. Further research of comparing precision errors across different analysis protocols may assist in defining optimal and eventually more standardized methodology for pediatric pQCT imaging.
The majority of precision errors for all scans, including scans with quality issues were within 95% of the limit of agreement based on scans without quality issues. At the shaft sites, selection of better quality scans in terms of intact cortices did not appear to improve CV%RMS when compared to all scans either at the radius or tibia shafts. In contrast, selection of better quality scans in terms of a score >4 by qualitative analysis[18] did appear to improve CV%RMS of cortical bone properties at the radius shaft only. This apparent improvement in precision was likely explained by the exclusion of scans with movement artefacts, but may also be due to resulting reduction in samples size (n=17) and related underestimation of CV%RMS at the radius shaft[6]. Although our findings indicate that the scan quality has a minor role in precision errors all efforts to minimize participant discomfort and movement during scans are important for minimizing movement artefacts. As a practical suggestion, watching movies or listening to the operator counting the remaining scanner rotations has helped children to focus and facilitated stillness during the pQCT scanning in this and other studies in our lab[26].
There are some specific challenges in pediatric bone imaging with pQCT that warrant discussion. Selection and repeatability of the reference line placement in growing long bones may affect scan quality[1]. We chose to position the reference line above the growth plate immediately proximal to the medial epiphysis[16]. This radiopaque line, representing the bone-cartilage interface and overlapping bony edges within the epiphyseal shadow extends laterally from the medial margin of the epiphysis, reaching the lateral margin by approximately six years of age[16]. In repeated pQCT scout views, we observed one or two radiopaque margins challenging consistency in the reference line placement. These inconsistencies appeared to have minor influence on precision errors. However, older age of the child was associated with better precision of the tibia scans which may be due to the greater ease placing the reference line for a more mature child. Challenges related to the reference line placement should be carefully addressed and practised when training for pediatric pQCT data acquisition.
Study findings are important for clinical pediatric bone research because they suggest that after exclusion of unanalyzable scans the poorer quality scan may not improve scan precision in children. This information can assist determining if a rescan is required and avoiding a child’s exposure to unnecessary radiation. Our findings suggest that only those unanalyzable images (Figure 2C) would benefit from rescanning. In our lab, operator is instructed to obtain a rescan (or exclude scan from analysis) if movement artefacts prevent defining ROI without assumptions of bone shape. We hope that our findings would assist when developing simple guidelines for rescanning in pediatric pQCT studies. In addition, overall radiation dose (from repeated scans plus possible additional exposure from other medical imaging) and sample size requirements may be important to consider when making decisions of rescanning.
A similar qualitative analysis method of movement artifacts was recently reported[18]. In this method, images scored with either severe or extreme movement artifacts (scores 4 and 5 out of 5, respectively) such as streaking and disruption of the cortical shell were deemed unacceptable for bone and soft tissue analysis or required rescanning[18]. We applied a modified protocol of this method in our study and included scans with scores 1-4 in the analysis and excluded only scans with the qualitative analysis score of 5[18]. We used this modified protocol because the exclusion of scans with a score 4 and 5 resulted in the exclusion of 23 (82%) scans at the radius shaft and 12 (39%) scans at the tibia shaft. It has to be noted that this qualitative analysis scale was developed for lower leg scans[18]. Our findings suggest that application of this method to forearm shaft scans would result in unnecessary exclusions (or rescanning a large number of scans).
These qualitative methods rely on (variable) subjective ratings of scan quality and to overcome this limitation a quantitative method was recently proposed[18]. In this method a ratio of movement to limb size (%Move) provided a measure of movement artefact in the scans and %Move >25% was defined as a cut off for rescanning[18]. We attempted but could not apply this %Move method for our study purposes for the following reasons. First, the %Move method appears to be applied to the whole limb including both bones (e.g. tibia and fibula) rather than individual bone (e.g. tibia)[18]. We focused on precision errors for radius and tibia bone outcomes and defined ROI around each bone, close to the periosteal border. This is important because defining ROI closely around the analyzed bone likely helped to exclude movement artefacts and may explain comparable precision errors across the scans with and without movement errors. Second, the quantitative %Move method was developed for lower leg shaft scans and may not be applicable to forearm shaft scans (or scans from the distal bone sites). Third, the %Move method appeared time consuming and thus, impractical for decision-making at the time a child is scanned.
It is worth recognizing that our study has several strengths. First, we carefully addressed precision errors, LSC and related factors at the distal and shaft sites of both radius and tibia. Second, our sample size was sufficient for meeting recommended degrees of freedom and together with the reported geometric means resulted in reliable estimates of precision errors[5]. Finally, we not only repositioned our participants between the repeated scans, but acquired repeated scans a minimum of 24 hours apart. This is important as repeating scans within the same day may result in underestimation of precision errors[25].
It is also important to note study limitations. First, our findings were limited to the used pQCT methodology; including skeletal sites assessed and selected data acquisition and analysis protocols. Second, our sample size was defined to meet the sample size recommendation for calculating precision errors (CV%RMS) and may have been limited for addressing the role of scan quality and factors related to precision errors. Third, our results from healthy children may not be generalizable to children with musculoskeletal diseases. Fourth, our age range was 8-14 years old and results may not be applicable in younger children as suggested by the observed negative association between child’s age and precision errors at the tibia. Finally, limb length was measured on the first visit and used for repeat scans to avoid possible contribution of limb length precision errors to the scan precision. In longer-term studies, however, pQCT scan repeatability may be poorer when precision errors will include the error of the repeated limb length measures in the growing bones. Future research is warranted to address contribution of limb length measurement precision to the precision errors in pQCT outcomes.
Conclusion
Total, trabecular and cortical bone densities, as well as cortical bone area and content, appeared most precise (≤5%) across pQCT measures of the radius and tibia bone properties in children. After scans with major quality issues were removed, findings suggest that scans with remaining quality issues had minimal influence on precision errors at the radius and tibia while older age of the child was associated with better precision of the tibia scans. Reported precision errors, least significant changes and information of factors associated with precision errors can guide design, execution and interpretation of pQCT studies monitoring bone development in children.
Acknowledgements
We thank study participants and their parents for volunteering and Drs. Binkley, Blimkie, MacDonald, Specker and Zemel for the personal communication and information they provided to complement literature review of precision studies outlined in [Table 1].
Footnotes
The authors have no conflict of interest.
Edited by: F. Rauch
Grants
This study was funded in part by University of Saskatchewan Canadian Institutes of Health Research (CIHR) Bridge fund, CIHR-RPP New Investigator Award and NSERC Discovery grant (#04442).
Author contributions
Study design: WD, KB, CK, and SK. Data acquisition: WD. Data analysis: WD, KB, and AK. Drafting of manuscript: WD. Responsibility for the integrity of data analysis: SK. All authors provided manuscript edits and revisions and approved the final version of the submitted manuscript.
References
- 1.Adams JE, Engelke K, Zemel BS, Ward KA. Quantitative computed tomography in children and adolescents: The 2013 ISCD Pediatric Official Positions. J Clin Densitom. 2014;17(2):258–274. doi: 10.1016/j.jocd.2014.01.006. [DOI] [PubMed] [Google Scholar]
- 2.Binkley TL, Specker BL. pQCT measurement of bone parameters in young children: validation of technique: validation of technique. J Clin Densitom. 2000;3(1):9–14. doi: 10.1385/jcd:3:1:009. [DOI] [PubMed] [Google Scholar]
- 3.Zemel B, Bass S, Binkley T, et al. Peripheral quantitative computed tomography in children and adolescents: the 2007 ISCD Pediatric Official Positions. J Clin Densitom. 2008;11(1):59–74. doi: 10.1016/j.jocd.2007.12.006. [DOI] [PubMed] [Google Scholar]
- 4.Kontulainen S, Johnston J, Liu D, Leung C, Oxland T, McKay H. Strength indices from pQCT imaging predict up to 85% of variance in bone failure properties at tibia epiphysis and diaphysis. J Musculoskelet Neuronal Interact. 2008;8(4):401–409. [PubMed] [Google Scholar]
- 5.Glüer CC, Blake G, Lu Y, Blunt BA, Jergas M, Genant HK. Accurate assessment of precision errors: how to measure the reproducibility of bone densitometry techniques. Osteoporos Int. 1995;5:262–70. doi: 10.1007/BF01774016. [DOI] [PubMed] [Google Scholar]
- 6.Glüer CC. Monitoring skeletal changes by radiological techniques. J Bone Miner Res. 1999;14(11):1952–62. doi: 10.1359/jbmr.1999.14.11.1952. [DOI] [PubMed] [Google Scholar]
- 7.Binkley TL, Parupsky EC, Kleinsasser BA, Weidauer LA, Specker BL. Feasibility, compliance, and efficacy of a randomized controlled trial using vibration in pre-pubertal children. J Musculoskelet Neuronal Interact. 2014;14(3):294–302. [PubMed] [Google Scholar]
- 8.Binkley TL, Specker BL. The negative effect of sitting time on bone is mediated by lean mass in pubertal children. J Musculoskelet Neuronal Interact. 2016;16(1):18–23. [PMC free article] [PubMed] [Google Scholar]
- 9.Binkley TL, Specker BL, Wittig TA. Centile curves for bone densitometry measurements in healthy males and females ages 5-22 yr. J Clin Densitom. 2002;5(4):343–53. doi: 10.1385/jcd:5:4:343. [DOI] [PubMed] [Google Scholar]
- 10.Detter F, Rosengren BE, Dencker M, Lorentzon M, Nilsson J, Karlsson MK. A 6-year exercise program improves skeletal traits without affecting fracture risk: A prospective controlled study in 2621 children. J Bone Miner Res. 2014;29(6):1325-36.18. doi: 10.1002/jbmr.2168. [DOI] [PubMed] [Google Scholar]
- 11.Bland JM, Altman DG. Statistical methods for assessing agreement between two methods of clinical measurement. Lancet. 1986:307–10. [PubMed] [Google Scholar]
- 12.Dyson K, Blimkie CJ, Davison KS, Webber CE, Adachi JD. Gymnastic training and bone density in pre-adolescent females. Med Sci Sports Exerc. 1997;29(4):443–50. doi: 10.1097/00005768-199704000-00004. [DOI] [PubMed] [Google Scholar]
- 13.Macdonald H, Kontulainen S, Petit M, Janssen P, McKay H. Bone strength and its determinants in pre- and early pubertal boys and girls. Bone. 2006;39(3):598–608. doi: 10.1016/j.bone.2006.02.057. [DOI] [PubMed] [Google Scholar]
- 14.Specker B, Binkley T. Randomized trial of physical activity and calcium supplementation on bone mineral content in 3- to 5-year-old children. J Bone Miner Res. 2003;18(5):885–92. doi: 10.1359/jbmr.2003.18.5.885. [DOI] [PubMed] [Google Scholar]
- 15.Norton K, Whittingham N, Carter L, Kerr D, Gore C, Marfell-Jones M. Measurement techniques in anthropometry. Sydney: UNSW; 1996. [Google Scholar]
- 16.Roche AF, Chumlea WC, Thissen D. Assessing the skeletal maturity of the hand-wrist: FELS method. Charles C Thomas. 1921 doi: 10.1002/ajhb.1310010206. [DOI] [PubMed] [Google Scholar]
- 17.Duckham R, Frank A, Johnston J, Olszynski W, Kontulainen S. Monitoring time interval for pQCT-derived bone outcomes in postmenopausal women. Osteoporos Int. 2013;24:1917–22. doi: 10.1007/s00198-012-2242-0. [DOI] [PubMed] [Google Scholar]
- 18.Blew RM, Lee VR, Farr JN, Schiferl DJ, Going SB. Standardizing evaluation of pQCT image quality in the presence of subject movement: qualitative versus quantitative assessment. Calcif Tissue Int. 2014;94(2):202–11. doi: 10.1007/s00223-013-9803-x. [DOI] [PMC free article] [PubMed] [Google Scholar]
- 19.Kawalilak CE, Johnston JD, Olszynski WP, Kontulainen SA. Least significant changes and monitoring time intervals for high-resolution pQCT-derived bone outcomes in postmenopausal women. J Musculoskelet Neuronal Interact. 2015;15(2):190–196. [PMC free article] [PubMed] [Google Scholar]
- 20.Kawalilak CE, Johnston JD, Cooper DM, Olszynski WP, Kontulainen SA. Role of endocortical contouring methods on precision of HR-pQCT derived cortical microarchitecture in postmenopausal women and young adults. Osteoporos Int. 2016;27(2):789–796. doi: 10.1007/s00198-015-3262-3. [DOI] [PubMed] [Google Scholar]
- 21.Bonnick S, Johnston C, Kleerekoper M, Lindsay R, Miller P, Sherwood L, Siris E. Importance of precision in bone density measurements. J Clin Densitom. 2001;4(2):105–110. doi: 10.1385/jcd:4:2:105. [DOI] [PubMed] [Google Scholar]
- 22.Bland JM, Altman DG. Statistical methods for assessing agreement between two methods of clinical measurement. Lancet. 1986:307–10. [PubMed] [Google Scholar]
- 23.Kontulainen S, Sievanen H, Kannus P, Pesanen M, Vuori I. Effect of long-term impact-loading on mass, size, and estimated strength of humerus and radius of female racquet-sports players: A peripheral quantitative computed tomography study between young and old starters and controls. J Bone Miner Res. 2008;8(2):352–359. doi: 10.1359/jbmr.2003.18.2.352. [DOI] [PubMed] [Google Scholar]
- 24.Ward KA, Adams JE, Hangartner TN. Recommendations for thresholds for cortical bone geometry and density measurement by peripheral quantitative computed tomography. Calcif Tissue Int. 2005;77:275–280. doi: 10.1007/s00223-005-0031-x. [DOI] [PubMed] [Google Scholar]
- 25.Swinford RR, Warden SJ. Factors affecting short-term precision of musculoskeletal measures using peripheral quantitative computed tomography (pQCT) Osteoporos Int. 2010;21:1863–1870. doi: 10.1007/s00198-009-1151-3. [DOI] [PubMed] [Google Scholar]
- 26.Erlandson MC, Kontulainen SA, Baxter-Jones AD. Precompetitive and recreational gymnasts have greater bone density, mass, and estimated strength at the distal radius in young childhood. Osteoporos Int. 2011;22(1):75–84. doi: 10.1007/s00198-010-1263-9. [DOI] [PubMed] [Google Scholar]