Abstract
During spatial navigation, neural activity in the hippocampus and the medial entorhinal cortex (MEC) is correlated to navigational variables like location1,2, head direction3, speed4, and proximity to boundaries5. These activity patterns are thought to provide a map-like representation of physical space. However, the hippocampal/entorhinal circuit is involved not only in spatial navigation, but in a variety of memory-guided behaviors6. The relationship between this general function and the specialized spatial activity patterns is unclear. A conceptual framework reconciling these views is that spatial representation is just one example of a more general mechanism for encoding continuous, task-relevant variables7–10. We tested this idea by recording hippocampal and entorhinal neurons in a task that required rats to use a joystick to manipulate sound along a continuous frequency axis. We found neural representation of the entire behavioral task, including activity that formed discrete firing fields at particular sound frequencies. Neurons involved in this representation overlapped with the known spatial cell types in the circuit like place cells and grid cells. These results suggest that common circuit mechanisms in the hippocampal/entorhinal system are used for representations of diverse behavioral tasks, possibly supporting cognitive processes beyond spatial navigation.
Spatial firing is often considered to be one specific example of a “cognitive map” – a general representation of relationships between cognitive entities7,8,11. These entities can correspond to different locations, but can also be distinct stimuli or even abstract concepts. Consistent with this idea, the firing of hippocampal cells is modulated not only by location, but also by non-spatial variables, including sensory, behavioral and internal parameters12,13. For example, hippocampal neurons respond to discrete stimuli like sounds14, odors15, faces and objects16. Hippocampal and entorhinal neurons also respond to locations in visual space17 and can fire at different time points of temporal delay tasks (“time cells”18–21). Finally, recent fMRI studies have suggested that cognitive spaces defined by continuous dimensions are represented by the human hippocampal/entorhinal system9,10.
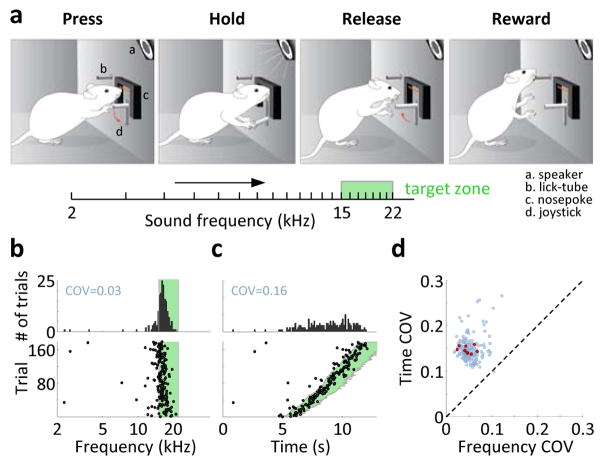
One interpretation of these studies is that any arbitrary continuous variables that are relevant to the animal can be represented by the hippocampal/entorhinal activity using a common circuit mechanism. To test this idea, we designed a “sound manipulation task” (SMT), in which rats changed the frequency of sound in their environment (Fig. 1a). Animals deflected a joystick to activate a pure tone produced by a sound speaker. They continued deflecting in order to increase frequency along a perceptually uniform logarithmic axis22. Rewards were obtained by releasing the joystick within a fixed target frequency range. To uncouple frequency from the amount of elapsed time, we randomly varied, across trials, the “speed” of frequency traversal. Resulting trials varied in duration by up to a factor of 2, on average in the range of 5–10 s.
Figure 1. Sound modulation task.
a) Schematic of the SMT. Rat deflects a joystick to increase sound frequency and must release it in a target zone. b) Frequencies at which the joystick was released on individual trials (bottom), and the distribution of these frequencies across trials (top). Most releases occurred early in the target zone (green). COV: coefficient of variation of the distribution. c) Same data, but plotted as a function of time. The COV indicates a bigger spread of the distribution. d) COV values of frequencies and times at the joystick release across all 189 sessions from 9 rats (blue). Red: median values across sessions for each of the rats.
Rats typically released the joystick at frequencies that were narrowly distributed early in the target zone (Fig. 1b). Across animals, the release was within the target zone on 70.8±2.6% of the trials (N=9 rats, mean±s.e.m. here and elsewhere). Rats did not follow a simple timing strategy, but released the joystick later during slower trials (Fig. 1c), indicating an influence of sound frequency on their behavior. In fact, joystick releases could be largely predicted by sound frequency alone with almost no added influence of elapsed time (Extended Data Fig. 1). Consequently, trial durations were more broadly distributed than sound frequencies at the release (coefficient of variation of 0.146±0.002 and 0.046±0.005, respectively; N=9 rats; p<0.001, t-test; Fig. 1d). Thus, rats successfully performed the SMT and appeared to use a sound frequency-guided strategy.
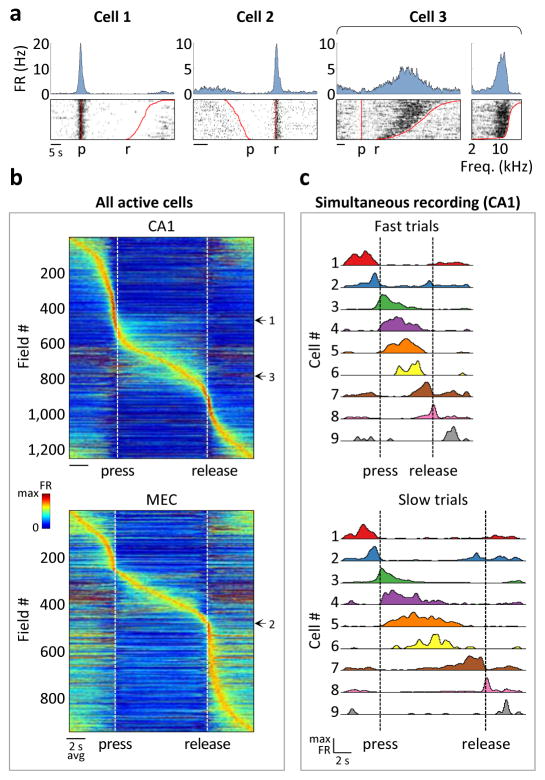
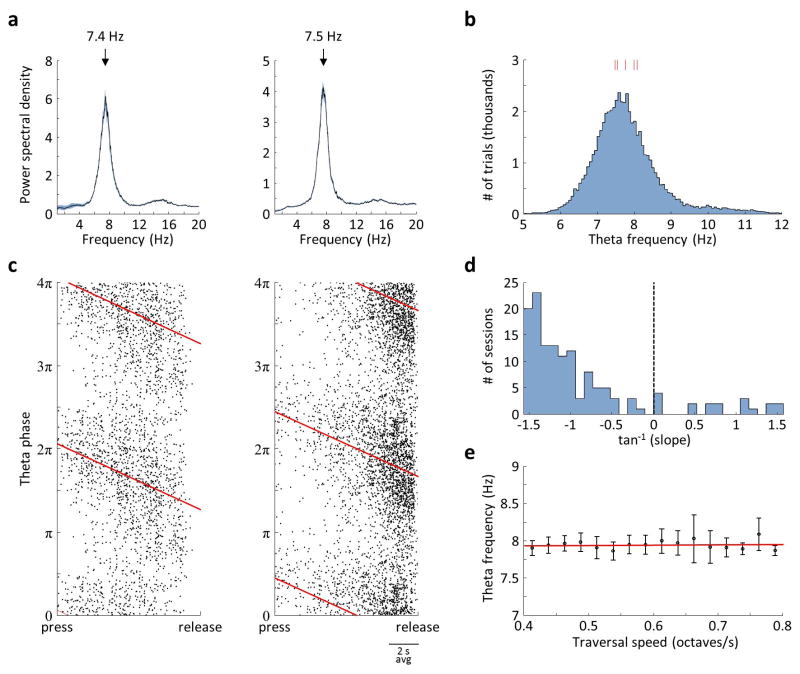
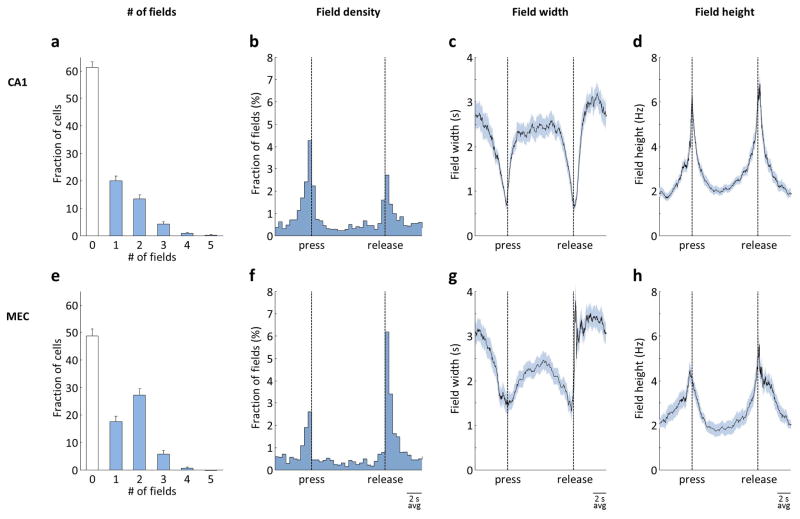
We recorded 2208 units in the dorsal CA1 of 5 rats and 1164 units in the dorsal MEC of 9 rats (Extended Data Fig. 2). We observed that 40.0% and 51.3% of cells in these regions, respectively, had firing rates that were significantly modulated during the SMT (p<0.01, shuffle test). Activity of these cells tended to be stable across trials (Extended Data Fig. 3) and was largely confined to discrete firing fields (Fig. 2a) akin to those observed during spatial navigation. Across the population, fields clustered at trial boundaries (i.e., near joystick presses and releases; Fig. 2b). However, they spanned the entire task, occurring both during and outside of the sound presentation period. Neural activity exhibited other properties similar to those observed during spatial navigation, including theta modulation and precession (Extended Data Fig. 4), as well as a larger number of fields per cell in MEC than in CA1 (Extended Data Fig. 5).
Figure 2. CA1 and MEC activity in the SMT.
a) Cells that were active during the joystick press (cell 1) and release (cell 2) and during sound presentation (cell 3). Top: PSTHs. Bottom: Spike raster plots, aligned to the press and sorted by trial duration. For cell 3, the same spiking data is also plotted as a function of frequency, with trials sorted by the frequency at the joystick release. FR: firing rate; p: press; r: release. b) Firing rates of all SMT-modulated cells across rats – 882 cells of 2208 total for CA1 and 596 cells of 1164 total for MEC. Each row corresponds to a field; cells with multiple fields are included more than once. Time is linearly warped in order to average trials of different durations. Each row is normalized to the maximum firing rate of the field to which it is aligned, and rows are sorted by field time. Color scale is from 0 to 1.5, accommodating fields other than the one used for alignment. Individual examples from (a) are marked. c) PSTHs of simultaneously-recorded neurons, averaged separately across trials of different durations. The sequence of activity expands and contracts with trial duration.
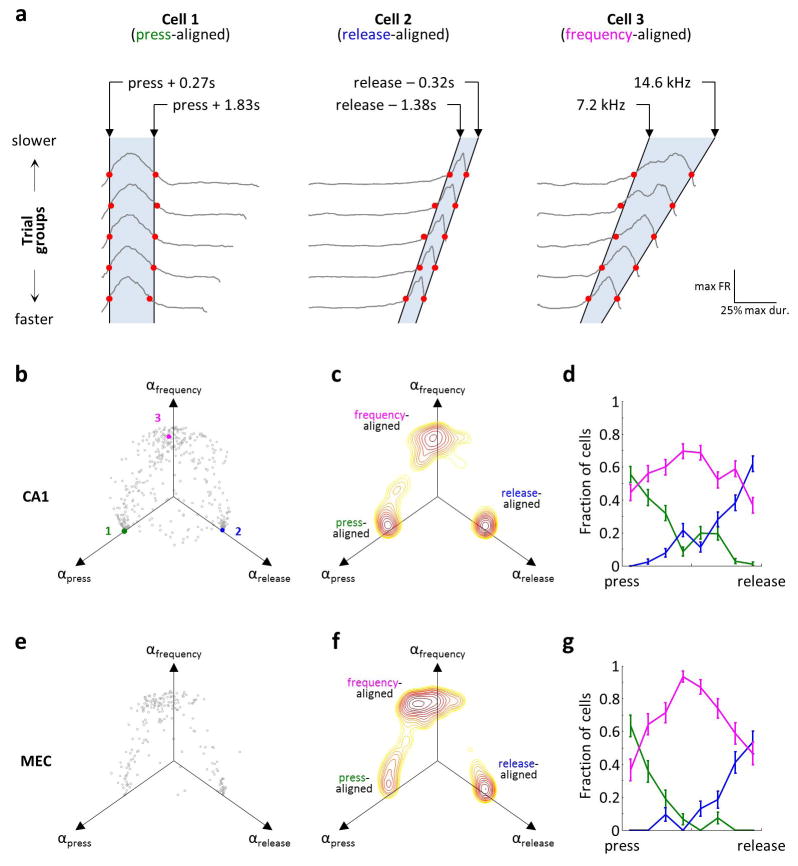
Some cells fired around consistent sound frequency values (e.g. cell 3 in Fig. 2; Extended Data Fig. 6) independently of trial duration, forming “frequency fields” analogous to place fields in spatial navigation. As a result, population activity could be viewed as a sequence of firing fields that expanded and contracted in time for trials of different durations (Fig. 2c). To quantify this frequency locking, we implemented a model that tested the strength of alignment of the neural activity to various task events (Extended Data Fig. 7). Of the fields that occurred during sound presentation, more than half in both CA1 and MEC aligned best to particular sound frequencies, whereas the rest were more strongly time-locked either to the press or to the release of the joystick (Extended Data Fig. 8).
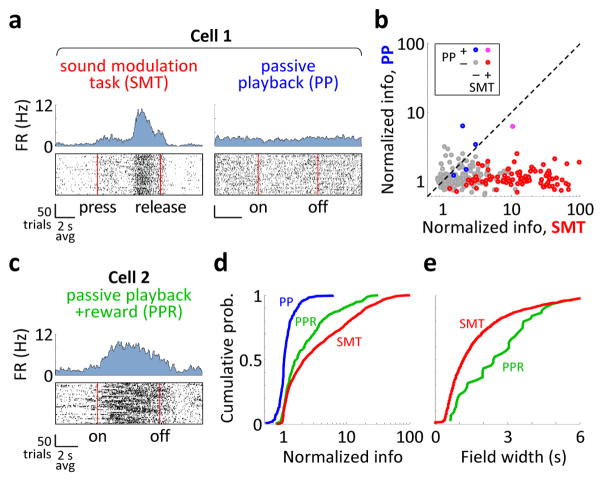
Were SMT-modulated cells responding to particular features of the auditory stimulus, or were they related to the progression of the behavioral task itself? To address this question, we presented sound frequency sweeps of the same frequencies and durations when rats were not performing the SMT. Almost none of the CA1 cells, including the SMT-modulated ones, responded to the passive playback (1.7% compared to 31.1% in the SMT; N=295 cells in 3 rats; p<0.001, χ2 test; Fig. 3a,b). In another experiment, we presented additional rats with frequency sweeps, but increased the salience of these stimuli by delivering a reward at the end of each sweep. In this case, we observed task-modulated activity, but in fewer cells than in the SMT (20.2% of 248 cells in 2 rats; p<0.001, χ2 test; Fig. 3c,d; Extended Data Fig. 9). Firing fields in this passive playback+reward task were also wider than in the SMT (2.49±0.29 s and 1.16±0.05 s; N=1252 and 44 fields, respectively; p<0.001, Wilcoxon rank-sum test; Fig. 3e). Thus, behavioral context affected the fraction of neurons activated and their temporal precision. However, the coupling between actions and sounds (i.e. agency) was not strictly required to engage hippocampal activity.
Figure 3. Activity depends on the behavioral context.
a) Activity of the same CA1 neuron in the SMT and during passive playback (PP) of acoustic stimuli that matched those in the SMT. Top: PSTHs. Bottom: Raster plots, with time linearly warped between the press and the release of the joystick. FR: firing rate; on: sound onset; off: sound offset. b) Firing rate modulations of all 295 CA1 neurons recorded in the SMT and PP. ‘Normalized information’ is the mutual information between spikes and the phase of the task, divided by the average value from samples with shuffled spike timing. Points are colored according to whether the cell’ was SMT-modulated and whether it was modulated by PP. c) Activity of a neuron during passive playback of acoustic stimuli that were followed by rewards (PPR). d) Cumulative histograms of the normalized information in the three tasks (295 cells for SMT and PP and 248 cells for PPR). e) Cumulative histograms of the field durations in the SMT and the PPR. Activity shows progressively stronger and temporally precise task modulation in the PP, PPR, and SMT tasks.
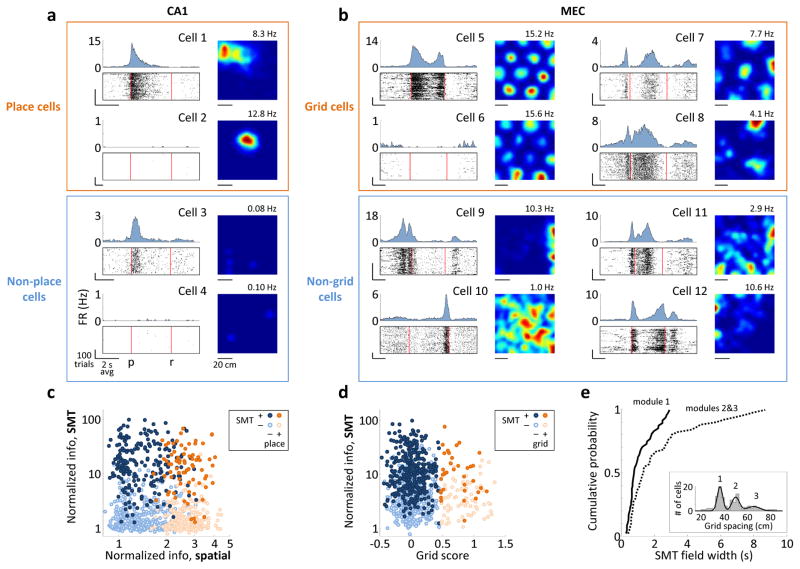
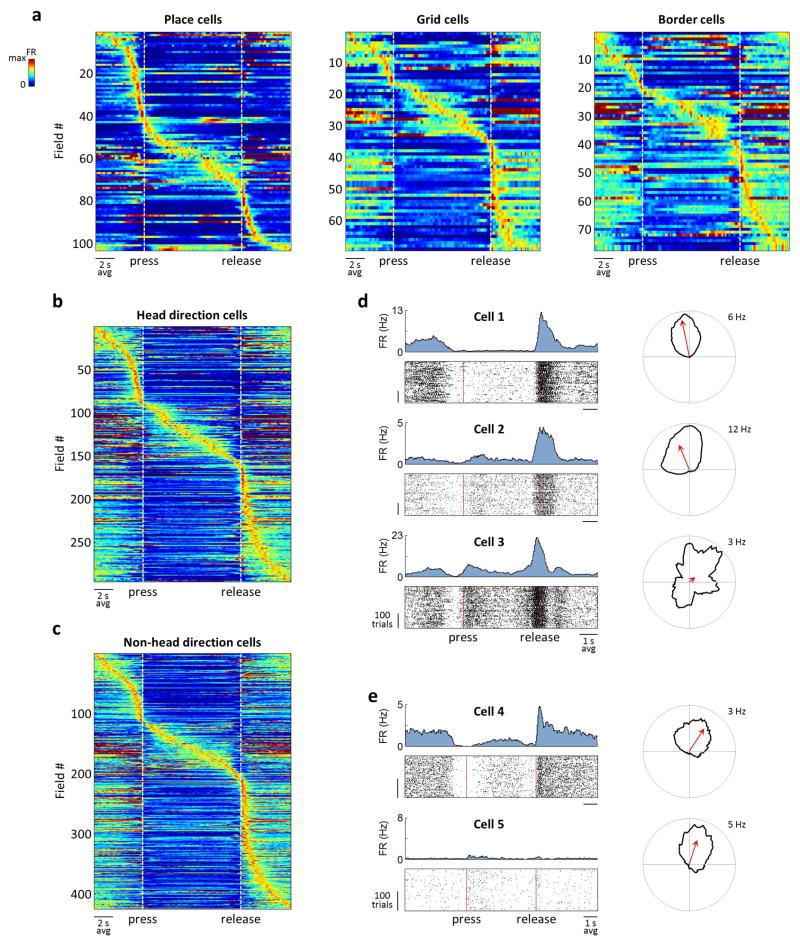
To test whether SMT-modulated neurons were also spatially selective, we recorded some cells during a “random foraging” task, in which rats searched a spatial environment for pellets of food. In CA1, we found a mixed representation of the two tasks: whereas some cells participated in only one of the two tasks, some produced firing fields in both. Of the 295 place cells, 25.1% were SMT-modulated (Fig. 4a). MEC grid cells also participated in the SMT (34.3% of 105 grid cells; Fig. 4b). Both place cells and grid cells were somewhat less likely to be SMT-modulated than other cells in their respective brain regions (34.7% of the 623 CA1 non-place cells and 46.5% of the 776 MEC non-grid cells; p<0.001 and p<0.02, χ2 test, respectively). However, the amount of SMT modulation across neurons had a very weak correlation to measures of both “placeness” and “gridness”23 (r2=0.0054 and r2=0.0053, respectively; Fig. 4c,d), suggesting nearly independent activity patterns in the two tasks. SMT firing fields of both place cells and grid cells were similar to those of other cells and spanned the entire task, including periods when the rat was immobile (Extended Data Fig. 10). Other spatial cell types, including border cells and head direction cells, were also SMT-modulated (e.g. cell 9 in Fig. 4b; Extended Data Fig. 10). Thus, SMT-modulated and spatially selective neurons were not distinct subclasses of the circuit, but represented a shared use of the same neural population between tasks.
Figure 4. SMT-modulated and spatially-modulated cells overlap.
a) Activity of CA1 cells in the SMT (left), plotted as in Fig. 3. Right: spatial firing rate maps for random foraging; the maximum firing rate is indicated. Cells 2 and 4 were silent in the SMT; cells 3 and 4 were silent during foraging. All firing rate scales are from 0 Hz to the nearest integer number of Hz above the maximum firing rate. FR: firing rate; p: press; r: release. b) Activity of MEC grid cells in the two tasks. Cells 5 and 6 are from module 1 in the same rat and are plotted on the same firing rate scale. Only cell 5 was active in the SMT. Cells 7 and 8 are from modules 2 and 3, respectively. Cell 9 is a border cell. c) Normalized information of all 918 CA1 cells during the SMT, as in Fig. 3, plotted against normalized spatial information – the mutual information between spikes and the location, divided by the average value from samples with shuffled spike timing. Points are colored and shaded according to whether the cell was a place cell and whether it was SMT-modulated. Information values in the two tasks are not expected to be similar due to different task structures. d) Normalized information of all 881 MEC cells during the SMT task plotted against the cells’ grid scores. Points are colored and shaded according to whether the cell was a grid cell and whether it was SMT-modulated. e) Cumulative histograms of the average field width for all 48 grid cells in module 1 and all 51 grid cells in modules 2/3. Groups were separated at 42 cm. Inset: Distribution of grid spacings across cells and a mixture of 3 Gaussians fit to the distribution. Peaks corresponding to modules 1–3 are numbered.
Grid cells occur in discrete “modules” with distinct spacings and widths of the firing fields24. SMT-modulated cells included grid cells from all modules detectable in our data (Fig. 4b). However, in modules with larger spacing, we observed a higher incidence of particularly wide SMT firing fields (e.g. cell 8 in Fig. 4b). The distributions of field widths were indeed different between modules 1 and 2/3 (0.78±0.02 s and 1.36±0.05 s, respectively; N=48 and 51 cells, median±s.e.m.; p<0.01, Wilcoxon rank-sum test; Fig. 4e). Thus, grid cells with wider fields in the spatial environment tended also to have wider fields in the SMT, suggesting shared neural mechanisms. One possibility is that the SMT firing patterns corresponded to 1-dimensional slices through a hexagonal lattice25; however, the small number of fields produced by grid cells in the SMT (typically 0–3) precluded this analysis.
Because the SMT evolves along a continuous axis (sound frequency), it is analogous to spatial navigation on a linear track. Our results show that it shares some key features of neural representation with this task. Just like location, the non-spatial dimension is represented in the hippocampal/entorhinal system by discrete firing fields that continuously tile the entire behavioral task. Several other properties are shared, including a tendency of MEC cells to produce multiple fields2, a clustering and tightening of fields at salient features of the task26,27, and a dependence of the firing on behavioral context28. Critically, spatial and non-spatial representations are produced by the same neuronal population, suggesting a common circuit mechanism for encoding fundamentally different kinds of information across tasks. Our results therefore suggest that the well-known spatial patterns in the hippocampal/entorhinal circuit may be a consequence of the continuous nature of the relevant task variables (e.g., location), rather than a primacy of physical space for this network9,10,18–21.
What is the purpose of these continuous representations? In the SMT, rats did not actually need to represent the structure of the entire acoustic space. They could, in fact, respond to a particular sound frequency – a strategy also sufficient in operant tasks that are known to be hippocampus-independent6. However, our observations lead to an intriguing conjecture that in more complex tasks (e.g. those containing memory-guided decision points), the hippocampal/entorhinal system might similarly represent arbitrary behavioral states. In this framework, task performance activates a sequence of neural activity, in which firing fields are elicited parametrically with progress through behavior. Neighboring and partially overlapping fields therefore represent the order and adjacency of behavioral states. This can be useful for linking events in episodic memory and for planning future actions18,29 (e.g. via simulated continuous neural sequences30). Spatially localized place and grid codes might therefore be a manifestation of a general circuit mechanism for encoding sequential relationships between behaviorally relevant events. This view suggests a role for these cell types in supporting not only spatial navigation, but cognitive processes in general.
Methods
Subjects
All animal procedures were approved by the Princeton University Institutional Animal Care and Use Committee and carried out in accordance with the National Institutes of Health standards. Subjects were adult male Long-Evans rats (Taconic). Training started at an age of ~10 weeks. Animals were placed on a water schedule in which supplemental water was provided after behavioral sessions, such that the total daily water intake was 5% of body weight.
Data were collected from 11 rats. In chronological order of their use, the first 2 were used for CA1 and MEC recordings in the SMT and random foraging, the next 3 were used for CA1 and MEC recordings in the SMT, random foraging, and passive playback experiments, the next 4 were used for MEC recordings only in the SMT and random foraging, and the final two were used for CA1 recordings in the passive playback + reward experiment. All data from all rats were included for analysis.
Apparatus for the sound modulation task
The apparatus was a modified rat operant conditioning chamber (30.5 cm L × 24.1 cm W × 29.2 cm H, Med Associates ENV-007CT) placed inside a custom-built sound isolation chamber. Two versions (1 and 2) of the apparatus were used: version 1 was used for 3 rats in the SMT experiment, while version 2 was used for the remaining 6 rats in the SMT and 2 additional rats in the passive playback experiments.
In both versions of the apparatus, rats operated a joystick (Mouser HTL4-112131AA12). In version 1, the lever arm of the joystick was extended to a total of 15 cm by attaching an aluminum rod (0.3 cm OD × 12 cm) coaxially to its existing handle. The joystick was mounted horizontally outside of the chamber, with 11 cm of the handle protruding into the chamber through a cutout in the center of the shorter wall. At rest, the handle was perpendicular to the wall of the chamber and was 4 cm above the floor. The cutout in the wall was a vertical groove (1.2 cm × 3.8 cm) that allowed the joystick arm to be deflected downward by up to 16 degrees. Deflection of the arm required applying a force of 0.019 N per degree to the tip of the handle. A lick-tube for reward delivery was located at the center of the opposite wall 6 cm above the floor and protruded 6 cm into the chamber. Rewards were delivered using a solenoid valve, and a blue LED was placed 2 cm above the lick-tube. A sound speaker (Med Associates ENV-224DM) was mounted on the wall directly above the joystick, and an infrared camera was used to monitor the behavior.
In version 1 of the apparatus, rats occasionally moved their heads while deflecting the joystick. To eliminate this possible spatial confound, the following modifications were made in version 2. A custom-made nosepoke was attached at the center of the same wall that contained the joystick handle (i.e., the center of the nosepoke was horizontally aligned with the joystick handle). The nosepoke was 2 cm wide and could be triggered by breaking an infrared beam (7 cm above the floor, 3 mm from the wall). The lever arm of the joystick was shortened to 13.5 cm, with 1.5 cm protruding into the chamber; thus, deflection of the arm required a force of 0.022 N per degree at the tip. The lick-tube and the LED were positioned closer to the joystick handle – on the same wall as the joystick, 8 cm to the left. The lick-tube was also shortened to 2.5 cm.
Sound modulation task
All behavioral paradigms were implemented using our software package, ViRMEn (Virtual Reality MATLAB Engine31, virmen.princeton.edu). Custom routines for ViRMEn were written to implement navigation in acoustic spaces and to synchronize the acquisition of behavioral and electrophysiological data. Software monitored the rat’s behavior and defined 4 types of events: 1) A “press” was defined as a downward deflection of the joystick exceeding 2 degrees from the horizontal. 2) A “release” was defined as a decrease in the amount of deflection to less than 1.5 degrees from the horizontal, lasting longer than 250 ms. 3) A “poke” was defined as a breaking of the infrared beam in the nosepoke, and 4) A “un-poke” was defined as a restoring of the infrared beam for longer than 1 s.
Rats initiated trials by pressing the joystick and poking. The poke had to either precede the press (without an un-poke in between) or follow the press by less than 250 ms (without a release in between). If a press was not followed by a poke within 250 ms, the trial was not initiated, and a new trial could only be started after releasing the joystick. Trials were terminated by releasing the joystick and un-poking. The un-poke could either follow the release (without a press in between) or precede the release by less than 250 ms. An un-poke that was not followed by a release within 250 ms was considered a premature termination of the trial; in this case, no reward was delivered, and a new trial could also only be started after releasing the joystick. Animals using version 1 of the apparatus, which lacked a nosepoke, initiated and terminated trials by pressing and releasing the joystick, respectively.
A sound was continuously played by the speaker during the trial. At the beginning of the trial, the sound was a 2 kHz pure tone, ~80 dB SPL. Whenever the joystick was deflected by more than 2 degrees from the horizontal, the frequency of the tone was increased using the following formula
| (Eqn. 1) |
Where fn is the sound frequency at time step n, θ is the amount of joystick deflection in degrees, Δt is the duration of the time step, and α is the traversal speed, chosen randomly from a uniform distribution at the beginning of each trial. The uniform distribution was chosen for each animal such that the range of trial durations was typically 6–12 s for version 1 of the apparatus and 4–8 s for version 2 of the apparatus. At each time step n+1, the speaker produced a logarithmic sweep of tones from fn to fn+1. Whenever the joystick deflection was less than 2 degrees, sound frequency was unchanged. The range of 15–22kHz was defined as the “target zone”. When frequency exceeded this range, white noise (80 dB SPL) was played instead of the pure tone to indicate overshooting of the target zone.
If the trial was terminated within the target zone, the LED above the lick-tube was turned on and a reward (25 μL of water) was delivered. The LED persisted for 2 s. If the trial was terminated outside of the target zone, no additional stimuli were delivered. In either case, and a new trial could be initiated at any following time. If the animal obtained a reward, the new trial used a new randomly selected value of the traversal speed α; otherwise the same traversal speed was repeated.
Passive playback experiments
Two passive playback experiments were performed – with and without a reward. For animals that did not receive a reward, passive playback was presented for 15 min immediately following the last SMT session of the day. During this time, the nosepoke, the joystick handle, and the lick-tube were covered with a plastic cover to prevent access. Sweeps of pure-tone sounds were then played with 3 s pauses between the sweeps. Each sweep was from 2 to 22 kHz, as in the SMT. The speed of traversal of the frequency range for each sweep was chosen from a uniform distribution to roughly match trial durations from preceding SMT sessions.
For the passive playback + reward experiment, we used separate rats that were never trained to operate the joystick and thus never learned an association between actions and changes to auditory stimuli. For these rats, the LED and the lick-tube were uncovered, but an insert outside of the chamber blocked the movement of the joystick handle. Passive playback was the same as above, but the sound sweep was immediately followed by a reward (25 μL) and an LED signal lasting 2 s.
Behavioral training
Behavioral shaping for the SMT required 5–6 weeks and consisted of 8 distinct stages. In stage 1, rats were trained to associate the LED with a reward. The LED was turned on and a reward was simultaneously delivered at random time intervals (exponentially distributed, τ=10 s). In stage 2 (version 2 of the apparatus only), rats were trained to poke in order to trigger the LED and reward delivery. In stage 3, a capacitive touch sensor (SparkFun MPR121) was attached to the joystick handle. Rats were additionally trained to touch the joystick handle. In stage 4, rats were trained to deflect the joystick by progressively larger amounts, until the final threshold used in the SMT was achieved.
In stage 5, sound was introduced. Initially, traversal speed of the frequency space was constant and very high, such that the joystick needed to be deflected for <500 ms in order to reach the target zone at 15 kHz. The target zone did not have a high bound, so the animal was not penalized for overshooting; however, if the frequencies exceeding 22 kHz were reached, the sound speaker produced a 22 kHz tone instead. During this stage, the traversal speed was gradually decreased, by 0.5% after each reward, until trials were ~8 s long. In some animals, the traversal speed did not change during training, but instead the starting frequency of the sound sweeps was gradually decreased from 14.9 kHz to 2 kHz. This was the longest stage of training, requiring ~3 weeks.
In stage 6, the high bound was introduced to the reward zone at 22 kHz. Initially, rats were allowed to overshoot the high bound by ~5 s without activating white noise and failing the trial, but this value was gradually decreased to 0 s. In stage 7, a second value of the traversal speed was introduced and gradually increased, such that trials using the first speed value were ~8 s long, while values using the second speed value were ~4 s long. Trials using the two speed values were randomly intermingled. Stage 8 was the full version of the task, in which the entire range of traversal speeds (between the first and the second value from stage 7) was used.
Random foraging task
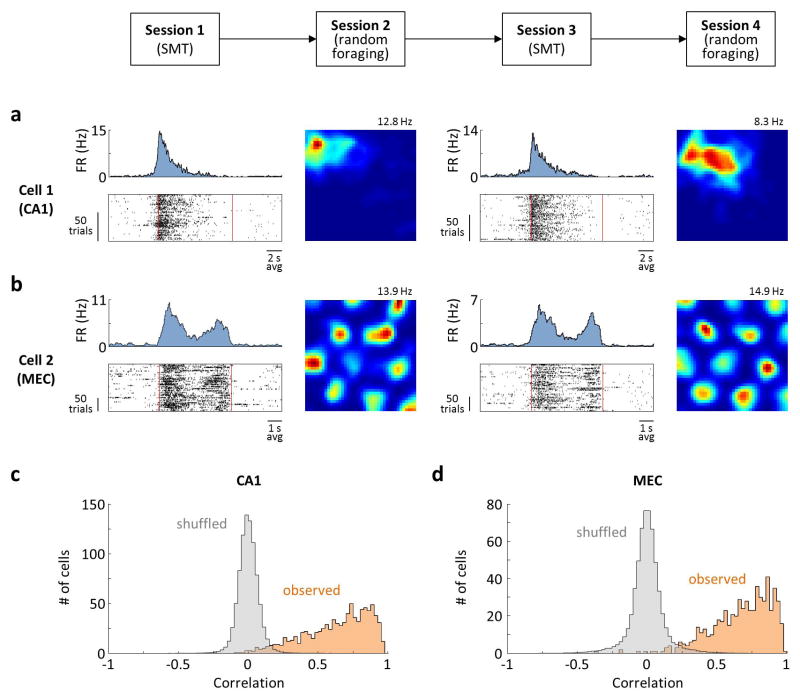
Random foraging experiments were performed in a square arena that was either 78 cm on the side, 61 cm high (for 6 rats used in random foraging) or 93 cm on the side, 61 cm high (for the remaining 3 rats). The walls and the floor of the arena were built using black plastic. A white cue card (28 cm W × 22 cm H) was placed in the center of one of the walls, with the bottom edge 35 cm above the floor. Rats searched for pieces of yogurt treats (~50 mg, eCOTRICION Yogies) that were thrown into the arena one at a time, roughly every 15 s. The arena was adjacent to the acoustic navigation chamber, allowing the animal to be moved between the two tasks without unplugging the recording headstage. In CA1, we often observed cells that had extremely low firing rates in one of the two tasks. To ensure that these cells were not actually lost during recording, we recorded rats on four interleaved sessions per day – two 30-min SMT sessions and two 15-min sessions in the random foraging task. Rats that only received MEC implants were recorded in a single 1-h SMT session and a 20-min random foraging session. The order of the sessions was varied across rats, depending on what appeared to be more motivating to each animal.
Once the animal was moved to the random foraging arena, a red and a green LED were plugged into the lateral edges of the recording headstage. An overhead video camera was used to record the locations of these LEDs. Thresholds were applied separately to the red and green channels of the videos, and the centers of mass of the pixels that passed the threshold were identified. A line segment connecting the red and green centers of mass was defined, and the animal’s location was defined as the midpoint of this line segment. The head direction was defined as the angle of a vector perpendicular to this line segment.
Electrophysiology
Tetrodes were constructed from twisted wires that were either PtIr (18 μm, California Fine Wire) or NiCr (25 μm, Sandvik). Tetrode tips were platinum-plated (for PtIr wire) or gold-plated (for NiCr wire) to reduce impedances to 150–250 kΩ at 1 kHz.
Microdrive assembly devices were custom-made and have been previously described 31. Each device contained 8 tetrodes that were independently movable using a manual screw/shuttle system adapted from 32. Tetrodes were directed into the brain using a cannula that consisted of 9 stainless steel tubes (0.014 in OD, 0.0065 in ID) soldered together into a 3×3 square grid and placed flush against the brain surface. One of the tubes was used for an immobile reference electrode (PtIr, 0.002 in bare, 0.004 coated in PFA, 1 mm total length in the brain, 300 μm of insulation stripped at the tip). A single device was used for either CA1 or MEC recordings; two separate devices were implanted for dual CA1/MEC recordings. One of the animals in the passive playback experiment received a dual implant into the left and right CA1.
Recordings were obtained using a previously described custom-built system 31 that consisted of small headstages connected by lightweight 9-wire cables to an interface board 1.2 m above the animal. One 32-channel headstage was plugged into each 8-tetrode microdrive assembly. The system filtered (5 Hz – 7.5 kHz), amplified (x1000), and time-division multiplexed (32:1) signals from the electrode wires using an Intan RHA2132 chip and custom-designed circuitry. The multiplexed signals were relayed through a 25-channel slip-ring commutator (Dragonfly) and digitized at 1 MHz (31250 Hz/channel) using a data acquisition board (National Instruments PCI-6133). Custom MATLAB software was used to record the signals and to provide a real-time display of spikes and local field potentials.
Surgery
Rats were anesthetized with 1–2% isoflurane in oxygen and placed in a stereotaxic apparatus. The cranium was exposed and cleaned, holes were drilled at 6–7 locations, and bone anchor screws (#0-80 × 3/32″) were screwed into each hole. A ground wire (5 mil Ag) was inserted between the bone and the dura through another hole. An antibiotic solution (enrofloxacin, 3.8 mg/ml in saline) was applied to the surface of the cranium. Craniotomies and duratomies were made above CA1, MEC, or both. A microdrive assembly was lowered to the surface of the brain and anchored to the screws with light-curing acrylic (Flow-It ALC flowable composite). Animals received injections of dexamethasone and buprenorphine after the surgery.
Recording procedures
For CA1, the center of the electrode-guiding cannula was at 3.5 mm posterior to Bregma, 2.5 mm lateral to the midline. For MEC, the cannula was implanted at a 10° tilt with electrode tips pointed in the anterior direction2. The center of the cannula was 4.5 mm lateral to the midline, and the posterior edge of the cannula was ~0.1 mm anterior to the transverse sinus. On the day of the surgery, tetrodes were advanced to a depth of 1 mm. On the days following recovery from surgery, CA1 tetrodes were advanced until sharp-wave ripples were observed, and their waveforms were indicative of locations ~50 μm dorsal of the pyramidal cell layer33; the tetrodes were then immediately retracted by half of the distance they were advanced. This procedure was repeated every 2–3 days until tetrodes tips were within an estimated 50–100 μm from the pyramidal cell layer. After this, tetrodes were advanced by 15–30 μm/day until large-amplitude putative pyramidal cells were observed. MEC tetrodes were advanced in steps of 60 μm/day until theta-modulated units were observed; then tetrodes were advanced by no more than 30 μm/day.
Histology
In some animals, small lesions to mark tetrode tip locations were made by passing anodal current (15 μA, 1 s) through one wire of each tetrode. All animals received an overdose of ketamine and xylazine and were perfused transcardially with saline followed by 4% formaldehyde. Brains were extracted, and sagittal sections (80 μm thick) were cut and stained with the NeuroTrace blue fluorescent Nissl stain. Locations of all tetrodes were identified by comparing relative locations of tracks in the brain with the locations of individual tetrode guide tubes within the microdrive assembly.
Data analysis
Behavioral analysis
Each trial was characterized by the duration from the press of the joystick to the release of the joystick and by the sound frequency at the moment of the release. Because joystick deflection increased sound frequency exponentially, we used a logarithmic scale and measured frequency in octaves relative to the starting frequency of 2 kHz. When animals were not engaged in the task, they still occasionally deflected the joystick – e.g. by stepping or leaning on it while exploring the chamber. We observed that most of the very brief trials resulted from such behavior; for analysis, we therefore excluded trials shorter than 3 s.
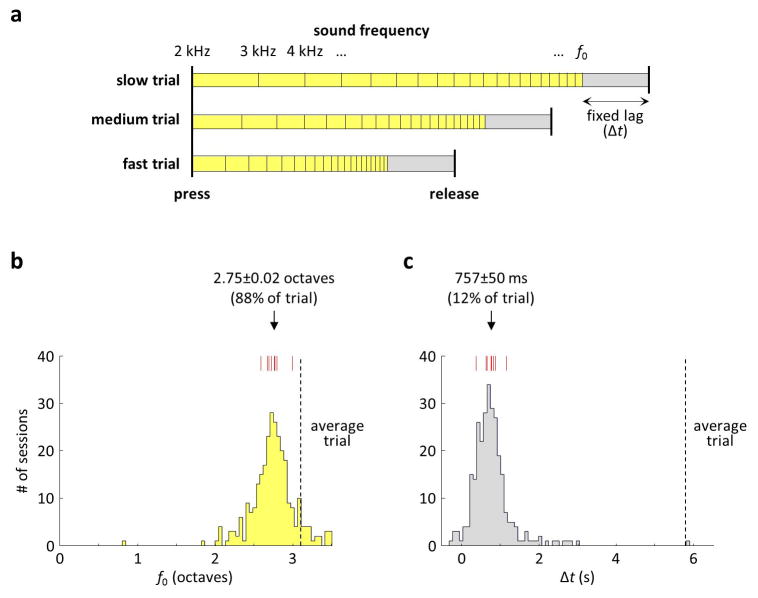
We implemented a behavioral model to determine whether animals preferentially used sound frequency, the amount of elapsed time, or a combination of the two in order to perform the SMT. The model consisted of two parameters: f0 (measured in octaves) and Δt (measured in seconds). We simulated each trial by assuming that the rat released the joystick at a time Δt relative to the occurrence of frequency f0. For trials in which the joystick was actually released before the occurrence of frequency f0, we used linear extrapolation to determine when f0 would occur if the frequency continued increasing with the average speed of the trial. We then measured the mean squared error between the joystick release times simulated by the model and the actual release times. Parameters f0 and Δt were optimized to minimize the average mean squared error across all trials of a given behavioral session.
Spike sorting
We filtered electrode signals using a Parks-McClennan optimal equiripple FIR filter (pass-band above 1 kHz, stop-band below 750 Hz). The sum of the four signals from each tetrode was computed, and thresholds of −3 and +3 standard deviations were applied to the summed data. Peaks in the data exceeding these thresholds but separated by more than 32 points were identified, and waveforms from 12 point before each peak to 19 points after each peak (1 ms total) were extracted. We computed the first three principal components of the extracted waveforms from each tetrode. Each waveform was then considered in a 7-multidimensional space defined by its projection onto the three principal components and its peak-to-peak amplitudes on the four tetrode wires. Clustering was performed manually in two dimensional projections of this space using custom-written software in MATLAB. If two clusters on the same tetrode on two subsequent recording sessions had a Mahallanobis distance of less than 20, they were considered to belong to the same unit. In this case, data from the two sessions were pooled. Neurons whose average firing rate in any recording session exceeded 5 Hz (in CA1) or 10 Hz (in MEC) were considered putative interneurons and excluded from analysis.
Firing in acoustic tasks
For the analysis of activity in the SMT, sessions were first broken into individual trials. The starts of the trials were defined as the midpoints between each press of the joystick (starting with the second one of the session) and the previous release. The ends of the trials were defined as the midpoints between each release of the joystick (ending with the one prior to the last one of the session) and the next press. Each trial therefore consisted of three time intervals: the pre-press interval, the interval between the press and the release, and the post-release interval. These intervals were different in duration across trials. For the following analyses, we therefore linearly time warped each of the three intervals to its median duration across trials. After warping, time in each of the three intervals was divided into an integer number of bins, such that the bins were on average as close as possible to 50 ms across trials. Firing rates and peri-stimulus time histograms (PSTHs) were calculated in these bins.
In CA1, some of the spikes were produced during sharp-wave ripple events (SWR). During spatial navigation experiments, such events are typically excluded from firing rate maps by rejecting low-velocity time points. In the SMT, we instead excluded SWRs by directly detecting them in the local field potential33, as follows. Raw voltage signals from the electrodes were downsampled by a factor of 10. Signals were then band-pass filtered in the 140-230 Hz range (stop-bands below 90 and above 280 Hz) using a Parks-McClennan optimal equiripple FIR filter. The power of the band-passed signal was computed, smoothed with a 100-point square window, and the median value was measured across the four wires of each tetrode. SWRs were detected as peaks in the resulting trace that exceeded 3 standard deviations, but were separated by more than 312 points (100 ms). Spikes that occurred within 100 ms from each SWR were excluded from the analysis. Exclusion of these spikes did not qualitatively change any of our results, but tended to increase the ratio of the in-field firing rates to the background.
To measure the strength of the firing rate modulation in the SMT, we computed the mutual information rate between spikes and the phase of the task34 using the following formula
| (Eqn. 2) |
where λi is the mean firing rate in the ith time bin, λ is the overall mean firing rate, and pi is the fraction of time spent in the ith bin (in this case, 1/number of bins). For each cell, we then generated 100 shuffled samples in which the spike times of each trial were shifted forward in time by a random amount. (The spikes that shifted past the end of the trial were wrapped around to the beginning.) The normalized information was defined as the ratio of the information rate in the real data to the average information rate across the 100 shuffled samples.
In many cells, the information rate was high compared to shuffled samples due to the presence of prominent firing fields. However, in some cells this occurred due to small differences in the background firing rate between periods of time during and outside of the sound presentation (e.g. cell 6 in Fig. 4b). We specifically wanted to characterize cells that showed strong peaks in the firing rate. Therefore, we computed a p value as the fraction of shuffled samples for which the peak firing rate in the PSTH was higher than in the PSTH of un-shuffled data. Firing rates of cells with p<0.01 were considered to be significantly modulated by the SMT.
To detect firing fields, we smoothed the PSTH of each cell with a 20-point square window. We then defined a threshold that was 2 standard deviations of the firing rate, but not below 0.2 Hz and not above 1 Hz. Any maximum of the PSTH that exceeded this threshold was considered to be a peak of a firing field. Two neighboring fields were then merged if 1) they were separated by less than 2 s, or if 2) all values of the firing rate between them exceeded 75% of the smaller peak firing rate of the two fields. To determine the full extent of each field, we subtracted the baseline from the PSTH, defined as the 5th percentile of the firing rate. The extent of the field was then considered to be the contiguous period containing the peak and exceeding 50% of the field’s peak firing rate in the baseline-subtracted PSTH.
Analyses of the passive playback experiments were the same as above, but the onsets and offsets of the sound sweeps were used as anchor points instead of the presses and the releases of the joystick.
Analysis of theta oscillations
To analyze theta oscillations, the voltage from each electrode was band-pass filtered with a Parks-McClennan optimal equiripple FIR filter (pass-band: 6–12 Hz, stop-bands below 1 Hz and above 17 Hz) and the median value across all wires of a tetrode was measured. Forward and reverse filtering was implemented (MATLAB command filtfilt) in order to produce no phase shift in the signal. The theta phase was determined by measuring the angle of the Hilbert transform of the filtered signal.
To quantify theta precession, we considered all firing fields that occurred between the press and the release of the joystick. For each field, we considered spike times, linearly warped between 0 and 1 (corresponding to the joystick press and the release, respectively) and the phases of theta at the spike times (measured between 0° and 360°). Values of theta phase were then circularly shifted in 1° increments, with values exceeding 360° wrapping back to 0°. For each shift from 1 to 360°, linear regression was fit to the relationship between theta phase and the warped time. The shift for which this linear regression had the smallest mean squared error was chosen, and the slope of the theta precession was determined from the linear regression at that shift.
We found that the frequency of the theta oscillations was stable for the first several seconds of a behavioral trial, but tended to increase near the end of the trial in some rats. To quantify theta frequency, we therefore only considered the first 3 s of each trial. Frequency was determined by locating the peak in the multi-taper power spectral density estimate (MATLAB command pmtm with the time-bandwidth product of 4) between 6 and 12 Hz.
Alignment to task events
We implemented a model to measure how well the activity of a given cell aligned to the press of the joystick, to the release of the joystick, and to sound frequency. We considered only the time period between the press and the release of the joystick. First, all trials longer than 3 s were sorted by duration and grouped into five equal-sized “groups”, from the fastest to the slowest trials. (If the number of trials was not divisible by 5, some of the fastest groups contained one extra trial). For each group i from 1 to 5, we defined di as the average duration of trials in that group. We then determined the number of bins Ni as the duration of the fastest trial in the ith group divided by 50 ms and rounded down to the nearest integer. Each trial in the ith group was binned into Ni bins, the average firing rate was computed in each bin, and a PSTH was computed by averaging the firing rates across all trials in the group and smoothing with a 20-point square window. Thus, the five PSTHs contained the firing rates Fik, where i is the group number and k is the bin number from 1 to Ni.
Cells could have multiple fields during the sound presentation period, and different fields occasionally appeared to align differently to task events. We therefore performed analysis separately for each field. We defined the period at which the firing rate was above 20% of the maximum firing rate within a firing field and set firing rates outside of this period to 0.
On average, the center of the kth bin in the ith group was at a certain time relative to the press of the lever; we defined this time as . It could be computed as . The center of this bin relative to the release of the lever could be computed as . We also defined fik as the average frequency (on a logarithmic scale) of all sounds that were played during the time periods confined by the bin. Finally, we normalized all of these variables to a range from 0–1 as follows. For , we determined the smallest and the largest values across all bins and PSTHs, and . We then computed the normalized values . The same procedure was repeated to compute and f̂ik.
Next, we defined model parameters αpress, αrelease and αfrequency and defined a parametric variable βik for each kth bin in the ith PSTH:
| (Eqn. 3) |
Each ith PSTH could now be described by the β values of all bins and the corresponding firing rates: (βik, Fik) for all k from 1 to Ni. This parametric variable has the feature that the ratios of the three α coefficients determine the extent to which its value scales with the three real variables , and f̂ik.
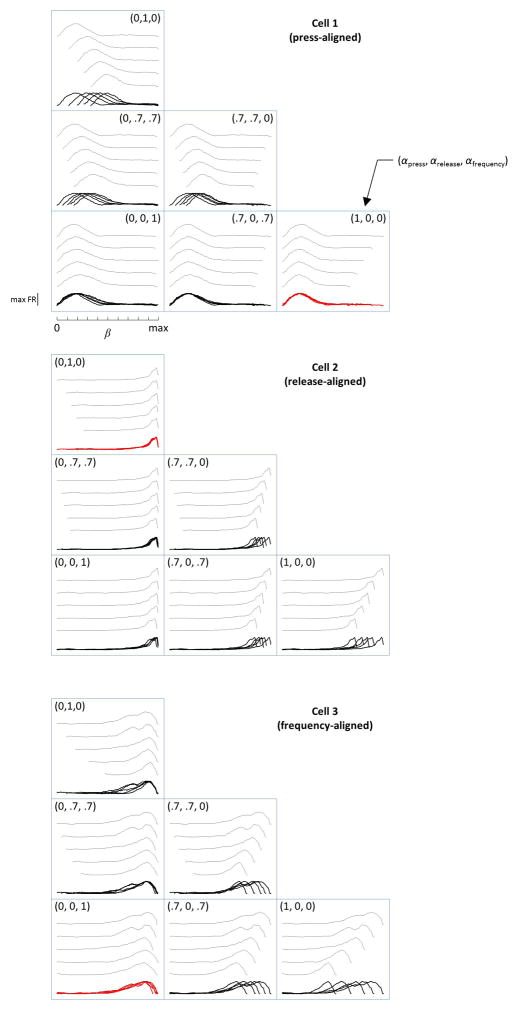
We next determined the set of parameters (αpress, αrelease, αfrequency) for which the five PSTHs were maximally correlated to one another. For each pair of PSTHs i and j, we first determined the range of β values on which these two PSTHs overlapped. This range was from max(βi1, βj1) to min(βiNi, βjNj). We defined 50 values of β that were evenly spaced between these two limits of the range. We then used Fourier interpolation (MATLAB interpft) to compute each of the two PSTHs at these 50 values of β and computed the cross-correlation between the two sets of 50 values. This procedure was repeated for each of the 10 pairs of PSTHS, and the values of cross-correlation were averaged across all pairs. We asked at which values of (αpress, αrelease, αfrequency) the average cross-correlation value was maximal. Since the value of cross-correlation depended only on the ratios of the α parameters, not their magnitudes, we constrained the three parameters to the unit sphere. We then used MATLAB algorithms to optimize over points on the unit sphere. Examples of how the parameterized PSTHs varied across different values of (αpress, αrelease, αfrequency) are shown in Extended Data Fig. 7.
Each field was classified as a press-aligned, release-aligned, or frequency aligned field by determining whether the 3D space of model parameters, (αpress, αrelease, αfrequency) was closest to (1,0,0), (0,1,0) or (0,0,1), respectively. For each field, we also estimated the uncertainty of the model parameters by performing bootstrap analysis on the individual trials using 100 bootstrapped samples. Fields for which more than one of the model parameters (αpress, αrelease, or αfrequency) was significantly different from 0 according to the bootstrap analysis were considered to show mixed representation of task parameters.
Firing during random foraging
For the analysis of the random foraging task, only time points with the instantaneous speed exceeding 5 cm/s were used. Animal’s location values were sorted into a 40×40 grid of bins. The number of spikes and the amount of time spent in each bin (occupancy) were calculated, and both values were smoothed with a 7×7 point Hamming filter. The firing rate in each bin was then defined as the ratio of the smoothed number of spikes to the smoothed occupancy. For each cell, we also generated 100 shuffled samples, in which the spikes were shifted along the trajectory of the animal by a random amount between 20 s and the duration of the recording session minus 20 s.
To detect place cells, we calculated “spatial information”34 – the mutual information rate between spikes and location – using the same formula as above (Eqn. 2), but using the 1600 spatial bins instead of time bins. Place cells were defined as cells for which the information rate exceeded 99% of the values for the shuffled samples.
To detect grid cells, we computed the grid score23, using the exact procedure described in31. The grid score measured the spatial correlation of a cell’s rate map to its own rotation at 60° and 120° and compared it to the correlation at 30°, 90°, and 150° rotations. Firing rate maps with symmetry that was specific to 60° had high grid scores. We measured the 95th percentile of the grid scored across all shuffled samples from all the MEC cells we recorded. In our dataset, this value was 0.46. Cells whose grid score exceeded this value were considered grid cells. Grid spacing was determined by computing the firing rate autocorrelation, selecting the 6 peaks in the autocorrelation closest to the peak at (0,0) and measuring their average distance from (0,0). We detected fewer grid cells in the smaller environment that we used than in the larger one. This is consistent with previous studies (e.g.35) and might potentially be due to an insufficient number of fields for reliable grid detection or to boundary influences on the firing of grid cells36,37. We therefore verified all comparisons of grid and non-grid cells on the subset of cells that were recorded in the larger environment.
To detect border cells, we used the border score, described in5. This score captured cells whose activity was selectively adjacent to one or more walls of the environment. Border cells were defined as cells whose border score and spatial information were both above the 99th percentile of the corresponding values measured on the shuffled samples.
To detect head direction cells, we used the exact procedure described in31. Briefly, we first computed the directional stability index3,38 by measuring the correlation between head direction tuning curves on two halves of the recording session. We then measured the directional selectivity38 as the length of the vector average of the tuning curve in polar coordinates. Head direction cells were defined as cells whose directional stability and selectivity were both above the 99th percentile of the corresponding values measured on the shuffled samples.
Data availability statement
The datasets generated during and/or analyzed during the current study are available from the corresponding author on reasonable request.
Extended Data
Extended Data Figure 1. Behavioral model.
a) Model that tests whether joystick releases depended on sound frequency, the amount of elapsed time, or a combination of the two. Joystick release times are predicted at a fixed time lag (Δt) relative to the occurrence of a fixed sound frequency (f0). Schematic shows three trials that have different speeds of frequency traversal. Frequency f0 occurs at different times relative to the press of the joystick across these trials. However, the time lag is constant. b) Model fits of the frequency component f0 across all 189 behavioral sessions in 9 rats. Red marks: median values for each of the rats. This frequency component accounted for most of the trial; indicated number is the median ± s.e.m. across rats. c) Model fits of the time lag component Δt across all behavioral sessions. This time lag component accounted for a small fraction of the trial; the lag might be largely explained by the expected reaction time (e.g., 100–200 ms in pure-tone auditory discrimination tasks Jaramillo and Zador 2011, Nature Neuroscience) and the mechanics of the joystick (300–400 ms). In other words, the behavior was consistent with the rats responding to a frequency of ~13.5 kHz (just prior to start of the target zone at 15 kHz), resulting in a detectable release of the joystick ~750 ms later.
Extended Data Figure 2. Histological verification of tetrode positions.
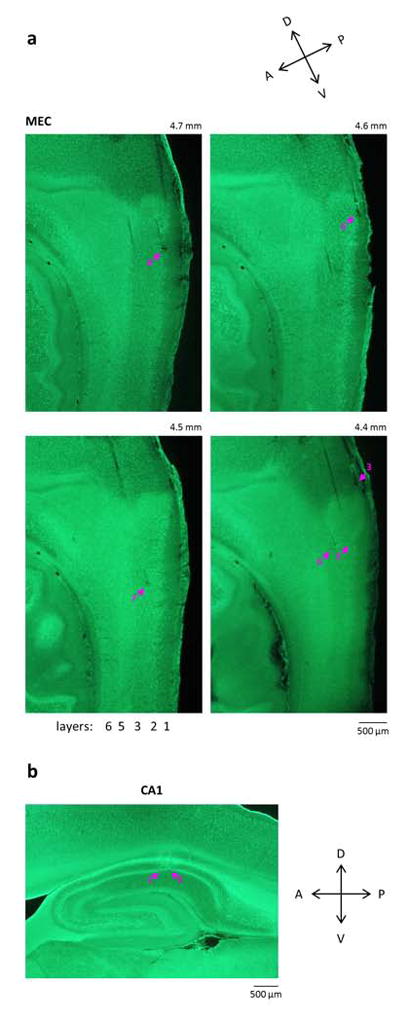
a) Representative fluorescent Nissl-stained parasagittal sections of MEC from one animal, ordered from the lateral-most to the medial-most section; the approximate mediolateral position of each section is indicated. Arrows indicate tetrode tip locations. Five of the shown tetrodes (with the exception of 3) had parts of their tracks in layers 2 and/or 3. Task-modulated cells in the SMT and grid cells during random foraging were found on all of these tetrodes. b) Representative parasagittal section of the hippocampus, showing two tetrodes in the CA1 pyramidal cell layer. Task-modulated cells during the passive playback + reward task were found on both of these tetrodes.
Extended Data Figure 3. Stability of firing.
a) Activity of a CA1 place cell on interleaved SMT and random foraging sessions. Data are plotted as in Fig. 4. Sessions immediately followed one another. Sessions 1 and 3 were 30 min long each, while sessions 2 and 4 were 15 min long each. b) Activity on an MEC grid cell, plotted as in (a). Sessions 1 and 3 were 1 h long each, while sessions 2 and 4 were 20 min long each. Session 2 and 4 immediately followed sessions 1 and 3, respectively. The starts of sessions 1 and 3 were separated by 24 h. c) Summary of the stability across all 882 SMT-modulated CA1 cells. For each cell, the Pearson correlation is measured between the PSTHs from the first halves of the SMT sessions and the second halves of the sessions. Orange: distribution of correlation values across cells. Gray: distribution of correlation values computed after shuffling spike times, averaged across 100 shuffles. d) Summary of the data from 597 MEC cells, plotted as in (c). In CA1 and MEC, 95.7% and 97.2% of the cells has higher correlation values than in the shuffled data (p<0.01), respectively.
Extended Data Figure 4. Analysis of theta modulation.
a) Examples of power spectral density (PSD) plots from two CA1 cells, showing a prominent theta oscillation. Black trace: median across trials. Shaded area: ± estimated s.e.m. across trials. Position of the peak in the median PSD is indicated. b) Distribution of theta frequencies across all 56496 trials in 5 rats with CA1 recordings. Red marks: median values for each of the rats. c) Phases of theta at which spikes were fired by the same neurons as in (a), showing theta phase precession. Black dots: individual spikes plotted in time (linearly warped between the press and the release of the joystick) and theta phase. Each spike is plotted twice with a 2π phase offset. Red line: linear regression fit to the data. d) Slopes of the regression fits, quantified in (c), for all 138 CA1 cells that had a significant correlation (p<0.01) between theta phase and warped time. Negative slope indicates forward phase precession, as is typically observed during spatial navigation. e) Frequency of theta oscillations quantified across trials that had different average “speeds” of sound frequency traversal in the SMT. Symbols: mean ± s.e.m. across rats. Red line: linear regression fit; the slope of the fit was not significantly different from 0 (p = 0.70). Unlike in spatial navigation, theta frequency did not correlate to speed; this may imply that the relationship between theta and speed during navigation is dependent on locomotion-related signals.
Extended Data Figure 5. Statistics of firing fields in the SMT.
a) Number of firing fields per cell for all 2208 CA1 cells. Error bars: 95% multinomial confidence intervals. The count includes fields before joystick press and after joystick release. However, MEC cells did occasionally have more than one field even during sound presentation (e.g. cell 5 in Fig. 4b). b) Distribution of all 1252 CA1 firing fields throughout the SMT. Each field is assigned a time according to the time of occurrence of it maximum firing rate. Time is linearly warped between the press and the release of the joystick. c) Field width as a function of field time within the task. Fields were sorted by their time in the task, and a rolling window of 100 fields was applied. The average field time within the task and the average field width were measured in this window (black trace). Blue band: s.e.m. of field width within the rolling window. d) Field height (peak firing rate) as a function of field time within the task. Data are plotted as in (c). Fields were concentrated near the press and the release of the joystick and were narrower during these time. (e–h) Statistics in MEC for 943 fields in 1164 cells, plotted as in (a–d). MEC tended to have more fields/cell than CA1, but otherwise had similar statistics. A tightening of firing fields in the vicinity of joystick presses and releases may be due to a higher density of available sensory cues during these events. Alternatively, field tightening may result from the stronger salience of these events compared to the rest of the task.
Extended Data Figure 6. CA1 and MEC cells form sequences of activity along the sound frequency axis.
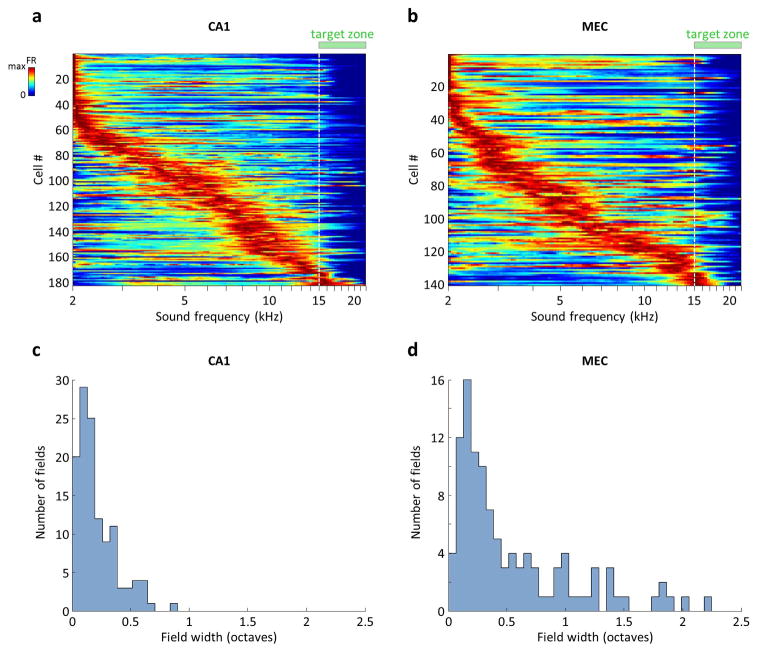
a) Firing rates of all 183 CA1 cells with at least one firing field in the SMT that was confined to the sound presentation period (between the press and the release of the joystick). Each row corresponds to one cell and is normalized by the maximum firing rate during the sound presentation period. Rows are sorted according to the frequency at which the maximum firing rate occurred. Each trial was binned into 150 frequency bins, which could vary in duration both within a trial and across trials. The firing rate was calculated separately in each bin using that bin’s duration, the firing rates were averaged across trials and smoothed with a 3-point square window. Note that fields in the SMT did not progressively broaden during the delay period, as they typically do in time cells; this may be due to the fact that an informative sensory variable (sound frequency) was always available to the animal, preventing a drift in the neural code. b) Firing rates of 141 MEC cells, calculated and plotted as in (a). c) Distribution of CA1 firing field widths, only for those 122 cells that were identified as “frequency-aligned” by the electrophysiology model (Extended Data Fig. 8). Note that the entire trial was on average 3.1 octaves. d) Distribution of 109 MEC firing field widths, plotted as in (c). Note that the longer tail compared to the CA1 data is partially due to grid cells from modules with wide spacing (Fig. 4e).
Extended Data Figure 7. Model for characterizing the alignment of neural activity to different task events in the SMT.
Extended Data Figure 8. Activity aligns to different task features in the SMT.
a) Traces: PSTHs across trials, sorted by duration into 5 groups. Each PSTH is normalized to its maximum. Red dots: 30% of maximum. Black lines: values of joystick press-aligned time tpress (cell 1), joystick release-aligned time trelease (cell 2) or sound frequency f (cell 3) that best fit the red symbols. These fits are for illustration purposes; the actual model maximized the cross-correlation of PSTHs by aligning them to a linear combination of tpress, trelease, and f. Cells shown are the same as in Extended Data Fig. 7. b) Fits of the model to all firing fields produced CA1 neurons. Axes are coefficients indicating the relative contribution of tpress, trelease, and f to the optimal alignment of PSTHs. c) Contour plot of the density of points in (b), illustrating 3 clusters. d) Distribution of fields belonging to each of the 3 clusters in (c) throughout the task. Time is linearly warped between the press and the release of the joystick. Error bars: 95% multinomial confidence intervals. Across all 411 fields from 341 recorded CA1 neurons with a peak of a firing field occurring during the sound presentation period, press-aligned, release-aligned, and frequency-aligned fields accounted for 26%, 23% and 51% of the population, respectively. (e–f) Same plots as in (b–d), but for 213 firing fields produced by 186 MEC neurons. In MEC, there was a larger fraction of frequency-aligned fields (17%, 20% and 63% for the three types; p<0.01 χ2 test for comparison to CA1). The three clusters in were not perfectly separated; in fact, some firing fields had significantly non-zero regression coefficients for more than one task parameter: 14% in CA1 and 21% in MEC (p<0.01, bootstrap analysis).
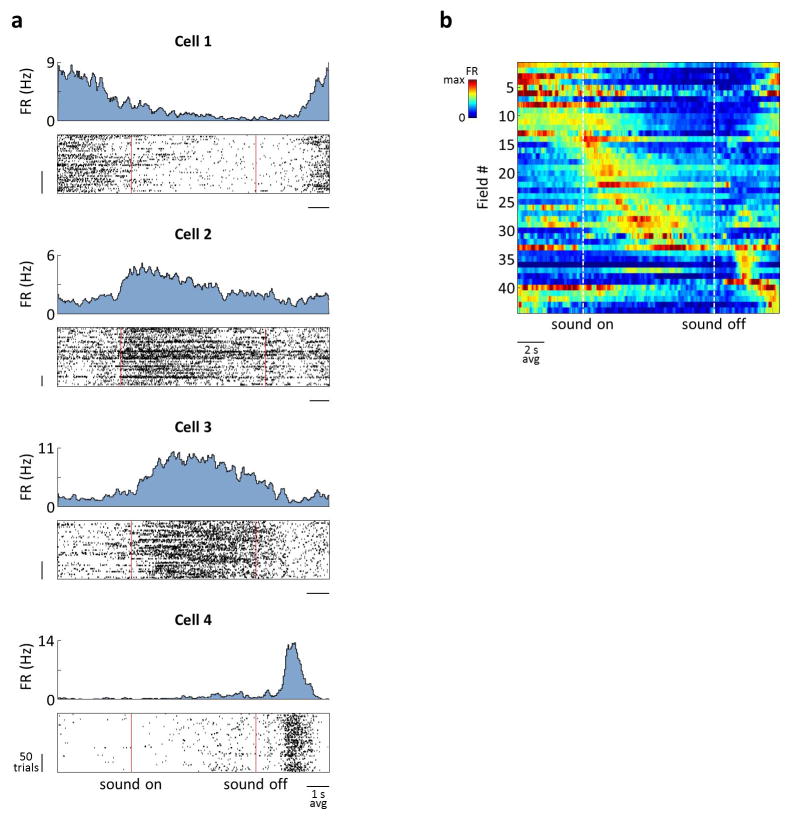
Extended Data Figure 9. Activity of CA1 neurons in the passive playback experiments in which rats received a reward at the end of the sound sweep (PPR task).
a) Four examples of neurons in the PPR task, plotted as in Fig. 3. Firing fields spanned the entire behavioral task, but were wider than in the SMT, except possibly near the reward (e.g. cell 4). b) Activity of all 44 cells whose firing rates were significantly modulated in the PPR task, plotted as in Fig. 2. Of the 21 cells that had firing fields during sound presentation, the fields of 14 were better aligned to sound frequency than to other task parameters.
Extended Data Figure 10. Overlap between spatial cell types and the SMT-modulated population.
a) Activity of spatial cell types that were also SMT-modulated. All plots are as in Fig. 2. (b–e) Head direction (HD) cells overlap with SMT-modulated neurons, but do not fully account for firing rate modulations in the SMT. This analysis was performed to account for the possibility that some SMT firing was due to subtle changes in HD in the nosepoke or between the nosepoke and the lick-tube. a) Activity of all HD cells that were also modulated in the SMT. b) Activity of all non-HD cells that were also modulated in the SMT. c) Activity of three MEC cells in one rat. Cells 1 and 2 were simultaneously recorded. Left: Activity in the SMT, plotted as in Fig. 3. Right: Firing rate as a function of HD during random foraging, plotted in polar coordinates. Each firing rate is scaled to its maximum, which is indicated. Arrow: vector average of the HD tuning curve. All three cells have a firing field at the release of the joystick. However, although cells 1 and 2 have similar HD selectivity, cell 3 is not a HD cell, suggesting that the firing field cannot be explained by HD selectivity. d) Activity of two simultaneously recorded MEC cells, plotted as in (c). Although the cells have similar HD selectivity, they have highly dissimilar firing in the SMT. Total number of cells recorded in both tasks was 918 in CA1 and 881 in MEC, including 290 and 379 SMT-modulated cells, respectively. In CA1, there were 295 place cells, and in MEC there were 105 grid cells, 68 border cells, and 321 HD cells. Overlaps of these cell types with SMT-modulated cells contained 74, 36, 42, and 163 cells, producing 104, 69, 78, and 295 firing fields, respectively.
Acknowledgments
We thank A. Akrami, C. Constantinople, C. Domnisoru, J. Gauthier, A. Miri, K. Rajan, D. Rich, and B. Scott for suggestions, as well as S. Lowe for assistance with machining. The illustrations in Fig. 1a are by J. Kuhl. This work was supported by the Simons Foundation, NIH Grant 1K99NS093071 (D.A.) and the US Federal Work-Study program (R.N.).
Footnotes
Author contributions
D.A. and. D.W.T designed the experiments. D.A. and R.N. performed the experiments and analyzed the data. D.A., R.N., and D.W.T. wrote the paper.
The authors declare no competing financial interests.
References
- 1.O’Keefe J, Dostrovsky J. The hippocampus as a spatial map. Preliminary evidence from unit activity in the freely-moving rat. Brain research. 1971;34:171–175. doi: 10.1016/0006-8993(71)90358-1. [DOI] [PubMed] [Google Scholar]
- 2.Hafting T, Fyhn M, Molden S, Moser MB, Moser EI. Microstructure of a spatial map in the entorhinal cortex. Nature. 2005;436:801–806. doi: 10.1038/nature03721. [DOI] [PubMed] [Google Scholar]
- 3.Sargolini F, et al. Conjunctive representation of position, direction, and velocity in entorhinal cortex. Science. 2006;312:758–762. doi: 10.1126/science.1125572. [DOI] [PubMed] [Google Scholar]
- 4.Kropff E, Carmichael JE, Moser MB, Moser EI. Speed cells in the medial entorhinal cortex. Nature. 2015;523:419–424. doi: 10.1038/nature14622. [DOI] [PubMed] [Google Scholar]
- 5.Solstad T, Boccara CN, Kropff E, Moser MB, Moser EI. Representation of geometric borders in the entorhinal cortex. Science. 2008;322:1865–1868. doi: 10.1126/science.1166466. [DOI] [PubMed] [Google Scholar]
- 6.Squire LR. Memory and the hippocampus: a synthesis from findings with rats, monkeys, and humans. Psychological review. 1992;99:195–231. doi: 10.1037/0033-295x.99.2.195. [DOI] [PubMed] [Google Scholar]
- 7.Buzsaki G, Moser EI. Memory, navigation and theta rhythm in the hippocampal-entorhinal system. Nature neuroscience. 2013;16:130–138. doi: 10.1038/nn.3304. [DOI] [PMC free article] [PubMed] [Google Scholar]
- 8.Schiller D, et al. Memory and Space: Towards an Understanding of the Cognitive Map. The Journal of neuroscience: the official journal of the Society for Neuroscience. 2015;35:13904–13911. doi: 10.1523/JNEUROSCI.2618-15.2015. [DOI] [PMC free article] [PubMed] [Google Scholar]
- 9.Tavares RM, et al. A Map for Social Navigation in the Human Brain. Neuron. 2015;87:231–243. doi: 10.1016/j.neuron.2015.06.011. [DOI] [PMC free article] [PubMed] [Google Scholar]
- 10.Constantinescu AO, O’Reilly JX, Behrens TE. Organizing conceptual knowledge in humans with a gridlike code. Science. 2016;352:1464–1468. doi: 10.1126/science.aaf0941. [DOI] [PMC free article] [PubMed] [Google Scholar]
- 11.O’Keefe J, Nadel L. The hippocampus as a cognitive map. Clarendon Press; 1978. [Google Scholar]
- 12.Muller RU, Kubie JL. The effects of changes in the environment on the spatial firing of hippocampal complex-spike cells. The Journal of neuroscience: the official journal of the Society for Neuroscience. 1987;7:1951–1968. doi: 10.1523/JNEUROSCI.07-07-01951.1987. [DOI] [PMC free article] [PubMed] [Google Scholar]
- 13.Colgin LL, Moser EI, Moser MB. Understanding memory through hippocampal remapping. Trends in neurosciences. 2008;31:469–477. doi: 10.1016/j.tins.2008.06.008. [DOI] [PubMed] [Google Scholar]
- 14.Sakurai Y. Coding of auditory temporal and pitch information by hippocampal individual cells and cell assemblies in the rat. Neuroscience. 2002;115:1153–1163. doi: 10.1016/s0306-4522(02)00509-2. [DOI] [PubMed] [Google Scholar]
- 15.Eichenbaum H, Kuperstein M, Fagan A, Nagode J. Cue-sampling and goal-approach correlates of hippocampal unit activity in rats performing an odor-discrimination task. The Journal of neuroscience: the official journal of the Society for Neuroscience. 1987;7:716–732. doi: 10.1523/JNEUROSCI.07-03-00716.1987. [DOI] [PMC free article] [PubMed] [Google Scholar]
- 16.Fried I, MacDonald KA, Wilson CL. Single neuron activity in human hippocampus and amygdala during recognition of faces and objects. Neuron. 1997;18:753–765. doi: 10.1016/s0896-6273(00)80315-3. [DOI] [PubMed] [Google Scholar]
- 17.Killian NJ, Jutras MJ, Buffalo EA. A map of visual space in the primate entorhinal cortex. Nature. 2012;491:761–764. doi: 10.1038/nature11587. [DOI] [PMC free article] [PubMed] [Google Scholar]
- 18.Manns JR, Howard MW, Eichenbaum H. Gradual changes in hippocampal activity support remembering the order of events. Neuron. 2007;56:530–540. doi: 10.1016/j.neuron.2007.08.017. [DOI] [PMC free article] [PubMed] [Google Scholar]
- 19.Pastalkova E, Itskov V, Amarasingham A, Buzsaki G. Internally generated cell assembly sequences in the rat hippocampus. Science. 2008;321:1322–1327. doi: 10.1126/science.1159775. [DOI] [PMC free article] [PubMed] [Google Scholar]
- 20.MacDonald CJ, Carrow S, Place R, Eichenbaum H. Distinct hippocampal time cell sequences represent odor memories in immobilized rats. The Journal of neuroscience: the official journal of the Society for Neuroscience. 2013;33:14607–14616. doi: 10.1523/JNEUROSCI.1537-13.2013. [DOI] [PMC free article] [PubMed] [Google Scholar]
- 21.Kraus BJ, et al. During Running in Place, Grid Cells Integrate Elapsed Time and Distance Run. Neuron. 2015;88:578–589. doi: 10.1016/j.neuron.2015.09.031. [DOI] [PMC free article] [PubMed] [Google Scholar]
- 22.Kelly JB, Masterton B. Auditory sensitivity of the albino rat. Journal of comparative and physiological psychology. 1977;91:930–936. doi: 10.1037/h0077356. [DOI] [PubMed] [Google Scholar]
- 23.Langston RF, et al. Development of the spatial representation system in the rat. Science. 2010;328:1576–1580. doi: 10.1126/science.1188210. [DOI] [PubMed] [Google Scholar]
- 24.Stensola H, et al. The entorhinal grid map is discretized. Nature. 2012;492:72–78. doi: 10.1038/nature11649. [DOI] [PubMed] [Google Scholar]
- 25.Yoon K, Lewallen S, Kinkhabwala AA, Tank DW, Fiete IR. Grid Cell Responses in 1D Environments Assessed as Slices through a 2D Lattice. Neuron. 2016;89:1086–1099. doi: 10.1016/j.neuron.2016.01.039. [DOI] [PMC free article] [PubMed] [Google Scholar]
- 26.Hetherington PA, Shapiro ML. Hippocampal place fields are altered by the removal of single visual cues in a distance-dependent manner. Behavioral neuroscience. 1997;111:20–34. doi: 10.1037//0735-7044.111.1.20. [DOI] [PubMed] [Google Scholar]
- 27.Hardcastle K, Ganguli S, Giocomo LM. Environmental boundaries as an error correction mechanism for grid cells. Neuron. 2015;86:827–839. doi: 10.1016/j.neuron.2015.03.039. [DOI] [PubMed] [Google Scholar]
- 28.Terrazas A, et al. Self-motion and the hippocampal spatial metric. The Journal of neuroscience: the official journal of the Society for Neuroscience. 2005;25:8085–8096. doi: 10.1523/JNEUROSCI.0693-05.2005. [DOI] [PMC free article] [PubMed] [Google Scholar]
- 29.Hopfield JJ. Neurodynamics of mental exploration. Proceedings of the National Academy of Sciences of the United States of America. 2010;107:1648–1653. doi: 10.1073/pnas.0913991107. [DOI] [PMC free article] [PubMed] [Google Scholar]
- 30.Pfeiffer BE, Foster DJ. Hippocampal place-cell sequences depict future paths to remembered goals. Nature. 2013;497:74–79. doi: 10.1038/nature12112. [DOI] [PMC free article] [PubMed] [Google Scholar]
- 31.Aronov D, Tank DW. Engagement of neural circuits underlying 2D spatial navigation in a rodent virtual reality system. Neuron. 2014;84:442–456. doi: 10.1016/j.neuron.2014.08.042. [DOI] [PMC free article] [PubMed] [Google Scholar]
- 32.Kloosterman F, et al. Micro-drive array for chronic in vivo recording: drive fabrication. Journal of visualized experiments: JoVE. 2009 doi: 10.3791/1094. [DOI] [PMC free article] [PubMed] [Google Scholar]
- 33.Mizuseki K, Diba K, Pastalkova E, Buzsaki G. Hippocampal CA1 pyramidal cells form functionally distinct sublayers. Nature neuroscience. 2011;14:1174–1181. doi: 10.1038/nn.2894. [DOI] [PMC free article] [PubMed] [Google Scholar]
- 34.Skaggs WE, McNaughton BL, Gothard KM, Markus EJ. In: Advances in neural information processing. Hanson SJ, Cowan JD, Giles CL, editors. Vol. 5. Morgan Kaufmann; 1993. pp. 1030–1037. [Google Scholar]
- 35.Hargreaves EL, Rao G, Lee I, Knierim JJ. Major dissociation between medial and lateral entorhinal input to dorsal hippocampus. Science. 2005;308:1792–1794. doi: 10.1126/science.1110449. [DOI] [PubMed] [Google Scholar]
- 36.Krupic J, Bauza M, Burton S, Barry C, O’Keefe J. Grid cell symmetry is shaped by environmental geometry. Nature. 2015;518:232–235. doi: 10.1038/nature14153. [DOI] [PMC free article] [PubMed] [Google Scholar]
- 37.Stensola T, Stensola H, Moser MB, Moser EI. Shearing-induced asymmetry in entorhinal grid cells. Nature. 2015;518:207–212. doi: 10.1038/nature14151. [DOI] [PubMed] [Google Scholar]
- 38.Giocomo LM, et al. Topography of head direction cells in medial entorhinal cortex. Current biology: CB. 2014;24:252–262. doi: 10.1016/j.cub.2013.12.002. [DOI] [PubMed] [Google Scholar]
Associated Data
This section collects any data citations, data availability statements, or supplementary materials included in this article.
Data Availability Statement
The datasets generated during and/or analyzed during the current study are available from the corresponding author on reasonable request.


