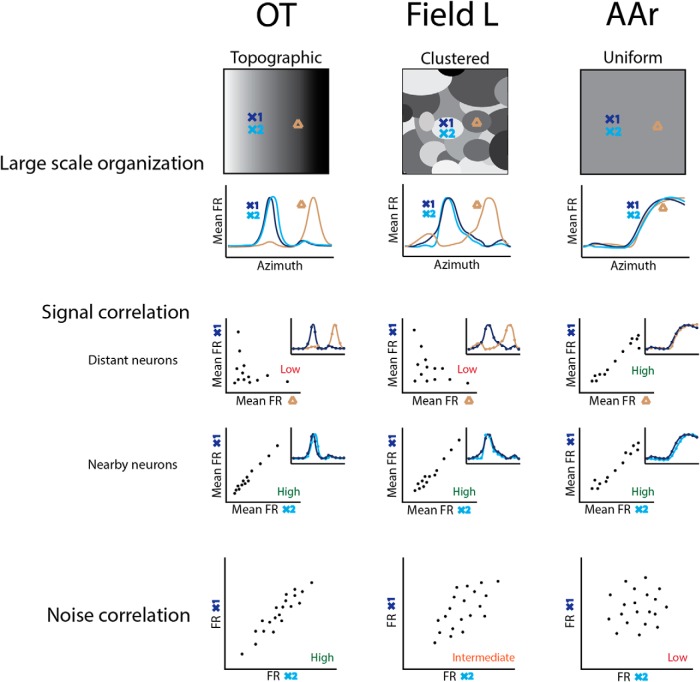
Figure 9.
Summary of findings. Top, Large-scale spatial tuning organization of each region (above) and corresponding schematic tuning curves at recording locations (below) denoted by crosses (X1 and X2 represent nearby sites) and triangles representing a distant site. OT displays a topographic organization of spatial tuning, while Field L is organized in clusters. AAr displays uniform tuning. Middle, Signal correlation for distant (above) and nearby (below) neurons. Tuning curves of distant sites is different in OT (extrapolated from previous descriptions) and Field L but similar in AAr (insets). On the other hand, tuning curves of nearby neurons are similar in all three structures. Scatter plots represent firing rates (FR) of pairs of cells across azimuth plotted against one another, used to calculate signal correlation. Tuning curves are shown in the insets. Bottom, Schematic scatter plots representing the correlated FR variability of nearby cells in OT, intermediate level of FR variability in Field L, and uncorrelated FR variability in AAr.

