

Abstract
SS-FSE is a fast technique that does not suffer from off-resonance distortions to the degree that EPI does. Unlike EPI, SS-FSE is ill-suited to diffusion weighted imaging (DWI) due to the Carr-Purcell-Meiboom-Geill (CPMG) condition. Non-CPMG phase cycling does accommodate SS-FSE and DWI but places constraints on reconstruction, which are resolved here through parallel imaging. Additionally, improved echo stability can be achieved by using short duration and highly selective DIVERSE radiofrequency pulses. Here, signal-to-noise ratio (SNR) comparisons between EPI and nCPMG SS-FSE acquisitions and reconstruction techniques give similar values. Diffusion imaging with nCPMG SS-FSE gives similar SNR to an EPI acquisition, though apparent diffusion coefficient values are higher than seen with EPI. In vivo images have good image quality with little distortion. This method has the ability to capture distortion-free DWI images near areas of significant off-resonance as well as preserve adequate SNR. Parallel imaging and DIVERSE refocusing RF pulses allow shorter ETL compared to previous implementations and thus reduces phase encode direction blur and SAR accumulation.
Index Terms: diffusion weighted imaging, nCPMG SS-FSE, abdominal imaging, body diffusion
I. Introduction
Body magnetic resonance imaging (MRI) has progressed as a standard clinical monitoring method for many pathologic processes such as oncologic diagnosis, staging, and restaging as well as detecting inflammatory bowel disease and gynecological disorders [1], [2]. Diffusion-weighted imaging (DWI) largely relies on alteration in intra- and extracellular water content from disruption of the trans-membrane water flux for image contrast and provides insight beyond what is achievable through traditional morphological imaging [3].
While DWI has been used for imaging intracranial diseases such as stroke, dementia, and neurotoxicity and is routinely used clinically [4], extending DWI to body MRI poses additional technical challenges because of the limitations of the commonly used echo planar imaging (EPI) sequence. Despite the advantage of being single-shot, EPI creates particular challenges and constraints arising from organ movement, off-resonance due to proximity to gas in the bowels and lungs, and chemical shift from lipids in adipose tissues [5]. Technical improvements such as high-amplitude gradients, multichannel coils, and parallel imaging have all improved the capabilities of EPI by reducing the echo time (TE), echo train length (ETL), and repetition time (TR), thereby ameliorating issues that come with motion [6]. While these improvements have certainly advanced the capabilities of body DW-EPI, the fundamental limitations of susceptibility to off-resonance leading to image distortion still persist [7]–[9]. Despite these challenges, DWI is increasingly used in many body MR protocols. Specific applications are broad, and include liver, gland, breast, and whole-body imaging [10], [11].
Single-shot fast spin echo (SS-FSE) [12] is a fast imaging technique that overcomes off-resonance issues by refocusing the phase accrual at each echo. Incorporating diffusion weighting in SS-FSE is problematic as this combination leads to the loss of the critical Carr-Purcell-Meiboom-Gill (CPMG) condition [13] which is necessary for signal stability. An SS-FSE sequence with diffusion weighting can be constructed as a , where τ is echo spacing and the diffusion weighting is applied in a Stejskal-Tanner gradient pair around a 180° refocusing pulse. This sequence will generally not satisfy CPMG, specifically the Meiboom-Gill (MG) phase condition. The MG condition requires the phase of the transverse magnetization at half of the echo spacing prior to the first refocusing RF pulse to be parallel (in phase with) or anti-parallel (90° out of phase with) to the phase of the first refocusing pulse [14]. Bulk motion during the diffusion preparation, the effects of induced eddy currents from the diffusion gradient lobes, and non-refocused concomitant gradient fields all lead to a spatially-varying phase modulation of the transverse magnetization present after the initial excitation. The loss of the MG condition leads to image artifacts, particularly banding, distortion, and signal dropouts.
Various methods have been proposed to circumvent the loss of CPMG condition but each comes with constraints and drawbacks. Alsop et al. [15] used a dephasing gradient before the refocusing pulse train to disperse the phase uniformly over the voxel. Components of the signal satisfying the MG phase condition enjoy good signal stability during the echo train and can be refocused for readout with a complementary rephasing gradient. Conversely, the non-MG components of the signal are tipped onto the longitudinal axis, thereby “hiding” that portion of the signal. The drawback of this approach is the loss of half of the signal. Another approach is SPLICE (split acquisition of fast spin-echo signals) [16] which acquires both spin echo and stimulated echo components separately during the readout and then reconstructs each k-space separately to avoid destructive phase interference. To fit both components in the readout window, the echo spacing will increase, leading to SNR loss, longer effective TE, and phase encode blurring, though many of these issues have been successfully mitigated through later improvements in phase encode ordering, RF pulse choice, and reconstruction [17].
PROPELLER (Periodically Rotated Overlapping ParallEL Lines with Enhanced Reconstruction) uses a short EPI readout that periodically rotates around center k-space in a multi-shot fast spin echo fashion with XY phase cycling used to maintain CPMG during signal refocusing [18]. PROPELLER has been used in diffusion applications with much success, particularly in neuro-imaging [19], as well as abdominal imaging [20]. The approach in [20] creates a relatively stable echo train for 16–32 echoes, though CPMG artifacts do start to appear [21] and suffer motion-induced phase errors across shots. To avoid CPMG artifacts, PROPELLER has also been used in a SPLICE paradigm [21]. Nunes, et al. [22] proposed correction for motion and eddy current induced phase patterns, thereby ensuring CPMG after diffusion weighting. To correct for eddy current induced non-linear phase patterns, this strategy uses subject-specific radio frequency (RF) pulses, designed after acquiring a set of calibration data, to correct for non-linear phase shifts prior to FSE.
One SS-FSE sequence that provides echo signals largely independent of the initial magnetization phase is the non-Carr-Purcell-Meiboom-Gill single-shot fast spin echo (nCPMG SS-FSE) sequence [23] developed by Le Roux. This sequence relies on a quadratic phase cycling over the course of the entire echo train to maintain a stable (and full) signal regardless of the initial magnetization phase. The nCPMG sequence has been combined with DWI for brain and spine imaging [24], [25]. Improvements have been made to create phase cycling patterns that achieve greater stability and less modulation than the original publication [26], as well as phase cycling patterns for use in hyperpolarized imaging experiments to restore the maximum magnetization to Mz at the end of each echo train [27]. Despite achieving a robust echo train, the requirement to doubly acquire k-space lines for a proper reconstruction leads to increased phase encode direction blur and signal loss due to T2 decay over the increased echo train length.
In this paper, a modified nCPMG SS-FSE sequence is presented and applied in a clinical setting for the purpose of pediatric body imaging. Specifically, an improved reconstruction technique has been developed to reduce the echo train length and phase encode direction T2-blurring. Better signal stability is achieved through more selective and shorter duration DV-SLR refocusing RF pulses. This paper also rigorously addresses questions of SNR losses or gains compared to standard EPI imaging and anecdotally demonstrated clinical viability for three clinical cases.
II. Theory
A. Signal Stability and Reconstruction
Our approach to diffusion weighted imaging in areas of B0 inhomogeneity builds upon the nCPMG SS-FSE sequence. The nCPMG method uses a modified quadratic phase cycling of the refocusing RF pulses to provide a stable signal regardless of the initial state of the magnetization phase. A careful choice of the phase modulation results in the magnetization at the echoes oscillating between two stationary eigen-states. The details of this approach are described in SU2 notation in [23] and the magnetization vector paradigm in [27]. The quadratic phase sweep is according to
| (1) |
where ϕx,i is the excitation phase at echo i and ϕr,i is the receive phase at echo i. The sweep term δi is found from
| (2) |
where Δ is the sweep rate.
A fundamental issue with the nCPMG technique is the reconstruction. Le Roux describes [28] the signal progression (Sn) between echoes as
| (3) |
where Q0 is the initial magnetization and its conjugate. The coefficients An and bn represent the “main” and “parasitic” coefficients, respectively, according to the convention in [29]. It is also noted that An, bn ∈ ℂ leading to another spatially varying phase over the image. We rewrite Q0 = X + jY with X as the “in phase” component and Y as the “quadrature” component of the magnetization. Eq. (3) can be rewritten as
| (4) |
Quadratic phase modulation can help stabilize the magnitudes of both coefficients, but even with a suitable Δ, neither An nor bn are stable (i.e., independent of n). Careful preparation [26] has been shown in simulation and in phantom studies [27] to render the coefficients (An + bn) and (An+1 − bn+1) independent of n, thus achieving a stable signal. The in phase component will remain constant and the quadrature component will oscillate by ±1 causing a shift of the quadrature component by FOV/2, illustrated in Figure 1. This is compounded by the unknown and spatially varying receiver phase ejφ.
Fig. 1.
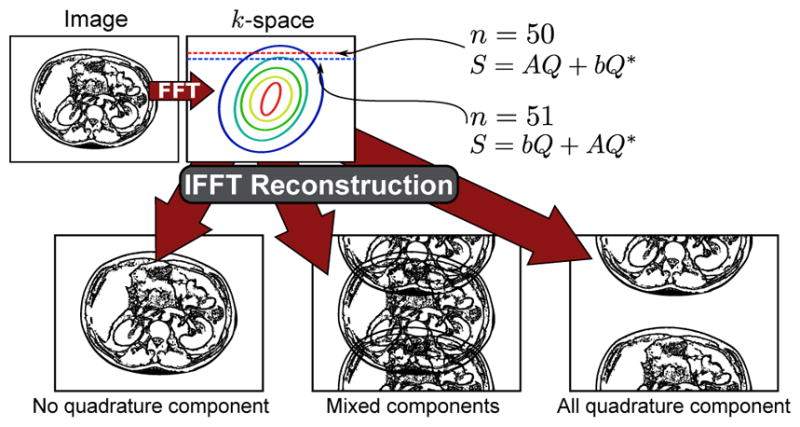
Aliasing artifacts after reconstruction. These artifacts arise from the quadrature component alternating in sign in each readout line due to the nCPMG phase cycling (Eq. (8)). A trivial reconstruction of conjugating the quadrature component is non-achievable due to the unknown receiver phases.
Earlier approaches doubly acquire every echo and either add or subtract (Double Echo Addition/Subtraction Method, DEASM) each even and odd echo pair [23], [28] yielding the X and Y component. This is represented as
| (5) |
Though both Sn + Sn+1 and Sn − Sn+1 do have spatially-varying phase, it is reported [23] to be slowly varying and thus permit a partial k-space acquisition and homodyne reconstruction. However, this approach increases the echo train duration, leading to longer scan times due to increased SAR accumulation, as well as lower SNR and greater phase encode blur due to T2 modulation. This double phase encode approach requires double encoding of all echoes, even in the overscan lines for the homodyne acquisition. Doubling these lines leads to much longer TE which can corrupt diffusion contrast via T2 shine-through. SAR necessarily increases with the number of refocusing pulses, which leads to increased TRs and ultimately protocol length. Also problematic is the case where T2 decay is incorporated where the signal found from Sn + Sn+1 and −j(Sn − Sn+1) are not equal to X and Y components as originally derived. Thus, the result is a mixture of X and Y components which is T2 dependent A more complete description of this problem is given Appendix A.
Parallel imaging techniques provide an alternative route. One promising approach is the SENSE (sensitivity encoding) [30] method. While nCPMG SS-FSE leads to a FOV/2 shift of the quadrature signal Y, the amounts of X and Y are not necessarily equal based on initial image phase. SENSE will not be able to reconstruct this image without forcing a “true” parallel imaging problem by separating even and odd echoes into two sets of data Se and So (see Figure 2). From there, a standard SENSE reconstruction could un-alias each data separately (this approach will be referred to as “split echo SENSE”). This requires coil sensitivity maps to perform the SENSE reconstruction which are deduced from a separate CPMG SS-FSE scan and eigen decomposition-based ESPIRiT [31] algorithms.
Fig. 2.
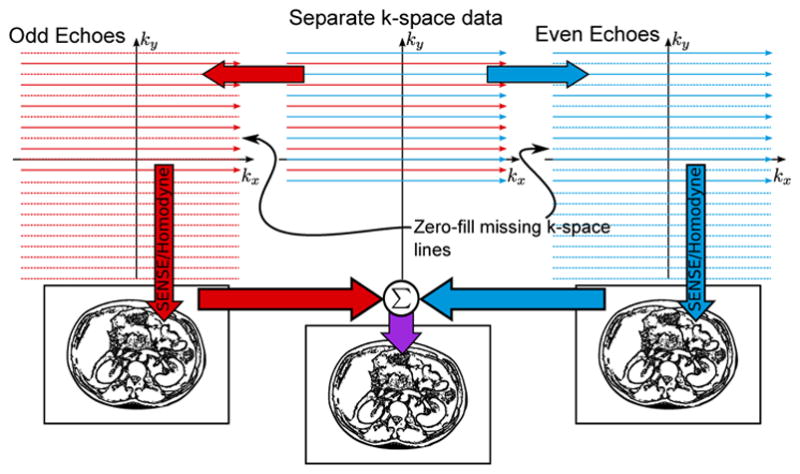
Data separation reconstruction flow. The even and odd echoes are separated in order to create two distinct reconstruction problems. SENSE reconstruction is facilitated by coil maps generated from ESPIRiT calibration on fully-sampled FSE data (not shown in this figure).
SENSE reconstruction in its simplest form is written as
| (6) |
where S is the vector of measured k-space samples that would lead to perfectly coherent aliasing (which could be either So or Se), E is the encoding matrix, and Q0 is the vector of magnetization voxels. Pre-processing of the data would include splitting the signal S into even (Se) and odd (So) signals which can be separately processed using SENSE.
| (7) |
The images resulting from Se and So can then be combined by
| (8) |
In the original nCPMG description [23], where Δ is chosen such that |A + b| = |A − b|. Thus,
| (9) |
Quadratic phase modulation ensures that A is approximately orthogonal to b [28] (e.g., b is approximately purely imaginary and A is approximately purely real). In consequence
| (10) |
If a homodyne reconstruction is used in conjunction with this even/odd parallel approach and we rewrite Eq. (3) using the Q0,e and Q0,o images found in the SENSE reconstruction in matrix form
| (11) |
We notice that this is approximately unitary, and as a result
| (12) |
which is the desired magnitude image.
The partial k-space component of the reconstruction can be performed in tandem with the SENSE processing [32]. Given one set of echoes, the data is low-pass filtered to become symmetric and reconstructed to provide a rough phase estimate. The asymmetric echo data is high-pass filtered and also reconstructed using SENSE. The image is then phase corrected by applying the phase map from the low resolution image. This procedure is applied separately to both even and odd echoes. Thus, undesired spatial phase effects (e.g., B1 variation, eddy currents, the phase from (A + b) and (A − b)) can largely be corrected.
This method has an advantage over the double phase encoding approach by decreasing the echo train length by a factor of 2. This avoids much of the T2 blurring in the phase encoding that was seen in [24]. In addition to providing sharper images, a reduction of echo spacing and signal apodization by T2 decay will correspond to an increase in SNR [33].
The SNR reduction factor for SENSE reconstruction is
| (13) |
where gp is the g-factor map based on coil geometry and r is the reduction in scan time. While the acceleration is R = 2 for both even and odd echoes, the scan time r does not change thus giving
| (14) |
As a result, the SNR losses are limited to the coil geometries.
B. RF Pulse Design
To ensure a stable signal, the magnitude and phase of bn/An must remain constant throughout the echo train. Quadratic nCPMG phase cycling helps ensure this stability, but bn/An is also a function of θ, the flip angle of the refocusing pulses, presenting two issues. First, a flip angle of θmin = 120° is necessary across the slice [27]. Second, the refocusing flip angle must be constant across the slice, otherwise excited magnetization would see multiple flip angles (even if said flip angles were above θmin), causing quickly-varying phase errors and invalidating the homodyne reconstruction. A very selective refocusing RF pulse is needed to generate a flat pass-band with a minimum transition band while maintaining the flip angle over θmin. Constant excitation Shinnar-Le Roux pulses [34] could be used but peak B1 hardware limits result in longer refocusing pulses resulting in lengthening of the echo spacing, with T2 modulation blurring and SNR loss.
Through variable-rate selective excitation (VERSE) pulses [35], [36], a more desirable spin echo profile across the slice can be achieved within peak B1 limits, reasonable pulse duration, and specific absorption rate (SAR). VERSE is a generic RF reshaping principle which can be used to shape the gradient and RF pulse to meet temporal and peak RF constraints by reducing power thereby shortening pulse duration in time. The method adopted here is a modification to the time-optimal VERSE [36] method known as delay-insensitive variable-rate selective excitation (DIVERSE) [37]. This has been shown to give improved robustness to gradient-RF system delays and reasonable off-resonance performance. Examples of RF refocusing pulses and associated excitation are seen in Figure 3(a–d), where it is shown that the DIVERSE SLR (DV-SLR) pulse achieves short duration as well as a high degree of selectivity while not exceeding a peak B1 limit. Figure 3(c–d) shows various simulated spin echo profiles for each location z in the slice [34]) demonstrates the impacts of off-resonance on the standard low TBW (TBW = 1.2) Hamming-windowed sinc (m-sinc), high TBW (TBW = 3.55) conventional constant excitation SLR (or NV-SLR for clarification), and DV-SLR pulses. DV-SLR pulses are only negligibly affected by off-resonance, which is desirable for abdominal imaging. The flip angle threshold (|sin(120°/2)|2 = 0.75) is shown in the slice excitation plots. In the cases of the highly selective refocusing pulses, more of the excited signal exceeds the threshold than in the case of the less selective refocusing pulse.
Fig. 3.

Sequence design considerations: a) Various RF refocusing pulses considered for this sequence. b–d) The corresponding spin echo profiles for each RF refocusing pulse at b) 0Hz, c) 100Hz, and d) 200Hz off-resonance. In each plot, the flip angle threshold (|sin(120°/2)|2) to maintain a stable echo train is shown. e) First portion of the proposed sequence: a spin echo diffusion pulse with diffusion lobes played out simultaneously to achieve maximum b-value while lowering TE. The FSE readout consists of DV-SLR pulses with both ω (frequency modulation) and θ (phase modulation) channels being used to improve the fidelity of phase modulation accuracy provided by the MR system. Each refocusing pulse in the FSE train has a phase ϕ to achieve signal stability despite loss of the CPMG condition. Note: The DV-SLR pulse achieves the level of selectivity of the conventional NV-SLR pulse, but also maintains the short duration of the m-sinc pulse.
III. Methods
A. Simulation
Simulation to verify the efficacy of the nCPMG phase cycling technique in [26] was done using an extended phase graph (EPG) formulation. To assess the quadrature phase cycling scheme performance in different initial conditions, a tipdown 90° pulse was used with a phase angle ranging 0° to 180° in 30° increments, and a refocusing flip angle of 160°. Two scenarios were tested: a scenario using a classical CPMG SS-FSE readout, and a scenario using a nCPMG SS-FSE readout using refocusing phases ϕn (where n is the echo train pulse number), which were pre-selected according to the algorithm in [26]. Relaxation constants of T1 = 1000 ms and T2 = 200 ms were used.
B. Sequence Parameters
An SS-FSE protocol was performed on a 3T General Electric (GE) Discovery MR750 scanner. The GE body coil was used for RF transmission in all cases. A GE multi-channel body coil was used for signal reception for resolution phantom scans and in vivo abdomen scans. A Novatec 32 channel head coil was used for agar ball and ex vivo phantom scans. For in vivo scans, all volunteer subjects consented in accordance with institutional review board guidelines.
The sequence is seen in Figure 3(e). The nCPMG simulation parameters (flip angle and excitation/receive phases) were chosen. The image size was 192x × 128y pixels. The field of view extended to 20–24 cm on phantom studies and 20–36cm for human abdomen studies. The minimum TR was used for phantom studies, limited by SAR constraints at 1100ms. Human scans were respiratory gated for one TR per breath. The time of central k-space traversal (i.e., the effective TE) was minimized and varied with the diffusion weighting b-value. Typically, TE values would be 30.1 ms without diffusion weighting and 60.4 ms with diffusion weighting. An echo spacing of 4.368 ms is achieved with a bandwidth of 83.33Mhz. Given partial k-space coverage, this gives a total echo train duration of 315 ms for a typical single-slice scan. In each SS-FSE example, a NEX=1 was used. These parameters were used for the calibration CPMG SS-FSE scan and the diffusion weighted nCPMG SS-FSE scan. Lipid suppression was achieved using adiabatic spectral inversion recovery (ASPIR) with a 170ms inversion recovery time [38], [39].
Diffusion weighting was applied in the [1, 1, 1] direction (i.e., diffusion was applied to all three gradients simultaneously and equally) in order to maximize the applied b-value while minimizing TE. If diffusion tensor imaging (DTI) or other approaches to diffusion weighted imaging are desired, different diffusion encoding directions could be used. The diffusion preparation used a single echo approach (i.e., Stejskal-Tanner diffusion gradient pulse pair) in order to reduce TE. In all in vivo cases a b-value of b = 700 s mm−2 was used.
For SS-FSE acquisitions, signal excitation was achieved by a single conventional SLR pulse. Diffusion preparation signal refocusing was achieved by a spin echo conventional SLR pulse. The echo train refocusing pulses were a DIVERSE design (DV-SLR pulses) with a nominal flip angle of 160°. The DV-SLR pulses were designed with a maximum slew of 140 mT m−1 ms−1, maximum gradient amplitude of 50 mT m−1, and maximum RF pulse height of 0.2 G. The pulse was designed for a time-bandwidth (TBW) of 3.55. The kdv parameter was 0.2 in the constraint
| (15) |
as described in [37]. The DV-SLR pulse achieves the same duration (1.1ms) as the shortest pulse (m-sinc) while also matching the level of selectivity of the conventional SLR pulse at 2.9ms, which required an additional 1.7ms to the echo spacing. Thus, using the DV-SLR pulses results in a 20% shorter echo spacing compared to an SLR pulse with similar spin echo profile. In terms of SAR, the power integral of B1(t) is 23% higher in the DV-SLR case compared to the m-sinc pulse whereas the NV-SLR case is 17% lower than the m-sinc case. This suggests a slight SAR penalty for using the DV-SLR pulses compared to using the m-sinc or NV-SLR pulses.
Reconstruction was performed using the described split echo SENSE imaging approach. A generic SS-FSE image was acquired using a classical CPMG phase scheme. This image was used to generate coil maps using an ESPIRiT algorithm [31]. A 5 × 5 kernel was used over the central 12 lines of k-space. These 6 lines of k-space (i.e., the overscan) were chosen based on Le Roux’s suggestion in [23]. While more lines of overscan can be used, 6 were sufficient in this case based on perceived image quality.
C. SNR and ADC Calculations
To fully understand this sequence’s SNR impacts, a variety of multi-slice nCPMG SS-FSE phantom images were acquired and compared: oil body phantom, agar ball phantom, as well as an ex vivo pork shoulder. For each experiment 30 images were acquired and an SNR map was calculated by
| (16) |
as in [40]. Here r is the pixel location of the image. The index k is the image number of K images; in this case K = 30. And S(r, k) is the signal intensity at each pixel r of image k. Student’s t-test was performed over a region-of-interest (ROI) for each calculated SNR to determine statistical significance.
For the oil phantom, three sets of images were acquired using both classical CPMG SS-FSE and nCPMG SS-FSE sequences. One set of CPMG images was reconstructed using a standard homodyne reconstruction. Another set of CPMG images was reconstructed using the proposed split echo SENSE method. The nCPMG SS-FSE set was also reconstructed using the parallel method. SNR maps were calculated for each case.
Diffusion weighting using the nCPMG sequence was tested using a doped agar ball phantom and a 32 channel head coil. Thirty diffusion weighted images using nCPMG SS-FSE and SS-EPI sequences with a multi-slice protocol were acquired. In each case, the diffusion weighting used b = 700 s mm−2 in the [1, 1, 1] direction. Apparent diffusion coefficient values (ADC) were calculated for both EPI and SS-FSE diffusion weighted images. EPI acquisitions were performed using image FOV and dimensions similar to the SS-FSE cases. For both EPI and SS-FSE cases, a T2 image was found by turning off the diffusion gradients while maintaining similar TE and echo spacing. The ADC values for both EPI and SS-FSE scans were found by
| (17) |
where S(r) and r have the same meaning as the SNR case. The calculated mean ADC values (r ∈ ROI) were compared using a t-test for determining statistical significance.
Multi-slice SS-FSE sequences present greater magnetization transfer effects due to the high RF power deposition. To better understand the magnetization transfer and slice crosstalk impact on SNR, an ex vivo pork shoulder was used. The pork shoulder protocols used a diffusion weighting of (b = 700 s mm−1). Protocols also consisted of a thirty slice multi-slice acquisition SS-FSE, a single-slice nCPMG SS-FSE acquisition, and a thirty slice EPI acquisition. EPI protocols included a TE of 62.9ms, TR of 3.803s, with 20 images per TR, and a receive bandwidth of 250Mhz. For the multi-slice SS-FSE, an optimized interleaving slice ordering scheme (skip-factor of 4) was used. In all cases of SNR computation, a single NEX was used.
D. In Vivo Scans
Three anecdotal clinical in vivo scans were performed using similar scan parameters as the phantom scans, with appropriate FOV adjustments. Both EPI and nCPMG SS-FSE diffusion scans were performed. Both the EPI and SS-FSE scans were multi-slice acquisitions with 6mm slice thickness and 0mm slice spacing. The number of slices varied by each case, though typically fell into the range of 20–40 slices. In the case of the EPI scans, a b = 700 s mm−2 diffusion was performed with a NEX=8 scan averaging and free-breathing [41], [42], which is standard clinical practice at our institution. With the nCPMG SS-FSE scan, a b = 700 s mm−2 was used with NEX=1 with respiratory-gating for proper registration between acquired sensitivity encoding maps and the diffusion-weighed data. The first clinical case was of a two-year-old female patient with neuroblastoma as a post-surgery scan. The second case was a five-week-old female patient with biliary dilation with a choledochal cyst. The third case was of a 21-year-old female patient with cirrhosis of the liver.
IV. Results
EPG simulation results are seen in Figure 4. In Figure 4(a), a standard CPMG aquisition is simulated where the phase of the tipdown 90° pulse varies in equal increments from 0° to 90°. As the tipdown phase approaches 90°, the signal decays quickly and exhibits undesired modulation. In Figure 4(b), a nCPMG acquisition with a quadratic phase modulation is used, providing a relatively stable signal throughout the echo train.
Fig. 4.
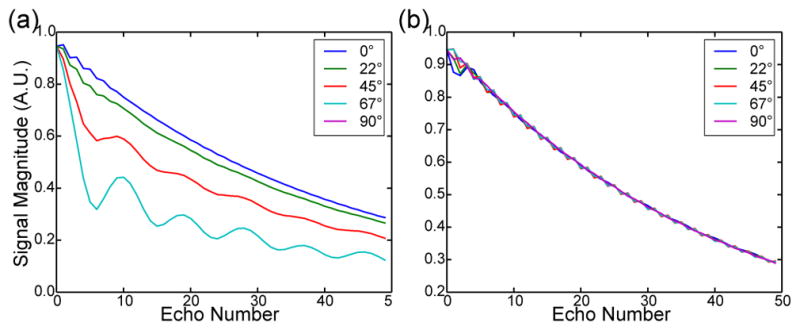
Extended phase graph (EPG) simulation showing the signal behavior with a T1/T2 values of 1000 ms/200 ms. In each plot the phase of the tipdown 90° pulse was varied from 0° to 90° mimicking the random phase accrual from diffusion weighting. a) traditional CPMG phase cycling. b) nCPMG phase cycling.
Comparison phantom images showing EPI, DEASM, and the proposed split echo SENSE acquisitions and reconstructions on a resolution phantom are seen in Figure 5. EPI acquisitions and reconstructions yield sharp, though geometrically distorted images. In the case of the reconstruction, both nCPMG techniques are able to properly unalias the data. As expected, the split echo SENSE approach leads to sharper images in the phase encode direction (left-right).
Fig. 5.
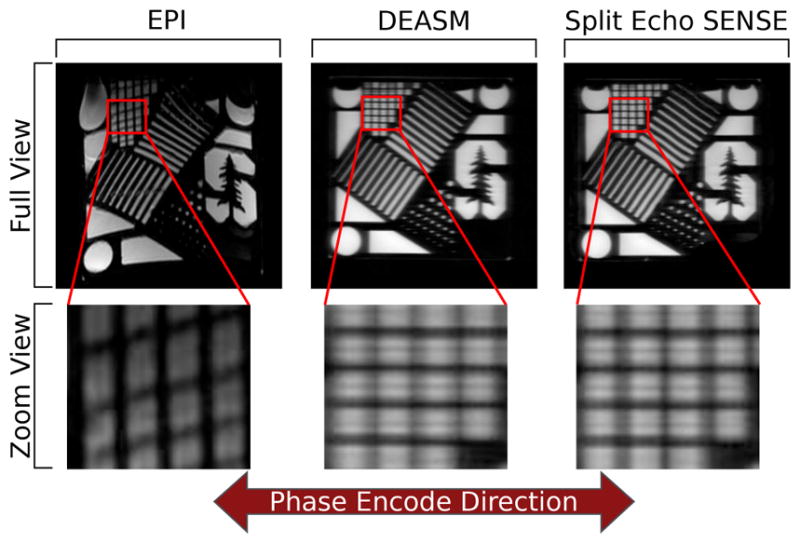
Comparisons between EPI, the previously used nCPMG DEASM, and the proposed split echo SENSE acquisition and reconstruction. The EPI images yield the sharpest images but suffer from the greatest geometric distortion. Both nCPMG images give an image without geometric distortions. It is seen that the split echo SENSE method yields a sharper image in the phase encode direction.
Comparison images showing the impacts of various RF pulses using the nCPMG split echo SENSE approach are seen in Figure 6. The m-sinc pulse images produce the most artifacts in the reconstruction (as shown by the red arrows). With the NV-SLR pulse case, there are still some artifacts as well, but they appear to a lesser degree than the m-sinc case. These images also suffer from increased blur in the phase encode direction (left-right) compared to the m-sinc and DV-SLR case. The DV-SLR case shows the fewest artifacts and also matches image sharpness compared the m-sinc case. While each image is windowed and leveled to best show the image artifacts, there is a difference in absolute level between each three cases, with the DV-SLR achieving 88% of the relative signal level seen in the m-sinc case and the NV-SLR case achieving a 70% relative signal level seen in the m-sinc case (denoted in red).
Fig. 6.
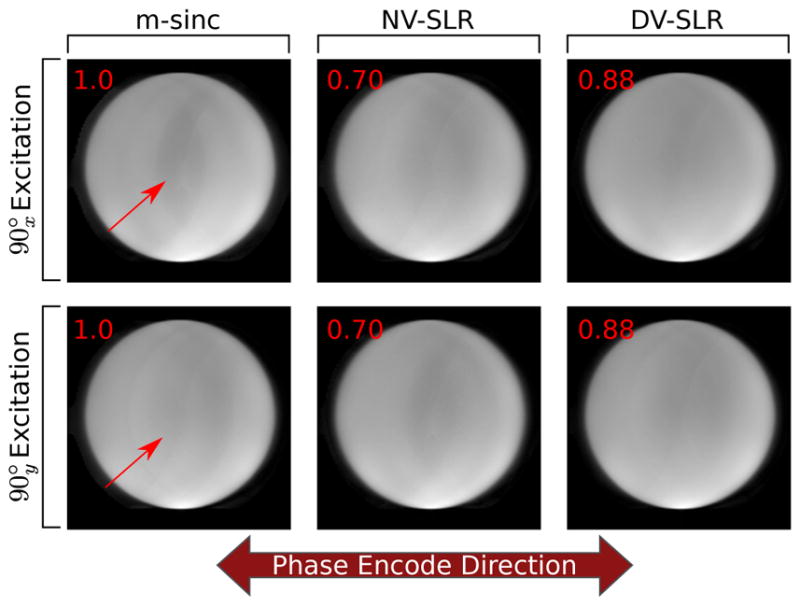
Phantom image comparisons between m-sinc, NV-SLR, and DV-SLR refocusing images using the split echo SENSE reconstruction. It is seen that the DV-SLR images suffer the least from the intermediate aliasing artifacts seen in the m-sinc image (shown by the red arrows) while maintaining the similar edge sharpness in the phase encode direction seen in the m-sinc case.
Phantom studies using the split echo SENSE approaches are seen in Figure 7. These images demonstrate the reconstruction using a grid phantom. Figure 7(a) shows the phantom with a standard CPMG acquisition and Fourier homodyne reconstruction. Figure 7(d–f) shows the phantom after nCPMG acquisition but with a standard Fourier homodyne reconstruction. Each image has a different tipdown phase on excitation ranging from 0° to 90°. The effects from this tipdown phase are similar to what was suggested in Figure 1: as the tipdown moves farther away from a standard 0° tipdown, more of the signal is put into the quadrature component. This quadrature component is manifested as an aliased component shifted by FOV/2. However, this implies that in both the 0° and 90° tipdown scenarios the whole signal exists entirely in phase or in quadrature, respectively. This trend of having the majority of the signal in phase or in quadrature is seen in Figure 7(d–f). In the 0° tipdown phase case, some signal exists in the oscillating quadrature component. Conversely, in the 90° tipdown phase case, some signal exists in the in-phase component. A mismatch between the excitation and receiver coils explains these behaviors, which are accounted for in Eq. (8).
Fig. 7.

Reconstruction examples with a grid phantom. When viewing the individual odd and even echoes images prior to averaging (b and c), there is very little difference between the two. In the cases where a standard Fourier reconstruction is used (d–f) with nCPMG SS-FSE acquisition, the quadrature component signal is aliased as expected. However, in the cases where a nCPMG SS-FSE acquisition is used with the proposed parallel imaging reconstruction (g–i), the aliasing is resolved.
The proposed parallel imaging reconstruction technique is applied in Figure 7(g–i). In these images, the FOV shift aliasing is removed. The central region of the images does show some variation between the three cases. Figure 7(b) and Figure 7(c) show the individual images before combination. Little difference is seen between the two images other than some very slight variations near the center of the images.
SNR maps are seen in Figure 8 and Figure 9. Figure 8(a) shows a SNR map from a standard reconstruction. Figure 8(b) shows a g-factor map. In this map, the peak voxel value does not stray much higher than 1, which indicates that the SNR between the proposed reconstruction and the standard homodyne Fourier reconstruction is similar, as suggested in Equation (14). This trend is seen in Figure 8(c) where the same data is reconstructed (i.e., a normal CPMG acquisition reconstructed using a parallel reconstruction technique). Table I(a) shows this trend as well, where the mean values over a region of interest (ROI) are compared. In the standard CPMG acquisition and reconstruction case, the value is 230.6; the CPMG acquisition and reconstruction cases has a mean of 228.5. Running a t-test comparing these mean values and standard deviations suggests no statistical significance (P > 0.05).
Fig. 8.
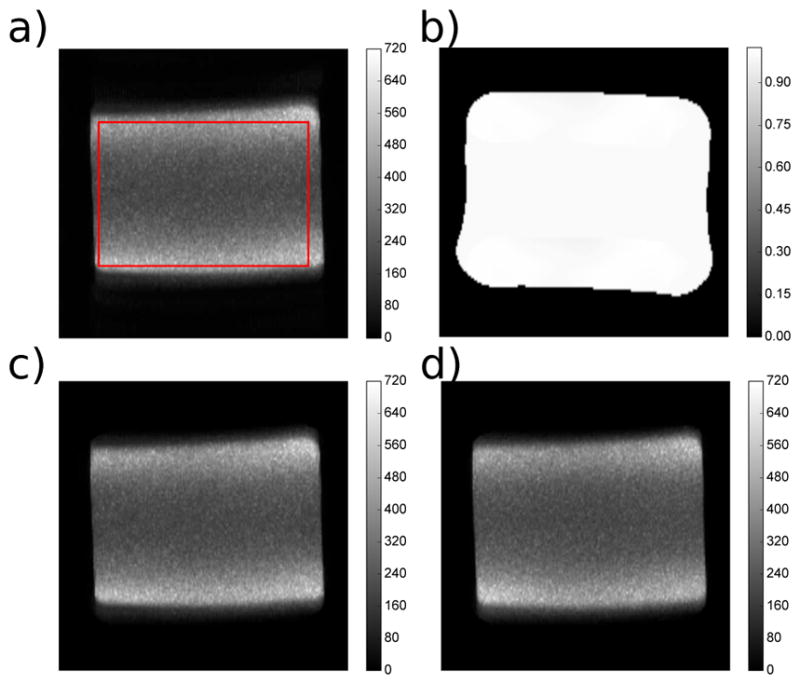
Pixel-wise SNR maps comparing various acquistion and reconstruction schemes using an oil body phantom as well as coil geometry g-factor maps. a: standard CPMG FSE acquisition and Fourier reconstruction. b: coil geometry g-factor maps. c: standard CPMG FSE acquisition but reconstructed with the proposed ESPIRiT/SENSE approach. d: nCPMG FSE acquisition and proposed ESPIRiT/SENSE approach.
Fig. 9.
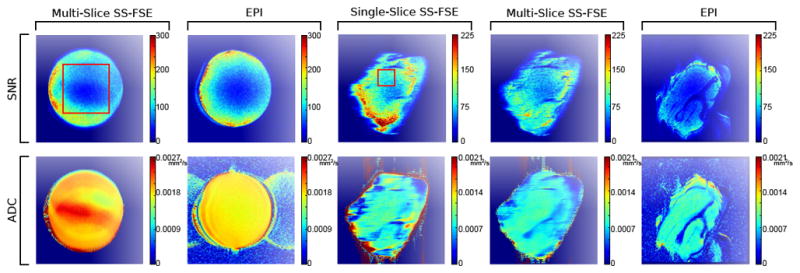
SNR and ADC maps using a doped agar ball phantom as well as an ex vivo (pork shoulder) phantom. The primary aim of the doped agar ball phantom images are to demonstrate SNC and ADC comparisons using a homogenous phantom. The ex vivo phantom images demonstrate the effects of single- versus multi-slice nCPMG SS-FSE acquisitions (namely, the impact on magnetization transfer and slice cross-talk) compared to a multi-slice EPI protocol. Note: an ROI for statistical purposes is drawn over one doped agar ball phantom image as well as one ex vivo phantom image using a red box. The same ROI was used on all respective images for determining mean, standard deviation, and statistical significance (see Table 1).
TABLE I.
SNR comparisons using phantom data
| Acquisition | Reconstruction | Mean | σ |
|---|---|---|---|
| CPMG FSE | Standard Partial Fourier | 230.6 | 85.8 |
| CPMG FSE | Parallel Imaging | 228.5 | 85.5 |
| nCPMG FSE | Parallel Imaging | 224.0 | 78.5 |
| (a) Oil phantom SNR comparisons | |||
| Image Type | Mean | σ |
|---|---|---|
| SSFSE DWI SNR | 77.3 | 27.9 |
| EPI DWI SNR | 75.0 | 24.0 |
| SSFSE DWI ADC | 0.00209 mm2 s−1 | 0.000222 |
| EPI DWI ADC | 0.00183 mm2 s−1 | 0.000049 |
| (b) Agar phantom diffusion weighted image SNR and ADC comparisons | ||
| Image Type | Mean | σ |
|---|---|---|
| SS-FSE Single-Slice SNR | 87.6 | 15.72 |
| SS-FSE Multi-Slice SNR | 68.1 | 12.1 |
| EPI DWI SNR | 43.5 | 13.6 |
| SS-FSE Single-Slice ADC | 0.000910 mm2 s−1 | 0.000074 |
| SS-FSE Multi-Slice ADC | 0.000900 mm2 s−1 | 0.000049 |
| EPI DWI ADC | 0.000923 mm2 s−1 | 0.000075 |
| (c) Ex vivo phantom diffusion weighted image SNR and ADC comparisons | ||
Figure 8(d) shows the SNR map acquired using the nCPMG technique and parallel imaging reconstruction. Compared to a standard CPMG SNR map, there are no distinct artifacts seen. This map shows a mean of 224.0, which is statistically significantly lower (P < 0.05) than the CPMG case over the same ROI. This is expected, as the EPG simulations in Figure 4 show the nCPMG signal decayed slightly faster than the CPMG case.
An ADC and SNR comparison using diffusion weighting between the EPI and nCPMG SS-FSE is seen in Figure 9. SNR is low in the nCPMG SS-FSE map near the center. The ADC values are significantly (P < 0.05) lower in that region in the SS-FSE case compared to the EPI case, shown in Table I(b). The mean of the highlighted ROI for the SS-FSE case is 0.00209 mm2 s−1 where the EPI is 0.00183 mm2 s−1.
In the ex vivo phantom, there are significant differences (P < 0.05) in SNR values between each of the three cases (see Table I(c). In the case of NEX=1, the EPI map has lower SNR than both the single- and multi-slice nCPMG SS-FSE acquisitions across the entire image. Over the specified ROI (highlighted by a red box chosen for the most uniform SNR over the image), the EPI scan had a mean SNR of 43.5, the single-slice nCPMG SS-FSE image had a mean SNR value of 87.6, and the multi-slice nCPMG SS-FSE map had a mean SNR value of 68.1. The single-slice acquisition had significantly (P < 0.05) higher SNR than the multi-slice SS-FSE. The ADC values between the three protocols were similar over the same ROI and over the entire image generally. Over the ROI, the mean ADC was 0.000910 mm2 s−1 for the single-slice nCPMG SS-FSE, 0.000920 mm2 s−1 for the multi-slice nCPMG SS-FSE, and 0.000923 mm2 s−1 for the EPI acquisition.
In vivo multi-slice scans for both diffusion weighting EPI and SS-FSE scans were performed in Figure 10. In all cases the contrast is consistent. However, noticeable image distortion caused by off-resonance that is seen in the EPI scan is not seen in the SS-FSE scan. In the second case, the diffusion pathology is seen in the highlighted lesion as expected, with the off-resonance distortion highlighted with a red arrow. In the third case, the lesion in the liver is seen in all diffusion images, though the nCPMG SS-FSE case shows higher contrast. In all cases, there is also expected noticeable phase encode direction blur in the nCPMG SS-FSE image that is not as apparent in the EPI images.
Fig. 10.

Axial slices ncPMG SS-FSE with EPI with b = 700s/mm2 diffusion weighted images. (Patient A) Two year old patient after neuroblastoma resection. (Patient B) Five week old patient with biliary dilation and a lesion in the liver (yellow arrow). (Patient C) Twenty one year old patient with cirrhosis of the liver, with the lesion identifiable in each image (green arrow). Areas of off resonance distortion in the EPI images are marked with a red arrow.
V. Discussion
While nCPMG SS-FSE acquisition is a good candidate for imaging in areas of high B0 inhomogeneity, this method has previously been partially limited by FOV/2 shift in the quadrature component when reconstructed using a standard Fourier transform. The proposed method reconstructs the image without the aliased copies by using parallel imaging techniques. Previous studies [24] have relied on reconstruction methods that require doubly acquiring phase encodes, leading to excessive T2 blurring. Here, the parallel reconstruction flow does not require double encoding but rather allows a standard partial k-space trajectory, reducing T2 blurring by halving the echo train length previously required. This is seen in comparison images between the two techniques.
Another effect that should be considered is the impact on SAR. The number of refocusing RF pulses limits the TR of SS-FSE due to SAR rather than the actual sequence time. The split echo SENSE method, SAR levels are reduced appreciably compared to the double-echo approach as the number of echoes acquired is halved, which leads to a drop in protocol time. Conversely, using the proposed DV-SLR RF pulses compared to traditional m-sinc pulses leads to a marginal increase in SAR levels, but this is a worthwhile trade-off given the improved signal stability using the DV-SLR pulses.
The benefits of the DV-SLR are clearly seen in Figure 6 as less aliasing compared to the m-sinc case while being sharper at the border. A slight signal level penalty for using the DV-SLR pulse is also seen. This loss of signal in the DV-SLR is due to the fact the m-sinc exciting a greater area through its broader slice profile (see Figure 3) which leads to more signal acquired. In NV-SLR case, the greater loss of signal is due to both a narrow slice profile and an increased TE.
The grid phantom images (Figure 7) show modest shading near the center of the phantom. This is likely a perturbation to the nCPMG phase cycling during the echo train. An additional SS-FSE acquisition or navigator to measure the effects of residual eddy currents and B1 inhomogeneity on the echo train signal could also address this.
This paper compares the SNR maps of three cases: (1) a CPMG SS-FSE with standard Fourier reconstruction, (2) a CPMG SS-FSE acquisition with the proposed parallel reconstruction, and (3) the proposed nCPMG SS-FSE acquisition and reconstruction. There was a slight difference in SNR between the CPMG and nCPMG acquisitions, consistent with EPG simulation.
Diffusion SNR map values comparing the diffusion weighted (b = 700 s mm−2) EPI and nCPMG SS-FSE images are also similar, though the SNR in the nCPMG SS-FSE case is marginally higher than the EPI case. Distortion is also important, and in both the SNR and ADC maps the round phantom shows distortion near the left edge when imaged using EPI. However, the SS-FSE does not show any such distortion.
In the ex vivo phantom cases, there is a clear SNR difference in single NEX acquisitions between multi-slice nCPMG SS-FSE, single-slice nCPMG SS-FSE, and EPI. While the ROI was kept consistent between each three cases, it is clear that off-resonance artifacts shifted the FOV for the EPI case. Despite this shift, the region where the ROI was placed was uniform enough any suspected shift in the ROI would not grossly distort the comparisons. There seems to be better lipid suppression with the EPI case compared to either nCPMG SS-FSE. This could be a result of different lipid suppression used in both cases (i.e., spectral spatial pulse for EPI and an ASPIR pulse for nCPMG SS-FSE).
The ex vivo phantom displays a reasonable SNR difference between cases. An SNR penalty for any SS-FSE sequence would be expected when moving from a single-slice to a multi-slice protocol due to slice cross-talk and magnetization transfer effects. Slice cross-talk effects can be reduced through slice interleaving. This would not ameliorate the magnetization transfer effects, which will still cause an SNR penalty.
The SNR difference between EPI and both nCPMG SS-FSE cases points to an advantage in the SS-FSE method. The SNR comparisons were for NEX=1, while the clinical scans performed here were NEX=8 for EPI and NEX=1 for nCPMG SS-FSE. While the EPI acquisition does take roughly twice as long as the nCPMG SS-FSE scan, depending on the number of v slices acquired, the SNR increase of while using NEX=8 in the clinic gives EPI the SNR advantage. While the SS-FSE implementation used here is a single NEX, a NEX=2 version would feasibly get the SNR within range of the clinical NEX=8 EPI and be within the same scan time. A NEX=2 SS-FSE was not used here because multi-NEX was not yet an available feature in the pulse sequence.
The ADC coefficient maps show the significant differences between the SS-FSE and the EPI images for the doped agar phantom ball; the ADC map generated from SS-FSE data gives values that are higher than the EPI images. Additionally, the SS-FSE image shows a large area near the center of the object where the values are higher. In contrast, ADC values for the ex vivo phantom from each of the three tested protocols were all within range. Previous studies have found similar results where ADC values between an nCPMG SS-FSE and EPI sequence vary [43]. One explanation is that spatially-varying long-duration eddy currents originating from the diffusion lobes will modulate the effective phase away from the ideal nCPMG phase cycling, leading to signal modulation in the recovered signal. Solutions could include a single SS-FSE navigator, which could be helpful in determining the cause of these deviations and providing prospective correction to the applied phase cycling. Many clinical protocols require diffusion contrast with no intention of creating ADC maps.
All of the in vivo scans show an improvement in behavior near areas of strong off-resonance. Additionally, the tissue/lesion contrast is consistent between the nCPMG SS-FSE and EPI scans, but is not exactly the same. Two possibilities for this, first the nCPMG SS-FSE has a longer effective TE (60.4ms) than the used for the EPI scan (52.1ms), which could cause T2 shine-through. Second, an SS-FSE sequence with a refocusing flip angle less than 180° is constantly mixing signal that is recovering along the longitudinal axis, thereby mixing of T1, T2, and diffusion weighting throughout the echo train. This could contribute to slight variations in contrast between nCPMG SS-FSE and EPI.
Despite the improvements in reduced distortion through nCPMG SS-FSE, it must be acknowledged that the image sharpness of nCPMG SS-FSE images will be inherently less than that achievable with EPI due to T2 decay apodization of the echo train. While the approach presented here will reduce the echo train length, thereby ameliorating this blurring effect, EPI will have a fundamental advantage with regard to phase encode direction sharpness due to its short readout. Ultimately, the technique presented here provides a trade-off: increased robustness to B0 inhomogeneities at the cost of decreased sharpness in the phase encode direction.
The described reconstruction requires a separate calibration, which is commonplace in most current DWI protocols. Self-calibration parallel imaging such as generalized autocalibrating partially parallel acquisitions (GRAPPA) [44] are difficult to incorporate in an single-shot EPI protocol and are less commonly used [33]. While the same limitations of a GRAPPA-style approach seen in EPI are not necessarily encountered here, this type of approach would require doubly encoding the center k-space and thereby increase echo spacing at least within that region, leading to undesirable signal apodization and image blur as well as lengthening TE, though such an approach could be considered in future work.
VI. Conclusion
We have developed and improved a practical SS-FSE sequence and reconstruction method that permits diffusion weighted imaging for a body imaging application. The novel additions include a modified parallel reconstruction to minimize the penalty of T2 blur, the use of DV-SLR pulses for sharper spin echo profile, the application to abdominal lesion detection. We performed quantitative verification of the behavior of the nCPMG quadratic phase sweep in both simulation, as well as in phantom scans, and have compared them favorably to the known behavior of traditional CPMG scans. Additional in vivo scans were performed to establish the efficacy of this sequence in a clinical setting with pediatric patients and to demonstrate its robustness against off-resonance in abdominal imaging.
Acknowledgments
The authors would like to thank Matt Middione at GE ASL West, as well as Bob Dougherty at the Center for Cognitive and Neurobiological Imaging at Stanford for access to scanners while developing this sequence.
Appendix A
Dual Echo Addition and Subtraction in the Presence of T2 Decay
In the previous reconstruction approach, the LeRoux makes the assumption that in the case of infinite T2, the signal progression follows
| (18) |
Then
| (19) |
This is appropriate as [1, 1]T and [1, −1]T are the eigenvectors of the matrix. However, in the case of T2 modulation, this formulation changes to
| (20) |
where τ is the echo spacing. This is rewritten as
| (21) |
This becomes problematic because the eigenvectors are no longer [1, 1]T and [1, −1]T. If one were to apply the same sum and difference algorithm, the result would be
| (22) |
where typically cosh (τ/2T2) ≃ 1 and sinh (τ/2T2) ≃ τ/2T2. The latter term can be in order of 1/20 for muscle [45], which would render the LeRoux approach invalid, particularly for partial k-space techniques.
Contributor Information
Eric K. Gibbons, Departments of Bioengineering and Electrical Engineering at Stanford University, Stanford, California 94305 USA
Patrick Le Roux, Praecedentia Libra, Palaiseau, France.
Shreyas S. Vasanawala, Department of Radiology, Stanford University, Stanford, California 94305 USA
John M. Pauly, Department of Electrical Engineering at Stanford University, Stanford, California 94035 USA
Adam B. Kerr, Department of Electrical Engineering at Stanford University, Stanford, California 94035 USA
References
- 1.Harry VN, Deans H, Ramage E, Parkin DE, Gilbert FJ. Magnetic resonance imaging in gynecological oncology. International Journal of Gynecological Cancer. 2009;19(2):186–193. doi: 10.1111/IGC.0b013e31819c52de. [DOI] [PubMed] [Google Scholar]
- 2.Shinagare AB, Ip IK, Raja AS, Sahni VA, Banks P, Khorasani R. Use of CT and MRI in emergency department patients with acute pancreatitis. Abdominal Imaging. 2015;40(2):272–277. doi: 10.1007/s00261-014-0210-1. [DOI] [PubMed] [Google Scholar]
- 3.Le Bihan D, Breton E, et al. Imagerie de diffusion in-vivo par resonance magnetique nucleaire. Comptes-Rendus de l’Académie des Sciences. 1985;93(5):27–34. [Google Scholar]
- 4.Eastwood JD, Lev MH, Wintermark M, Fitzek C, Barboriak DP, Delong DM, Lee TY, Azhari T, Herzau M, Chilukuri VR, et al. Correlation of early dynamic CT perfusion imaging with whole-brain MR diffusion and perfusion imaging in acute hemispheric stroke. American Journal of Neuroradiology. 2003;24(9):1869–1875. [PMC free article] [PubMed] [Google Scholar]
- 5.Attariwala R, Picker W. Whole body MRI: Improved lesion detection and characterization with diffusion weighted techniques. Journal of Magnetic Resonance Imaging. 2013;38(2):253–268. doi: 10.1002/jmri.24285. [DOI] [PMC free article] [PubMed] [Google Scholar]
- 6.Koh DM, Collins DJ. Diffusion-weighted MRI in the body: applications and challenges in oncology. American Journal of Roentgenology. 2007;188(6):1622–1635. doi: 10.2214/AJR.06.1403. [DOI] [PubMed] [Google Scholar]
- 7.Le Bihan D, Poupon C, Amadon A, Lethimonnier F. Artifacts and pitfalls in diffusion MRI. Journal of Magnetic Resonance Imaging. 2006;24(3):478–488. doi: 10.1002/jmri.20683. [DOI] [PubMed] [Google Scholar]
- 8.Riffel P, Michaely HJ, Morelli JN, Pfeuffer J, Attenberger UI, Schoenberg SO, Haneder S. Zoomed EPI-DWI of the pancreas using two-dimensional spatially-selective radiofrequency excitation pulses. PloS one. 2014;9(3):e89468. doi: 10.1371/journal.pone.0089468. [DOI] [PMC free article] [PubMed] [Google Scholar]
- 9.Koh DM, Lee JM, Bittencourt LK, Blackledge M, Collins DJ. Body diffusion-weighted MR imaging in oncology: Imaging at 3 t. Magnetic resonance imaging clinics of North America. 2016;24(1):31–44. doi: 10.1016/j.mric.2015.08.007. [DOI] [PubMed] [Google Scholar]
- 10.Malayeri A, El Khouli R, Zaheer A, Jacobs M, Corona-Villalobos C, Kamel I, Macura K. Principles and applications of diffusion-weighted imaging in cancer detection, staging, and treatment follow-up. Radiographics: a review publication of the Radiological Society of North America Inc. 2011;31(6):1773. doi: 10.1148/rg.316115515. [DOI] [PMC free article] [PubMed] [Google Scholar]
- 11.Vilgrain V, Daire J, Sinkus R, Van Beers B. Diffusion-weighted MR imaging of the liver. Journal de Radiologie. 2010;91(3 Pt 2):381–90. doi: 10.1016/s0221-0363(10)70054-8. [DOI] [PubMed] [Google Scholar]
- 12.Hennig J, Nauerth A, Friedburg H. RARE imaging: a fast imaging method for clinical MR. Magn Reson Med. 1986;3(6):823–833. doi: 10.1002/mrm.1910030602. [DOI] [PubMed] [Google Scholar]
- 13.Carr HY, Purcell EM. Effects of diffusion on free precession in nuclear magnetic resonance experiments. Physical Review. 1954;94(3):630. [Google Scholar]
- 14.Meiboom S, Gill D. Modified spin-echo method for measuring nuclear relaxation times. Review of Scientific Instruments. 1958;29(8):688–691. [Google Scholar]
- 15.Alsop DC. Phase insensitive preparation of single-shot RARE: Application to diffusion imaging in humans. Magn Reson Med. 1997;38(4):527–533. doi: 10.1002/mrm.1910380404. [DOI] [PubMed] [Google Scholar]
- 16.Schick F. SPLICE: Sub-second diffusion-sensitive MR imaging using a modified fast spin-echo acquisition mode. Magn Reson Med. 1997;38(4):638–644. doi: 10.1002/mrm.1910380418. [DOI] [PubMed] [Google Scholar]
- 17.Norris DG. Selective parity RARE imaging. Magn Reson Med. 2007;58(4):643–649. doi: 10.1002/mrm.21339. [DOI] [PubMed] [Google Scholar]
- 18.Pipe J, Huo D, Li Z, Aboussouan E. Consistent signal for non-CPMG echo trains. Proceedings of the 9th Annual Meeting of ISMRM; Honolulu, Hawaii. 2009. p. 164. [Google Scholar]
- 19.Pipe JG, Farthing VG, Forbes KP. Multishot diffusion-weighted FSE using PROPELLER MRI. Magn Reson Med. 2002;47(1):42–52. doi: 10.1002/mrm.10014. [DOI] [PubMed] [Google Scholar]
- 20.Deng J, Miller FH, Salem R, Omary RA, Larson AC. Multishot diffusion-weighted PROPELLER magnetic resonance imaging of the abdomen. Investigative Radiology. 2006;41(10):769–775. doi: 10.1097/01.rli.0000236808.84746.95. [DOI] [PubMed] [Google Scholar]
- 21.Deng J, Omary RA, Larson AC. Multishot diffusion-weighted SPLICE PROPELLER MRI of the abdomen. Magn Reson Med. 2008;59(5):947–953. doi: 10.1002/mrm.21525. [DOI] [PubMed] [Google Scholar]
- 22.Nunes RG, Malik SJ, Hajnal JV. Single shot fast spin echo diffusion imaging with correction for non-linear phase errors using tailored RF pulses. Magn Reson Med. 2014;71(2):691–701. doi: 10.1002/mrm.24711. [DOI] [PubMed] [Google Scholar]
- 23.Le Roux P. Non-CPMG fast spin echo with full signal. Journal of Magnetic Resonance. 2002;155(2):278–292. doi: 10.1006/jmre.2002.2523. [DOI] [PubMed] [Google Scholar]
- 24.Bastin ME, Le Roux P. On the application of a non-CPMG single-shot fast spin-echo sequence to diffusion tensor MRI of the human brain. Magn Reson Med. 2002;48(1):6–14. doi: 10.1002/mrm.10214. [DOI] [PubMed] [Google Scholar]
- 25.Oner A, Tali T, Celikyay F, Celik A, Le Roux P. Diffusion-weighted imaging of the spine with a non–carr-purcell-meiboom-gill single-shot fast spin-echo sequence: Initial experience. American Journal of Neuroradiology. 2007;28(3):575–580. [PMC free article] [PubMed] [Google Scholar]
- 26.Le Roux P. Non-CPMG phase modulation, the easy way. Proceedings of the 14th Annual Meeting of ISMRM; Seattle, WA. 2006. p. 3368. [Google Scholar]
- 27.Le Roux P, McKinnon G, Yen Y-F, Fernandez B. Realignment capability of the nCPMG sequence. Journal of Magnetic Resonance. 2011;211(2):121–133. doi: 10.1016/j.jmr.2011.05.005. [DOI] [PubMed] [Google Scholar]
- 28.Le Roux P. Progress in non-CPMG fast spin echo. Proceedings of the Seventh Annual Meeting of ISMRM; Philadelphia, PA. 1999. p. 7. [Google Scholar]
- 29.Norris DG, Börnert P, Reese T, Leibfritz D. On the application of ultra-fast rare experiments. Magn Reson Med. 1992;27(1):142–164. doi: 10.1002/mrm.1910270114. [DOI] [PubMed] [Google Scholar]
- 30.Pruessmann KP, Weiger M, Scheidegger MB, Boesiger P, et al. SENSE: sensitivity encoding for fast MRI. Magn Reson Med. 1999;42(5):952–962. [PubMed] [Google Scholar]
- 31.Uecker M, Lai P, Murphy MJ, Virtue P, Elad M, Pauly JM, Vasanawala SS, Lustig M. ESPIRiT an eigenvalue approach to autocalibrating parallel mri: Where SENSE meets GRAPPA. Magn Reson Med. 2014;71(3):990–1001. doi: 10.1002/mrm.24751. [DOI] [PMC free article] [PubMed] [Google Scholar]
- 32.King K, Angelos L. Sense with partial fourier homodyne reconstruction. Proceedings of the 8th Annual Meeting of ISMRM, Denver; Denver, Colorado, USA. 2000. p. 153. [Google Scholar]
- 33.Skare S, Newbould RD, Clayton DB, Albers GW, Nagle S, Bammer R. Clinical multishot DW-EPI through parallel imaging with considerations of susceptibility, motion, and noise. Magn Reson Med. 2007;57(5):881–890. doi: 10.1002/mrm.21176. [DOI] [PMC free article] [PubMed] [Google Scholar]
- 34.Pauly J, Le Roux P, Nishimura D, Macovski A. Parameter relations for the shinnarle roux selective excitation pulse design algorithm. IEEE Trans Med Imag. 1991;10(1):53–65. doi: 10.1109/42.75611. [DOI] [PubMed] [Google Scholar]
- 35.Conolly S, Nishimura D, Macovski A, Glover G. Variable-rate selective excitation. Journal of Magnetic Resonance (1969) 1988;78(3):440–458. [Google Scholar]
- 36.Lee D, Lustig M, Grissom WA, Pauly JM. Time-optimal design for multidimensional and parallel transmit variable-rate selective excitation. Magn Reson Med. 2009;61(6):1471–1479. doi: 10.1002/mrm.21950. [DOI] [PMC free article] [PubMed] [Google Scholar]
- 37.Kerr AB, Zhu K, Middione MJ, Wu H, Dougherty RF, Pauly JM. Delay-insensitive variable-rate selective excitation (DIVERSE). Proc. Intl. Soc. Mag. Reson. Med; Toronto, Canada. 2015. p. 921. [Google Scholar]
- 38.Tannús A, Garwood M, et al. Adiabatic pulses. NMR in Biomedicine. 1997;10(8):423–434. doi: 10.1002/(sici)1099-1492(199712)10:8<423::aid-nbm488>3.0.co;2-x. [DOI] [PubMed] [Google Scholar]
- 39.Garwood M, DelaBarre L. The return of the frequency sweep: designing adiabatic pulses for contemporary NMR. Journal of Magnetic Resonance. 2001;153(2):155–177. doi: 10.1006/jmre.2001.2340. [DOI] [PubMed] [Google Scholar]
- 40.Dietrich O, Raya JG, Reeder SB, Reiser MF, Schoenberg SO. Measurement of signal-to-noise ratios in MR images: Influence of multichannel coils, parallel imaging, and reconstruction filters. Journal of Magnetic Resonance Imaging. 2007;26(2):375–385. doi: 10.1002/jmri.20969. [DOI] [PubMed] [Google Scholar]
- 41.Takahara T, Imai Y, Yamashita T, Yasuda S, Nasu S, Van Cauteren M. Diffusion weighted whole body imaging with background body signal suppression (DWIBS): technical improvement using free breathing, STIR and high resolution 3d display. Matrix. 2004;160(160):160. [PubMed] [Google Scholar]
- 42.Kiryu S, Dodanuki K, Takao H, Watanabe M, Inoue Y, Takazoe M, Sahara R, Unuma K, Ohtomo K. Free-breathing diffusion-weighted imaging for the assessment of inflammatory activity in crohn’s disease. Journal of Magnetic Resonance Imaging. 2009;29(4):880–886. doi: 10.1002/jmri.21725. [DOI] [PubMed] [Google Scholar]
- 43.Celik A, Oner AY, Tali TE, Le Roux P. Accuracy of the nCPMG-ssFSE diffusion-weighted imaging. Radiological Society of North America 2007 Scientific Assembly and Annual Meeting; Chicago, Illinois. 2007. [Google Scholar]
- 44.Griswold MA, Jakob PM, Heidemann RM, Nittka M, Jellus V, Wang J, Kiefer B, Haase A. Generalized autocalibrating partially parallel acquisitions (GRAPPA) Magn Reson Med. 2002;47(6):1202–1210. doi: 10.1002/mrm.10171. [DOI] [PubMed] [Google Scholar]
- 45.Gold GE, Han E, Stainsby J, Wright G, Brittain J, Beaulieu C. Musculoskeletal MRI at 3.0 T: relaxation times and image contrast. American Journal of Roentgenology. 2004;183(2):343–351. doi: 10.2214/ajr.183.2.1830343. [DOI] [PubMed] [Google Scholar]