Abstract
Type I restriction-modification enzymes are differentiated from type II and type III enzymes by their recognition of two specific dsDNA sequences separated by a given spacer and cleaving DNA randomly away from the recognition sites. They are oligomeric proteins formed by three subunits: a specificity subunit, a methylation subunit, and a restriction subunit. We solved the crystal structure of a specificity subunit from Methanococcus jannaschii at 2.4-Å resolution. Two highly conserved regions (CRs) in the middle and at the C terminus form a coiled–coil of long antiparallel α-helices. Two target recognition domains form globular structures with almost identical topologies and two separate DNA binding clefts with a modeled DNA helix axis positioned across the CR helices. The structure suggests that the coiled–coil CRs act as a molecular ruler for the separation between two recognized DNA sequences. Furthermore, the relative orientation of the two DNA binding clefts suggests kinking of bound dsDNA and exposing of target adenines from the recognized DNA sequences.
Keywords: structural genomics, gi 15669898
Invasion of foreign DNA can be prevented by restriction enzymes that cleave foreign DNA. Three types of DNA restriction systems are presently known: I, II, and III. Because type I restriction enzymes, more precisely restriction-modification (R-M) systems, recognize a specific sequence but cleave randomly far from the recognition sequence, they are distinguished from type II and III enzymes that recognize and cleave specific target DNA sequences (1, 2). The type I enzymes are heterogeneous complexes, consisting of a specificity subunit (S-subunit) that is responsible for recognizing a specific DNA sequence, a methylation subunit (M-subunit) that methylates the target adenine nucleotides recognized by the S-subunit, and a restriction subunit (R-subunit) that randomly cleaves DNA (3, 4). They recognize nonpalindromic DNA sequence containing two specific regions of 3–5 bp separated by nonspecific DNA sequences of 6–8 bp (5–7). Although, primarily, they cleave unmethylated DNA, they also act as a methyltransferase upon encountering a hemimethylated DNA.
Type I R-M enzymes have been subdivided into four families (IA, IB, IC, and ID) based on cross-hybridization of genes and antibody cross-reactivity (8, 9). Recent study in Klebsiella shows the existence of another subfamily in type I R-M enzymes, type IE (10). Whereas M- and R-subunits are highly conserved within a family, S-subunits are variable in two large regions that constitute domains for recognizing the target DNA sequences (target recognition domain, TRD) (11–13). TRDs in the S-subunit are separated by a conserved region (CR) (central CR, CCR) and an additional CR is attached to the C terminus (distal CR, DCR) (14). TRDs within a family are interchangeable and the CRs have been suggested to be involved in protein–protein interactions with the other subunits (15).
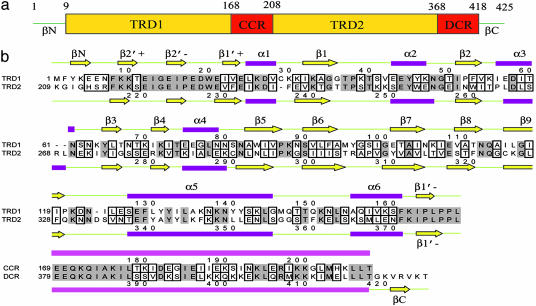
There are two different sets of type I R-M systems in the genomic DNA of Methanococcus jannaschii. We solved the crystal structure at 2.4-Å resolution of the S-subunit, gi 15669898. It is a single polypeptide chain of 425 aa and, like in the other S-subunits, has two CRs, one in the middle and the other at the C terminus. The two TRDs of ≈160 aa show high structural similarities to each other, as do the two CRs of ≈40 aa each (Fig. 1). This first crystal structure of a type I S-subunit shows that two repeated elongated globular TRDs are separated by a coiled–coil of long α-helical CRs. The crystal structure provides the structural basis for understanding how, in type I R-M systems, two target DNA sequences separated by a given spacer are recognized and how the target adenines in the DNA may be exposed for recognition and modification.
Fig. 1.
Domain assignment and secondary structure of S-subunit of a type I R-M from M. jannschii. (a) Schematic representation of an S-subunit. (b) Sequence alignment of TRD1/TRD2 and CCR/DCR. Identical residues have a gray background, and highly homologous and low homologous residues are in small and larger boxes, respectively.
Materials and Methods
Cloning and Expression of the S-Subunit of a Type I R-M System from M. jannaschii. The gene for the S-subunit of the type I R-M system, gi 15669898, was amplified by PCR using M. jannaschii genomic DNA with the primers designed for ligation-independent cloning (16). The amplified PCR product was prepared for vector insertion by purification, quantitation, and treatment with T4 DNA polymerase (New England Biolabs) in the presence of 1 mM dTTP. The prepared insert was annealed into the ligation-independent cloning expression vector pB3, a derivative of pET21a (Novagen) that expresses the cloned gene fused with an N-terminal 6-His-tobacco etch virus cleavage sequence and transformed into chemical competent DH5α cells.
Fusion Protein Expression, Purification, and Crystallization. Fusion protein was expressed in Escherichia coli strain BL21(DE3)/pSJS1244 (17) cells grown in auto inducing media (William Studier, personal communication). Bacteria were lysed by sonication in buffer A [50 mM Hepes, pH 7.0/1 mM PMSF/10 μg/ml DNase/Roche Protease Inhibitor Mixture Tablet (EDTA-free)] and cell debris pelleted by centrifugation at 21,000 × g for 20 min at 4°C in a Sorvall centrifuge. The lysate was then spun in a Beckman ultracentrifuge Ti45 rotor at 90,000 × g for 30 min at 4°C to remove membrane proteins. The fusion protein was affinity-purified from the soluble fraction by using a 5-ml HiTrap Chelating HP column (GE Healthcare, Uppsala, Sweden); elution was achieved with a linear gradient from 0 to 400 mM imidazole in 17 column volumes. The eluted sample was dialyzed against 20 mM Tris, pH 7.5 to remove imidazole and further purified by ion exchange chromatography. The purity of the expressed protein was determined by SDS/gel electrophoresis, and homogeneity of the protein sample was determined by dynamic light scattering (Dyna Pro-99, Proterion, Piscataway, NJ). The molecular weight of the protein was confirmed by MALDI-TOF MS. The protein was concentrated to 27 mg/ml in 25 mM Tris, pH 7.5 and 350 mM NaCl. Initial screening for crystallization with a sparse matrix sampling method (18) was performed at 293 K by using a hanging drop vapor-diffusion method, by mixing 1 μl of the protein with an equal volume of reservoir solution. Orthorhombic crystals with a maximum dimension of 0.4 × 0.2 × 0.2 mm3 were obtained in 20% polyethyleneglycol 3,000 and 0.1 M N-cyclohexyl-2-aminoethanesulfonic acid, pH 9.5.
Data Collection and Structure Determination. Crystals belong to space group P21 with unit cell dimensions of a = 71.97, b = 94.22 Å, c = 103.52 Å, α = γ = 90.0°, β = 95.01°, and the unit cell contains two molecules per asymmetric unit with 63% solvent content. Before cryocooling, crystals were briefly immersed in the reservoir solution containing 30–40% glycerol. All diffraction data were collected at 100 K at the Berkeley Center for Structural Biology beamlines 5.0.1, 5.0.2, and 8.2.2 at the Advanced Light Source Lawrence Berkeley National Laboratory and were processed, merged, and scaled by using the hkl2000 package (19). Crystals soaked in a phenyl mercury compound gave a clear electron density map by the single anomalous dispersion analysis method. Six mercury sites were identified by using the program solve (20), and phases were further improved by density modification with the programs resolve (20) and cns (21). The model was built by using the program o (22) and refined by using the cns package (21). The final structure was refined by using a 2.4-Å resolution native data set. Water molecules were added and optimized during the cycles of model inspection. The quality of the model was analyzed with procheck (23) (Table 1).
Table 1. Data collection and refinement statistics.
| Parameters | Native | Hg-soaked |
|---|---|---|
| Source | ALS 8.2.2 | ALS 5.0.1 |
| Wavelength, Å | 1.0000 | 1.0000 |
| Space group | P21 | P21 |
| Cell parameters | a = 71.97, b = 94.22, c = 103.52, β = 95.01° | a = 72.39, b = 94.37, c = 101.65, β = 94.20° |
| Resolution, Å | 50.0–2.40 | 50.0–2.80 |
| (last shell) | (2.50–2.40) | (2.90–2.80) |
| Completeness, % Overall/last shell | 97.1/91.3 | 95.8/97.4 |
| Rsym, % Overall/last shell* | 5.0/31.5 | 5.4/47.8 |
| Reflections Observed/unique | 150,375/53,699 | 140,523/32,596 |
| I/σ | 16.7 (2.1) | 12.9 (2.4) |
| Figure of merit† solve/resolve | 0.27/0.53 | |
| Rfactor, %‡ | 23.7 | |
| Rfree, %§ | 27.9 | |
| No. of atoms Protein/water | 6,828/329 | |
| rms deviation | ||
| Bonds, Å | 0.012 | |
| Angle, ° | 1.26 | |
| Geometry, % | ||
| Most favored | 83.4 | |
| Additionally allowed | 15.4 | |
| Disallowed | 0.3 |
Rsym = Σhkl Σj|Ij – 〈I〉|/ΣhklΣjIj, where 〈I〉 is the mean intensity of reflection hkl
Figure of merit = |ΣP(α)eiα/ΣP(α)|, where P(α) is the phase probability distribution and α is the phase (50.0–2.8 Å)
Rfactor = Σhkl||Fobs| – |Fcalc||/Σhkl|Fobs|; where Fobs and Fcalc are, respectively, the observed and calculated structure factor amplitude for reflections hkl included in the refinement
Rfree is the same as Rfactor but calculated over a randomly selected fraction (10%) of reflection data not included in the refinement
Results and Discussion
Structure Determination. The crystal structure of the S-subunit of the type I R-M system was determined by single anomalous dispersion analysis using a mercury compound as an anomalous scatterer. Two monomers are present in the asymmetric unit. Six histidine residues and the tobacco etch virus cleavage sequence that were fused at the N terminus of the protein for purification purposes are disordered in the structure. The crystal packing environments of the two monomers are different, resulting in better defined electron density for one monomer than for the other. There are two additional disordered regions in both molecules (Thr-148–Lys-151 and Glu-254–Glu-257). The side chain of Phe-161 adopts two rotamer conformations and Phe-328 is exposed to solvent region and has no side-chain density.
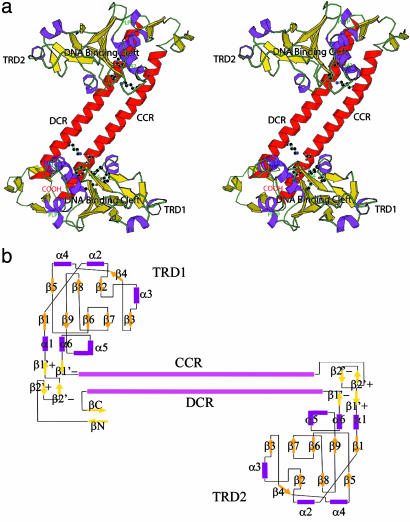
A total of 424 aa of 425 were modeled into each monomer. A monomeric structure shows four continuous structural motifs: an N-terminal first TRD (TRD1, Lys-9–Leu-168), a long α-helical CCR (Glu-169–Thr-208), the second TRD (TRD2, Lys-209–Leu-368), and the C-terminal long α-helical DCR (Glu-369–Thr-418). Two additional β-strands are present at the very N and C terminus (Tyr-3–Glu-5 for βN and Val-421–Val-423 for βC) and form an antiparallel β-sheet near the elongated TRD1 domain (Figs. 1 and 2). The N-terminal boundary of each TRD has relatively poor electron density. The overall geometry of the model is favorable with 83.4% of residues in the most favored region, and only Lys-64 located in the disallowed region (Table 1).
Fig. 2.
Tertiary structure representation of an S-subunit. (a) Stereogram of the overall structure. The monomeric structure is displayed by ribbon representation and hydrogen-bonding residues at domain interfaces are indicated by stick models. The highly conserved PLPP sequences and DNA binding clefts are marked. A monomer consists of four successive structural domains: the globular TRD1, a long helical CCR domain, the globular TRD2, and a C-terminal DCR helix. Two almost identical TRDs are attached to both ends of complementary CR helices. The N and C termini form a β-strand and a β-sheet to close both termini. The figure was prepared by using molscript (35). (b) Topology diagram of the S-subunit of a type I R-M system from M. jannaschii. Two TRDs are symmetrically located around the complementary CR helices, except for the two β-strands (βN and βC) at the N and C terminus of TRD1.
Structure of the Globular TRDs. As expected from the high sequence identity of 40.7% (Fig. 1), TRD1 and TRD2 have very similar fold. Each has an elongated α+β mixed folding with extensive interaction with one of two CR helices: TRD1 exclusively interacts with the CCR helix and TRD2 with the DCR helix. In both cases, the domains start with an N termini consisting of β-ribbons (β2′+/β2′-ribbon and β1′+/β1′-ribbon) and end at the C terminus with the highly conserved hinge regions, containing the sequence of PLPPL, that connect the TRDs to the long α-helical CRs. Two domains have an almost identical topology and 3D structure with an rms deviation of 2.0 Å. The N-terminal β-strand (βN) of TRD1 forms a two-stranded antiparallel β-ribbon with a short β-strand at the C terminus (βC), thereby closing the N- and the C-terminal ends of the S-subunit in the overall structure (Fig. 2).
The central regions of the globular TRDs consist of six α-helices and nine β-strands. A β-sandwich is formed by a pair of β-sheets with five (β1β9β6β7β3) and three β-strands (β2β8β5), respectively. However, this sandwich appears to be different from a typical β-sandwich because of several insertions between β-strands that wall the β-sandwich on both sides: a helix insertion between β1 and β2 (α2) and another helix between β2 and β3(α3), and an α-helix and a β-strand insertions between β3 and β5 (β4α4). The other two α-helices (α5 and α6) and one short β-strand (β1′) are attached to the C terminus of β9 (Figs. 2 and 3).
Fig. 3.
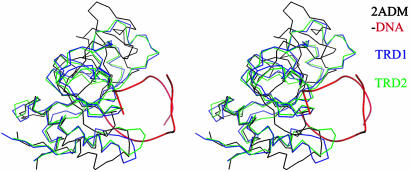
Stereogram of superposed TRD1 and TRD2 on the DNA binding domain of the TaqI-MTase. TRD1, TRD2, and TaqI-MTase are differentiated by colors, and the bound DNA backbone to the DNA binding domain of TaqI-MTase is displayed in red. The three globular structures superpose well especially in the DNA binding region.
Although no structural homolog was found against the entire structure, a structure similarity search with the dali program (24) suggests the TRD is similar to the DNA binding domain of adenine methyltransferase from Thermus aquaticus (TaqI-MTase) (25) with rms deviations of 2.7 and 3.5 Å for the TRD1 and TRD2, respectively. However, the structure-based sequence identities among them are very low, for example, 14.7% for the TRD1 and 17.1% for the TRD2. An outstanding deviation upon superposition is found at the N-terminal region, where both TRDs form β-ribbons, whereas the TaqI-MTase forms an α-helix and a β-strand. Further deviations are found in α2β2-, α4-, and α5-containing regions in the TRDs of the S-subunit (Fig. 3). The regions that are structurally well aligned between the two proteins form a DNA binding cleft in the DNA complex of TaqI-MTase that will be described in detail later.
The Two CR Domains. Unlike the sequence-variable TRDs in the S-subunit, two regions (CCR and DCR) have conserved sequences among many type I R-M enzymes and often exist in the middle and at the end of the primary sequences. Based on the observation of the full recovery of desired specific activity by TRD swapping or repeating, the CRs have been suggested to provide a structural motif for protein–protein interaction with the other subunits of type I R-M endonucleases (15).
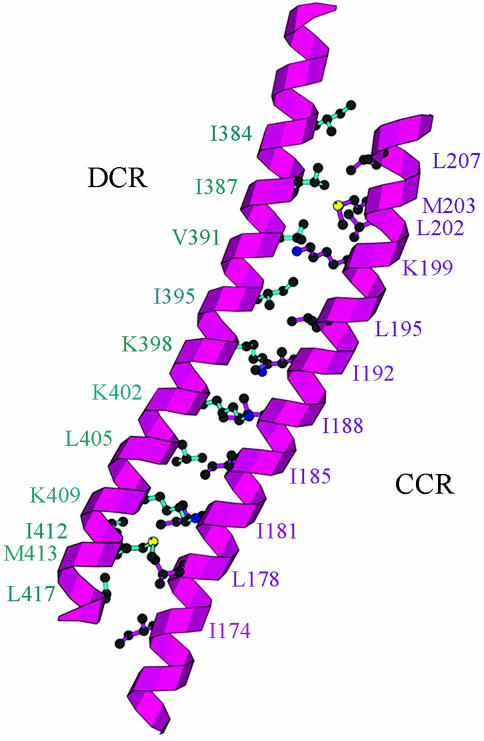
The crystal structure reveals that these CRs form two 10-turn α-helices running in an antiparallel way and interacting with each other by hydrophobic contacts between a series of hydrophobic residues (Fig. 4). CRs have staggered ends of one helical turn (Figs. 2 and 4). The highly conserved sequence regions are located at these ends of the CR helices that are connected to the hinge region (PLPP sequence in Fig. 2), where hydrophobic interactions are formed with the TRDs. Additional polar interactions between the side chains of the two CRs mediate the tight interaction between the two helical chains. In the overall CR architecture, many positively charged residues (Lys-176, Lys-180, Lys-190, Lys-194, Arg-197, Lys-205, Lys-382, Lys-386, Lys-393, Lys-399, Lys-401, Lys-404, Lys-409, Lys-410, and Lys-411) and negatively charged residues (Glu-183, Glu-189, Glu-196, Glu-396, and Glu-403) are positioned toward the solvent accessible regions.
Fig. 4.
Coiled–coil structures of CRs. Two highly CRs in the middle and at the end of the primary sequences of an S-subunit form long coiled–coil structures with a large number of hydrophobic residues between the two helical coils.
The structural homolog of this coiled–coil structure has been frequently observed in other protein structures, such as a coiled–coil region in the DNA repair system RAD50 ATPase (26), a cytosolic helical bundle structure of chemotaxis receptor protein in signal transduction (27), and the prefoldin/β-tubulin binding postchaperonin cofactor in protein–protein interaction (28).
Interactions Between CRs and TRDs. The TRD's direct interactions with the CRs are entirely restricted to the ends of the CR helices. Both of the longest helices, α5, in the two TRDs are kinked and interact with the CR helices, where the strictly conserved proline-rich sequences at the ends of TRD sequences, 164PLPPL168 in TRD1 and 374PLPPL378 in TRD2, form hydrophobic pockets with hydrophobic residues of Trp-20, Phe-129, Ile-133, Ile-174, Leu-178, Met-413, and Leu-417 in TRD1, and with Trp-228, Phe-346, Tyr-343, Leu-207, Met-203, Ile-384, and Leu-388 in TRD2.
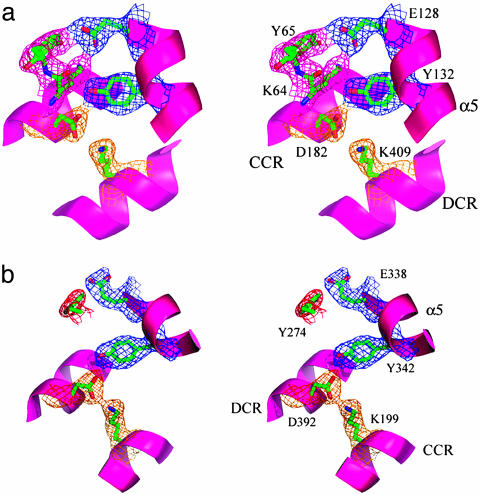
The TRDs interact also with the CRs by using polar residues in the loop region between α3 and β3, where α3 is directly involved in forming DNA binding clefts in both TRDs. In TRD1, the two oxygen atoms of Glu-128 are hydrogen-bonded to NZ of Lys-64 and OH of Tyr-65. Lys-64 has well defined electron density but has a distorted geometry in a disallowed region of the Ramachandran plot. The NZ of Lys-64 is also located within hydrogen-bond distance of the OH of Tyr-132 that interacts with the OD2 of Asp-182 from the CCR long helix and with the OG1 of Thr-179 from the CCR long helix. The OD1 of Asp-182 completes this complicated hydrogen bond network by interacting with the NZ of Lys-409 from the long DCR helix (Figs. 2 and 5a).
Fig. 5.
Stereo presentations of the TRD's interaction with the CRs. The longest helix, α5, in the TRDs interacts with CR helices by providing hydrophobic residues at the ends of the CRs as well as hydrophilic residues toward the middle of CR helices that were displayed with 2 Fo - Fc density contoured at 1.5 σ. The figures were prepared by using pymol (www.pymol.org). (a) Lys-64 in TRD1 is located at the interface with the CRs and has a well defined electron density. However, it has a distorted geometry. (b) The interaction of TRD2 with CRs is simplified compared with that of TRD1 probably because of the loss of a hydrogen bond donor corresponding to Lys-64 in TRD1.
A similar polar network is observed at the interface of TRD2 and the CR helices. As in TRD1, TRD2 is fixed directly to one of two CR helices by hydrogen bonds. The OH of Tyr-342 interacts with the OD1 of Asp-392 from the DCR helix that is connected through its OD2 to the NZ of Lys-199 from the CCR helix. Another hydrogen bond is formed between the OH of Tyr-274 and the Oε2 of Glu-338 in TRD2. However, the absence of lysine at the position corresponding to Lys-64 of TRD1 in TRD2 (Leu-273) results in a relatively simple interaction of TRD2 with CRs (Figs. 2 and 5b), implying, perhaps, a greater flexibility of TRD2 compared with TRD1.
DNA Binding Clefts and Model for a DNA Complex. TaqI-MTase is composed of two structural motifs, a dsDNA binding domain and an S-adenosyl-l-methionine (AdoMet) binding domain that transfers a methyl group from an AdoMet cofactor to the target adenine residue. In the DNA complex structure, dsDNA is bound at the interface of the two domains with the target adenine extruded from the DNA helix and trapped near into the bound AdoMet cofactor (25).
DNA binding clefts in the TRDs could be clearly identified by superpositioning the DNA binding domain of TaqI-MTase to TRD (Fig. 3). The DNA binding cleft of the MTase–DNA complex structure is wider than those of the TRDs. The surface at the binding clefts shows a slight difference at the DNA interacting regions between the structures, probably caused by the primary sequence variations: a 2-aa deletion in the loop between β6 and β7, and 1- and 2-aa insertions between α3 and β3 in TRD1 and TRD2, respectively.
By analogy to the DNA binding domain structure of the DNA complex of TaqI-MTase, four structurally equivalent loops in TRD structures would be involved in DNA binding: a loop region between β2 and α3 (Lys-55–Asp-58 in TRD1 and Thr-262–Asp-265 in TRD2), a loop between β6 and β7 (Tyr-96–Ser-98 in TRD1 and Arg-305–Pro-307 in TRD2), a loop between β8 and β9 (Asn-112–Ala-114 in TRD1 and Asn-321–Gly-323 in TRD2), and a loop between α5 and α6 (Gln-150–Asn-152 in TRD1 and Phe-360–Glu-362 in TRD2, respectively). Among these, two loops (between β6 and β7 and between β8 and β9) could be aligned to the DNA binding regions that were experimentally confirmed by random point mutagenesis studies in the type IA R-M enzyme EcoKI (29). Transformation of the bound DNA on the TaqI-MTase into the DNA binding clefts of TRDs provides each TRD with a DNA complex model, where the double helical DNA model is bound by using its major groove. A number of polar residues are located within the distance to mediate a possible interaction with the model DNA (Lys-55, Asn-82, Gly-97, Asn-112, Gln-113, Tyr-96, Asn-152, Asn-154, and Qln-156 in TRD1 and Thr-244, Pro-263, Arg-305, Pro-307, Asn-321, Gln-322, Lys-325, Phe-360, Lys-361, and Glu-362 in TRD2). Interestingly, hydrophobic residues (Ile-56 in TRD1 and Ala-306 and Leu-264 in TRD2) are also positioned in both TRDs to possibly participate in DNA binding by providing van der Waals interactions with DNA bases.
In contrast, a series of positively charged residues are positioned over the target recognition site of and along the surfaces of the TRDs, for example, Lys-26, Lys-30, Lys-33, Lys-34, Lys-121, and Lys-159 in TRD1 and Lys-240, Lys-330, and Lys-365 in TRD2, which might recruit DNAs by providing nonspecific charge compensation to the DNA phosphate backbone.
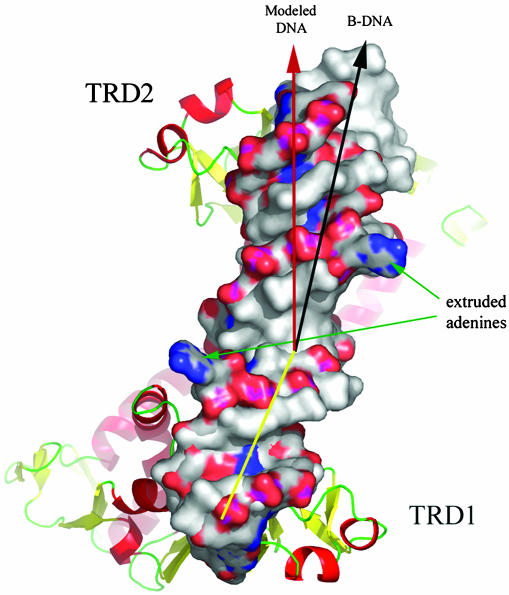
DNA Kinking and Twisting for Extruding Target Adenine Nucleotides. To obtain a model of a DNA complex with the two TRDs in an S-subunit, we used, for each TRD, the same DNA binding mode as in the TaqI-MTase. When this modeled DNA was compared with B-DNA, the complex structure required a kinking of the dsDNA between the two binding sites, which are spaced by 8 bp and cause unwinding of dsDNA to expose the base to be modified. Therefore, our structure strongly supports the previous suggestion that CRs might act as a molecular ruler (30) by forming two antiparallel CR helices and providing a proper physical space (8 bp) between the modeled two recognition dsDNA sequences (Fig. 6).
Fig. 6.
Model for DNA binding to the S-subunit of an M. janaschii type I R-M system. The model was obtained by transporting the DNA from the TaqI-MTase DNA complex structure to each TRD of the S-subunit after the DNA binding domain of TaqI-MTase was superposed to TRDs of the S-subunit. TRDs interact with the DNA major groove. When the bound DNA in a colored surface presentation is compared with normal B-DNA in a gray surface presentation, the modeled DNA is kinked and twisted toward one end of the DNA.
Implications for Subunit Assembly with CR Helices as a Frame. The presence of an open hydrophobic pocket suggests a recognition or protein–protein interaction site by trapping a hydrophobic surface patch of the interacting protein into its pocket. In pro-matrix metalloprotease 2, for example, an open pocket within a pair of β-sheets of the fibronectin domain 2 acts as an interacting module with the N-terminal elongated propeptide chain by accepting the hydrophobic side chain of Phe-37 (31). Similarly, an open hydrophobic pocket in the sandwich domain 2 of fervidolysin accepts two hydrophobic residues of Leu-14 and Leu-17 from the propeptide chain (32). Open hydrophobic pockets in the S-subunit are also formed between the kinked helix α5, α6, and the entering external β-sandwich (β1′+/β1′-ribbon and β2′+/β2′-ribbon) by the hydrophobic residues of Ile-13, Tyr-140, Leu-144, Leu-153, Ile-157, and Phe-161 in TRD1 and Ile-221, Leu-350, Leu-354, Leu-363, Met-367, and Phe-371 in TRD2, respectively (open pocket in Fig. 7).
Fig. 7.
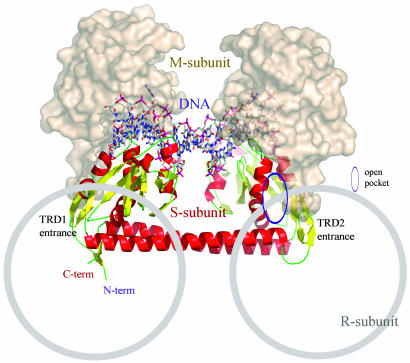
Model for subunit assembly. The S-subunit is drawn as a ribbon diagram, and the obtained DNA model shown in sticks. The M-subunit of the TaqI-MTase is drawn as a surface model and was docked around the TRDs of the S-subunit, based on the sequence similarity and functional features. The possible R-subunit binding regions drawn as gray circles are marked based on the structural features as well as the reported experimental data.
In the E. coli type IC R-M system, EcoR124I, the CRs of the S-subunit (Gly-232-Thr-245) have been suggested as an interaction point with the M-subunit (33). These CRs are equivalent to the entrance part of TRD2 in our S-subunit structure facing the opposite sides of the putative DNA binding clefts in the TRDs. On the other hand, the M-subunit, a potential binding partner of our S-subunit with gi 1592267, shows 49% homology to the AdoMet binding domain of TaqI-MTase with a similar size of ≈220 aa. Based on these observations, we docked the AdoMet binding domain of TaqI-MTase next to the TRDs of the S-subunit, which positions the extruded adenine in contact with the M-subunit model for methylation (Fig. 7).
In EcoR124I, the point mutation of one aromatic residue at the entrance part of TRD2 to a charged residue (W212R) directly altered protein–protein interaction between the S- and R-subunits (34). The corresponding areas in our TRDs are highly conserved, suggesting that the DNA-reeling and cleaving R-subunit might cover the entrance of TRDs at an opposite side from the M-subunit (Fig. 7).
Acknowledgments
We thank Barbara Gold for cloning, Marlene Henriquez, and Bruno Martinez for expression studies and cell paste preparation, Ramona Pufan for help with crystallization, the staff of Advanced Light Source beamline 5.0.1, 5.0.2, and 8.2.2 of the Lawrence Berkeley National Laboratory for their help with diffraction data collection, John-Marc Chandonia for a bioinformatics search of the gene, and In-Geol Choi for valuable discussions. The staff at the Advanced Light Source is supported by the Director, Office of Science, Office of Basic Energy Sciences, Materials Sciences Division, of the U.S. Department of Energy under Contract DE-AC03-76SF00098 at the Lawrence Berkeley National Laboratory. This work was supported by Protein Structure Initiative Grant GM 62412 from the National Institutes of Health.
Author contributions: J.-S.K., R.K., and S.-H.K. designed research; J.-S.K., A.D., J.J., H.Y., R.K., and S.-H.K. performed research; J.-S.K., A.D., J.J., P.D.A., H.Y., R.K., and S.-H.K. analyzed data; and J.-S.K. and S.-H.K. wrote the paper.
Abbreviations: S-subunit, specificity subunit; M-subunit, methylation subunit; R-subunit, restriction subunit; R-M, restriction-modification; TRD, target recognition domain; CR, conserved region; CCR, central CR; DCR, distal CR; AdoMet, S-adenosyl-l-methionine; TaqI-MTase, methyltransferase from Thermus aquaticus.
Data deposition: Atomic coordinates have been deposited in the Protein Data Bank, www.pdb.org (PDB ID code 1YF2).
References
- 1.Studier, F. W. & Bandyopadhyay, P. K. (1998) Proc. Natl. Acad. Sci. USA 85, 4677-4681. [DOI] [PMC free article] [PubMed] [Google Scholar]
- 2.Dreier, J., MacWilliams, M. P. & Bickle, T. A. (1996) J. Mol. Biol. 264, 722-733. [DOI] [PubMed] [Google Scholar]
- 3.Bickle, T. A. & Krüger, D. H. (1993) Microbiol. Rev. 57, 434-450. [DOI] [PMC free article] [PubMed] [Google Scholar]
- 4.Redaschi, N. & Bickle, T. A. (1996) J. Mol. Biol. 257, 790-803. [DOI] [PubMed] [Google Scholar]
- 5.Yuan, R. (1981) Annu. Rev. Biochem. 50, 285-315. [DOI] [PubMed] [Google Scholar]
- 6.Endlich, B. & Linn, S. (1985) J. Biol. Chem. 260, 5729-5738. [PubMed] [Google Scholar]
- 7.Szczelkun, M. D., Dillingham, M. S., Janscak, P., Firman, K. & Halford, S. E. (1996) EMBO J. 15, 6335-6347. [PMC free article] [PubMed] [Google Scholar]
- 8.Barcus, V. A., Titheradge, A. J. B. & Murray, N. E. (1995) Genetics 140, 1187-1197. [DOI] [PMC free article] [PubMed] [Google Scholar]
- 9.Bickle, T. A. (1987) in Cellular and Molecular Biology, eds. Ingraham, J. L., Low, K. B., Magasanik, B., Neidhardt, F. C., Schaechter, M. & Umbarger, H. E. (Am. Soc. Microbiol., Washington, DC), pp. 692-696.
- 10.Chin, V., Valinluck, V., Magaki, S. & Ryu, J. (2004) Nucleic Acids Res. 32, e138. [DOI] [PMC free article] [PubMed] [Google Scholar]
- 11.Gough, J. A. & Murray, N. E. (1983) J. Mol. Biol. 166, 1-19. [DOI] [PubMed] [Google Scholar]
- 12.Kannan, P., Cowan, G. M., Daniel, A. S., Gann, A. A. F. & Murray, N. E. (1989) J. Mol. Biol. 209, 335-344. [DOI] [PubMed] [Google Scholar]
- 13.Gubler, M., Braguglia, D., Meyer, J., Piekarowicz, A. & Bickle, T. A. (1992) EMBO J. 11, 233-240. [DOI] [PMC free article] [PubMed] [Google Scholar]
- 14.Gubler, M. & Bickle, T. A. (1991) EMBO J. 10, 951-957. [DOI] [PMC free article] [PubMed] [Google Scholar]
- 15.Kneale, G. G. (1994) J. Mol. Biol. 243, 1-5. [DOI] [PubMed] [Google Scholar]
- 16.Aslanidis, C. & de Jong, P.J. (1990) Nucleic Acids Res. 20, 6069-6074. [DOI] [PMC free article] [PubMed] [Google Scholar]
- 17.Kim, R., Sandler, S. J., Goldman, S., Yokota, H., Clark, A. J. & Kim, S.-H. (1998) Biotechnol. Lett. 20, 207-210. [Google Scholar]
- 18.Jancarik, J. & Kim, S.-H. (1991) J. Appl. Crystallogr. 24, 409-411. [Google Scholar]
- 19.Otwinowski, Z. & Minor, W. (1997) Methods Enzymol. 276, 307-326. [DOI] [PubMed] [Google Scholar]
- 20.Terwilliger, T. C. & Berendzen, J. (1999) Acta Crystallogr. D 55, 849-861. [DOI] [PMC free article] [PubMed] [Google Scholar]
- 21.Brünger, A. T., Adams, P. D., Clore, G. M., DeLano, W. L., Gros, P., Grosse-Kunstleve, R. W., Jiang, J. S., Kuszewski, J., Nilges, M., Pannu, N.S., et al. (1998) Acta Crystallogr. D 54, 905-921. [DOI] [PubMed] [Google Scholar]
- 22.Jones, T. A., Zou, Z.-Y., Cowan, S. W. & Kjeldgaard, M. (1991) Acta Crystallogr. A 47, 110-117. [DOI] [PubMed] [Google Scholar]
- 23.Laskowski, R., MacArthur, M., Hutchinson, E. & Thorton, J. (1993) J. Appl. Crystallog. 26, 283-291. [Google Scholar]
- 24.Holm, L. & Sander, C. (1993) J. Mol. Biol. 233, 123-138. [DOI] [PubMed] [Google Scholar]
- 25.Goedecke, K., Pignot, M., Goody, R. S. Scheidig, A. J. & Weinhold, E. (2001) Nat. Struct. Biol. 8, 121-125. [DOI] [PubMed] [Google Scholar]
- 26.Hopfner, K. P., Craig, L., Moncalian, G., Zinkel, R. A., Usui, T., Owen, B. A., Karcher, A., Henderson, B., Bodmer, J. L., McMurray, C. T., et al. (2002) Nature 418, 562-566. [DOI] [PubMed] [Google Scholar]
- 27.Kim, K. K., Yokota, H. & Kim, S. H. (1999) Nature 400, 787-792. [DOI] [PubMed] [Google Scholar]
- 28.Siegert, R., Leroux, M. R., Scheufler, C., Hartl, F. U. & Moarefi, I. (2000) Cell 103, 621-632. [DOI] [PubMed] [Google Scholar]
- 29.O'Neill, M., Dryden, D. T. F. & Murray, N. E. (1998) EMBO J. 17, 7118-7127. [DOI] [PMC free article] [PubMed] [Google Scholar]
- 30.Price, C., Linger, J., Bickle, T. A., Firman, K. & Glover, S. W. (1989) J. Mol. Biol. 205, 115-125. [DOI] [PubMed] [Google Scholar]
- 31.Morgunova, E., Tuuttila, A., Bergmann, U., Isupov, M., Lindqvist, Y., Schneider, G. & Tryggvason, K. (1999) Science 284, 1667-1670. [DOI] [PubMed] [Google Scholar]
- 32.Kim, J. S., Kluskens, L. D., de Vos, W. M., Huber, R. & van der Oost, J. (2004) J. Mol. Biol. 335, 787-797. [DOI] [PubMed] [Google Scholar]
- 33.Abadjieva, A., Patel, J., Zinkevich, V. & Firman, K. (1994) J. Mol. Biol. 241, 35-43. [DOI] [PubMed] [Google Scholar]
- 34.Weiserová, M. & Firman, K. (1998) Biol. Chem. 379, 585-589. [PubMed] [Google Scholar]
- 35.Kraulis, P. J. (1991) J. Appl. Crystallogr. 24, 946-950. [Google Scholar]


