

Abstract
Methylglyoxal (MGO) is a major glycating agent that reacts with basic residues of proteins and promotes the formation of advanced glycation end products which are believed to play key roles in a number of pathologies, such as diabetes, Alzheimer’s disease, and inflammation. We previously showed that MGO treatment targets the thioredoxin and the glyoxalase systems, leading to a decrease in Trx1 and Glo2 proteins in immortalized mouse hippocampal HT22 nerve cells. Here, we propose that autophagy is the underlying mechanism leading to Glo2 and Trx1 loss induced by MGO. The autophagic markers p62, and the lipidated and active form of LC3, were increased by MGO (0.5 mM). Autophagy inhibition with bafilomycin or chloroquine prevented the decrease in Trx1 and Glo2 at 6 and 18 h after MGO treatment. Proteasome inhibition by MG132 exacerbated the effect of MGO on Trx1 and Glo2 degradation (18 h), further suggesting a role for autophagy. ATG5 small interfering RNA protected Trx1 and Glo2 from MGO-induced degradation, confirming Trx1 and Glo2 loss is mediated by autophagy. In the search for the signals that control autophagy, we found that AMPK activation, a known autophagy inducer, was markedly increased by MGO treatment. AMPK activation was confirmed by increased acetyl coenzyme A carboxylase phosphorylation, a direct AMPK substrate and by decreased mTOR phosphorylation, an indirect marker of AMPK activation. To confirm that MGO-mediated Trx1 and Glo2 degradation was AMPK-dependent, AMPK-deficient mouse embryonic fibroblasts (MEFs) were treated with MGO. Wildtype MEFs presented the expected decrease in Trx1 and Glo2, while MGO was ineffective in decreasing these proteins in AMPK-deficient cells. Overall, the data indicate that MGO activates autophagy in an AMPK-dependent manner, and that autophagy was responsible for Trx1 and Glo2 degradation, confirming that Trx1 and Glo2 are molecular targets of MGO.
Keywords: autophagy, AMPK, mTOR, methylglyoxal, thioredoxin, glyoxalase, HT22 cells
Graphical Abstract

Introduction
Methylglyoxal (MGO) is an endogenous byproduct of the normal metabolism of carbohydrates, lipids, and proteins, inevitably produced spontaneously or enzymatically [1]. Accumulation of MGO is highly deleterious, since it readily reacts in vivo with basic phospholipids and nucleotides, and with lysine and arginine residues of proteins, generating advanced glycation end products (AGEs) [1]. MGO has been associated with a number of pathologies, such as diabetes, hyperalgesia and inflammation, aging disorders, Alzheimer’s disease, epilepsy, autism, and anxiety, among others [2]. Alzheimer’s and diabetic patients present elevated levels of MGO in the cerebrospinal fluid and increased formation of AGEs [3,4]. The cognitive decline seen during aging has also been related to disturbances in MGO metabolism [5].
The glyoxalase system is the main enzymatic route for MGO elimination. Glyoxalase 1 (Glo2, EC 4.4.1.5) catalyzes the GSH-dependent conversion of MGO to S-D-lactoylglutathione, which is converted to D-lactate with the help of glyoxalase 2 (Glo2, EC 3.1.2.6). Glo1 activity is the rate limiting step in MGO degradation, which makes its regulation tightly associated with MGO toxicity [2]. However, an important role for Glo2 in counteracting MGO toxicity has also been proposed [6,7], including after loading HT22 cells with purified Glo2 or in vivo after an ischemic episode [8]. Our recent study showed that MGO treatment of mouse HT22 nerve cells leads to a marked decrease in Glo2 after 8 h of treatment with either a subtoxic (0.3 mM) or toxic (0.75 mM) concentration of MGO [9], but the mechanisms underlying this effect are not known.
Thioredoxin (Trx), thioredoxin reductase (TrxR, EC 1.8.1.9) and NADPH constitute the Trx system which is the main electron donor for enzymes such as ribonucleotide reductase (EC 1.17.4.1), methionine sulfoxide reductases (EC 1.8.4.11), peroxiredoxins (EC 1.11.1.15), and glutathione peroxidases (EC 1.11.1.9) [10,11]. Similar to other proteins, Trx and TrxR have reactive cysteines that are among the most sensitive to oxidative stress [12,13], and thus may be oxidized by reactive oxygen species or targeted by thiol-reacting molecules, such as MGO. Decreased levels of Trx in the neural tissue and increased levels in plasma and cerebrospinal fluid were found in Alzheimer disease patients, and such changes were correlated to clinical scores and were of prognostic value [14]. There is some in vitro evidence showing that components of the Trx/TrxR system are molecular targets of MGO toxicity [9,15,16]. Endothelial cells exposed to MGO downregulate Trx1 protein and mRNA copy number [17]. In HT22 nerve cells, MGO induced a marked decrease in Trx activity and Trx1 protein, as well as a decrease in TrxR activity [9]. Furthermore, it was shown that TrxR1 was heavily modified with MGO-adducts, possibly explaining the loss of function [9]. Nevertheless, much remains to be determined about the mechanisms involved in the effects of MGO on the Trx/TrxR system.
Following up on our data showing that the Trx/TrxR and the glyoxalase systems are targets of MGO [9], we investigated if enhanced proteasome activity or autophagy could explain the decreases in Trx1 and Glo2 in MGO-treated HT22 nerve cells. In order to modulate proteasome and autophagic activity, known inhibitors were used, and given that AMPK is a major regulator of autophagy, we also investigated the role of AMPK in MGO-induced autophagy.
Material and methods
Materials
Tissue culture dishes were from NUNC; fetal calf serum was obtained from Hyclone; high-glucose Dulbecco’s modified Eagle medium (DMEM) was from Invitrogen (Carlsbad, CA, USA). Bovine serum albumin, N-(2-hydroxyethyl)-piperazine-N-(2-ethanesulfonic acid) (Hepes), 2-mercaptoethanol, 3-(4,5-dimethylthiazol-2-yl)-2,5-diphenyltetrazolium bromide (MTT), methylglyoxal, ethylenediaminetetraacetic acid, and tris(hydroxymethyl)aminomethane) (Tris), chloroquine (CQ) were from Sigma–Aldrich. MG132, and bafilomycin (BAF) were from Calbiochem. Primary antibodies, and their respective dilutions and sources were: Glo2 (sc-31057, 1:1000, goat), pS2448-mTOR (sc-297, 1:1000, mouse) from Santa Cruz Biotechnology; pS79-ACC (3661, 1:1000, rabbit); ACC (3662, 1:1000, rabbit), pT172-AMPK (2535, 1:1000, rabbit); α-AMPK (2793, 1:1000, rabbit); LC3 (4108S, 1:1000, rabbit); Trx1 (2429, 1:3000, rabbit); ubiquitin (3936, 1:1000, mouse) from Cell Signaling; MG-adduct (STA-011, 1:1000, mouse) from Cell Biolabs; p62 (sequestosome) (1:5000, guinea pig) from American Research Products. Mouse embryonic fibroblast (MEFs) was a generous gift of Dr. Reuben Shaw from the Salk Institute, La Jolla, CA.
Cell culture and treatments
Immortalized mouse hippocampal HT22 cells were grown on tissue culture dishes in high-glucose DMEM that was supplemented with 10% FCS as previously published [9,18]. Following treatment for the indicated times and concentrations of MGO, the medium was exchanged with fresh medium without MGO, and cell viability was quantified by the MTT assay [19]. None of the tested MGO concentrations (0.1–0.5 mM) produced any appreciable decrease in cell survival at 24 h, as determined by the MTT assay (data not shown). It is important to note that the MGO effect on cell survival was highly dependent on cell density, indicating that MGO concentrations need to be adjusted accordingly for experimental reproducibility. For other assays, 1.5 × 10⁵ cells were plated in 60 mm plate dishes and the cells were grown to semiconfluence. Prior to harvesting the cells, the medium was aspirated and the cells rinsed twice with cold PBS.
Transfection
For siRNA transfections, HT22 cells were plated in 60 mm dishes at 5 × 10⁵ cells/dish and 166 pmol ATG5 siRNA (#sc-41446) or control siRNA (#sc-37007), all from Santa Cruz Biotechnology (Santa Cruz, CA), were used along with RNAiMAX (Invitrogen) according to the manufacturer’s instructions.
Western blot
HT22 cells were plated at a density of 1.5 × 10⁵ cells per 6 cm dish. At 80% confluence cells were treated as indicated, rinsed twice in ice-cold, Tris-buffered saline and harvested in sample buffer (25 mM Tris, pH 8.0, 2% SDS, 25 mM 2-mercaptoethanol, 1 mM Na3VO4).
Samples were analyzed by SDS-PAGE using 10% Criterion XT Precast Bis-Tris Gels (Biorad). Proteins were transferred to polyvinylidene fluoride membranes, and probed with the desired primary antibody as detailed elsewhere [9,20]. Immunodetection was performed by using Super Signal West Pico Substrate (Pierce) with the appropriate secondary antibody. For each antibody, the same membrane was re-probed for actin or Ponceau S to normalize the protein load, as indicated. Antibodies were previously tested in whole cell extracts to ascertain dilutions. Horseradish peroxidase-conjugated secondary antibodies (Bio-Rad) were diluted 1/5000 in 5% skim milk in tris buffered saline/0.1% Tween 20 prior to use. Autoradiographs were scanned using a Bio-Rad GS800 scanner, and band density was measured using the Quantity One software.
Statistical analysis
Statistical significance was assessed by non-parametric one-way ANOVA, followed with the Kruskal-Wallis post-test. When autophagic (BAF and CQ) or proteasomal (MG132) inhibitors were used, a non-parametric Student t-test was used to compare the treated group with the untreated control. Statistical significance was set at p values < 0.05. Data are presented as mean ± SEM of at least 3 independent experiments, unless otherwise stated.
Results
Trx1 and Glo2 protein are affected by MGO treatment
We previously demonstrated that the glyoxalase and thioredoxin systems are molecular targets of MGO [9], however the mechanisms underlining such effects remain to be determined. Here the participation of autophagy and proteasomal degradation in the MGO-mediated loss of Trx1 and Glo2 was investigated. First, we reproduced our previous data [9] demonstrating that HT22 cells treated with a non-lethal concentration of MGO show a decrease in Trx1 (Fig. 1A and B) and Glo2 (Fig. 1C and D) protein.
Fig. 1.
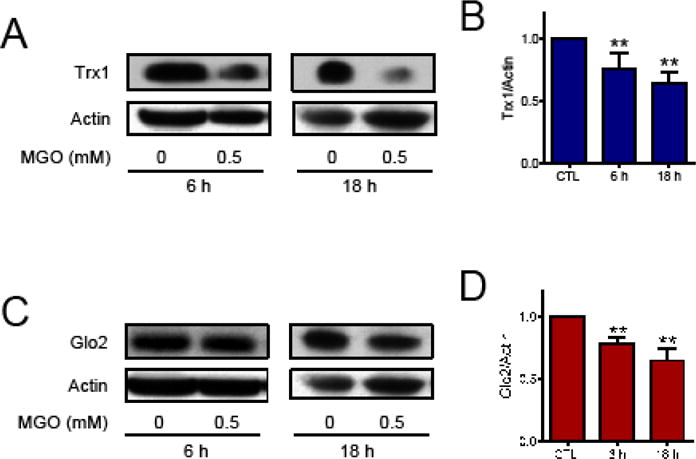
Trx1 and Glo2 proteins in HT22 cells treated with MGO. (A and B) Trx1 and (C and D) Glo2. Representative images (A and C) and quantification (B and D) of Western blots. HT22 cells were treated for 6 or 18 h with 0.5 mM MGO. Statistical significance is presented relative to untreated control as ** p < 0.01 (N = 4–6)
MGO-adduct and ubiquitination of proteins
As shown in Figure 2, after 3 h of treatment there was a marked increase in MGO-protein adducts, which was proportional to the MGO concentration (Fig. 2A). Importantly, the levels of MGO adduct formation appeared to be maximal in the first hours and then presented a tendency to decrease at 6 and 18 h (Fig. 2B and C). However, as the methods used for detection were not exactly the same, a direct comparison is not possible. Additionally, the half-life of MGO in the culture media is around 5 h with ~90% being undetectable at 8 h [9], in agreement with the data presented in Fig. 2 showing that maximal adduct formation occurs within a few hours.
Fig. 2.
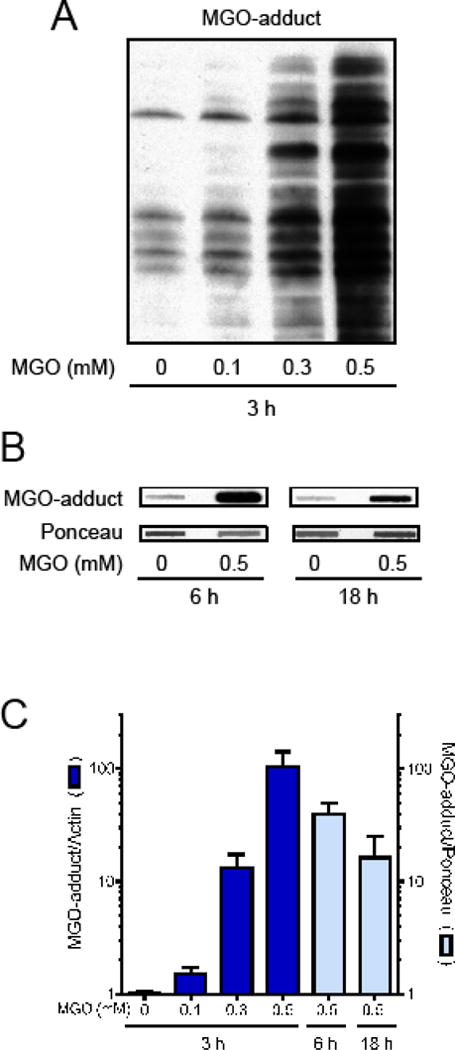
Protein adducts of MGO in HT22 cells. Treatment for 3 (A), 6 or 18 h (B) with MGO induced a dose dependent increase in MGO-adducts in proteins, as evaluated by Western blot (3 h) or slot blot (6 and 18 h). (C) Graph presenting data showed in A and B (N = 4–5).
Damaged proteins are tagged for ubiquitination, and later cleared out by degradative processes, such as the autophagic and proteasomal systems [21,22]. Ubiquitination of proteins can be evaluated by Western blot, as shown in Fig. 3. Interestingly, ubiquitination of proteins was rapidly (1 h) decreased by MGO treatment, returning to basal levels by 3–6 h (Fig. 3A and B). It is known that MGO can react with lysine and arginine residues, which can prevent protein ubiquitination [23–25]. This possibility is in line with data showing that free α-ubiquitin was more abundant shortly after MGO treatment, as detected by an increase in the α-ubiquitin dimer/monomer (Fig. 3C and D). MGO-adducts are unstable, contributing to the appearance of AGEs, which are readily ubiquitinated [3,4]. This idea is consistent with the observed increase in ubiquitinated proteins 18 hours after MGO treatment (Fig. 3A and B).
Fig. 3.

Protein ubiquitination in MGO-treated HT22 cells. (A) Cells were treated for the indicated times and concentrations of MGO, and protein ubiquitination evaluated by Western blot. (B) Graph presenting data showed in A. (C) Representative blot image of ubiquitin monomer and dimer. Position of molecular weight markers are indicated on the right. (D) Sum of α-ubiquitin monomer plus dimer. Statistical significance is presented relative to untreated control as * p < 0.05 or ** p < 0.01 (N = 4–7).
Both autophagy and the proteasome are able to clear ubiquitinated proteins [26,27]. In order to investigate the functionality of both systems, HT22 cells were pre-treated with bafilomycin (BAF) or MG132, autophagy and proteasome inhibitors, respectively. As expected, both inhibitors progressively increased protein ubiquitination over time (Fig. 4). Ubiquitinated proteins were 1.5-fold higher at 1 h (Fig. 4A) and 6 h (Fig. 4B) after BAF treatment. After 18 h, this value increased to 17-fold (Fig. 4C). MG132 was more effective at increasing ubiquitinated proteins, going from 2.6-fold at 1 h, to 8-fold at 6 h and 50-fold at 18 h. MGO did not significantly affect the increases in ubiquitination seen in BAF- or MG132-treated HT22 cells (Fig. 4).
Fig. 4.
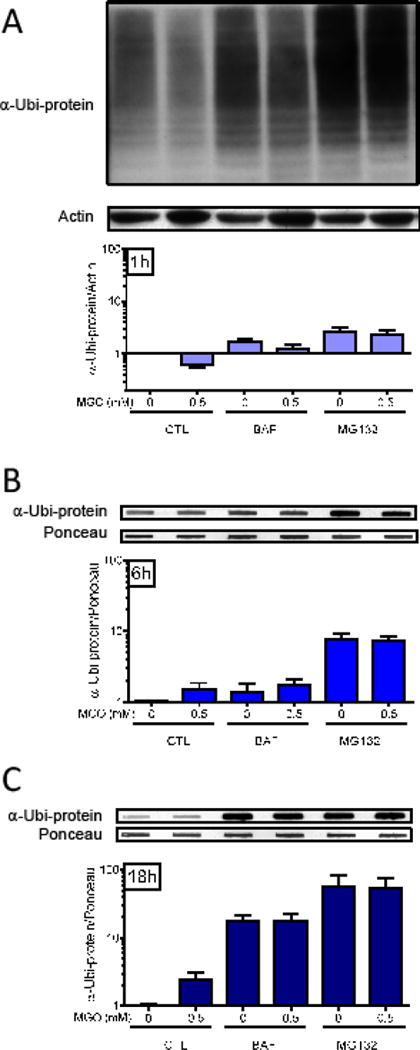
The effect of autophagy and proteasome inhibitors on protein ubiquitination. After a pre-treatment with the autophagy inhibitor bafilomycin A (BAF, 1 μM) or the proteasome inhibitor MG132 (30 μM) for 1 h, HT22 cells were treated with 0.5 mM MGO for 1 (A), 6 (B) or 18 h (C). After electrophoresis (A) or slot blot (B and C), and transference to PVDF membranes, total protein was probed for α-ubiquitin and is presented relative to actin content (A) or Ponceau S (B and C) (N = 3–4).
Effect of MGO treatment on autophagy markers p62 and LC3
Induction of autophagy by MGO has been previously shown for retinal pigment epithelium and endothelial cells [28–30], thus we investigated if MGO could induce autophagic markers in HT22 cells. The expression of the autophagy adaptor protein sequestosome 1 (p62) was altered by MGO treatment (Fig. 5A and C). In the first hour after MGO treatment (0.5 mM), p62 expression was slightly decreased, while at 6 h and 18 h, it was increased by almost 2-fold. We evaluated another autophagic marker, the microtubule-associated protein light chain 3 (LC3; Fig. 5B, D and E). LC3 decreased progressively after MGO treatment, being markedly decreased at 18 h (Fig. 5B and D). Upon autophagy induction, the unmodified form of LC3 (LC3 I) is lipidated, producing a lower band in SDS-PAGE (LC3 II), which is considered an autophagy marker [31]. HT22 cells treated with 0.5 mM MGO for one hour showed a clear increase in the levels of LC3 II (Fig. 5B and E), decreasing progressively with time.
Fig. 5.
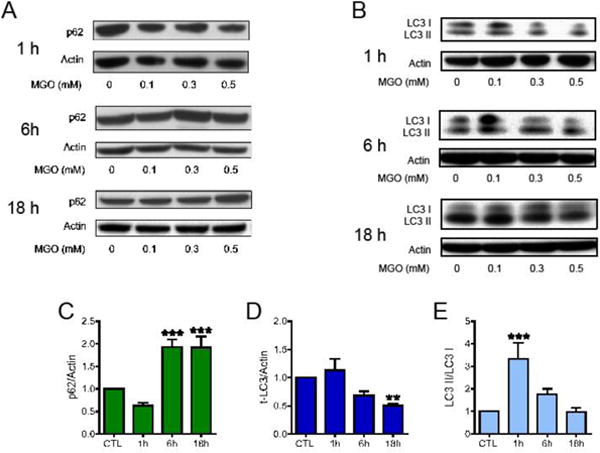
The effects of MGO on autophagy markers. HT22 cells were treated with MGO at the indicated concentrations for the indicated times. Membranes were probed with antibodies to (A) sequestosome (p62), (B) LC3 (LC3-I + LC3-II). Quantification of data relative to 0.5 mM MGO is presented as: (C) p62; (D) total LC3 and (E) the lipidated and active form of LC3 (LC3 II) relative to LC3 I. Statistical significance is presented relative to untreated control as ** p < 0.01 or *** p < 0.001 (N = 5–7).
Autophagy inhibition protects from the MGO-induced decrease in Trx1 and Glo2
We next tested the effects of the autophagy and proteasome inhibitors on the MGO-induced decrease in Trx1 and Glo2 (Fig. 6). Both autophagy inhibitors, BAF and CQ, were able to prevent MGO-induced Trx1 loss at 6 h (Fig. 6A and C) and 18 h (Fig. 6B and D). Similarly, BAF and CQ prevented the decrease in Glo2 expression at 6 h (Fig. 6E and G) and 18 h (Fig. 6F and H). Interestingly, BAF and CQ alone produced an increase in the Glo2 levels at 18 h.
Fig. 6.
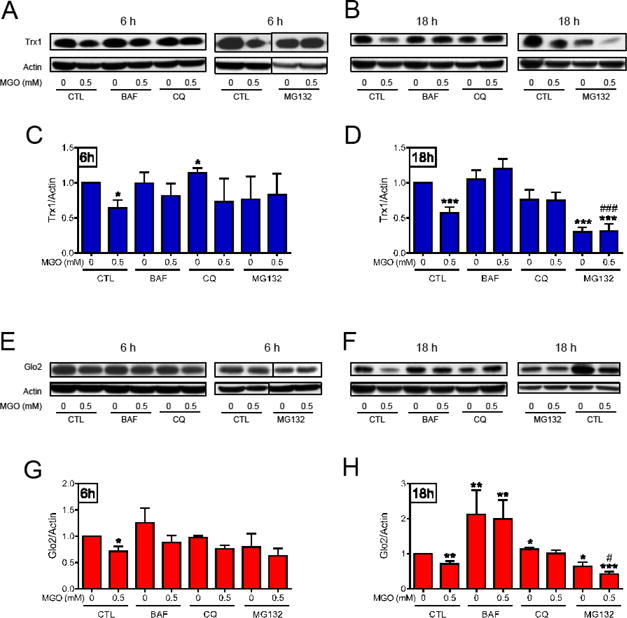
The effect of autophagy and proteasome inhibitors on Trx1 and Glo2 protein levels. After a pre-treatment with the autophagy (BAF, 1 μM and CQ, 10 μM), or the proteasome (MG132, 30 μM) inhibitors, HT22 cells were treated with 0.5 mM MGO for 6 h (A, C, E and G), or 18 h (B, D, F and H) and probed for Trx1 (A – D) and Glo2 (E – H). Statistical significance is presented relative to untreated control (0, CTL) as * p < 0.05, ** p < 0.01, *** p < 0.001, or as compared to MGO-treated control (0.5, CTL) # p < 0.05 or ### p < 0.001 (N = 3–4 at 6h, and N = 5–8 at 18h).
Six hours after MGO treatment, the proteasome inhibitor MG132 was also able to prevent the MGO-dependent decrease in Trx1 (Fig. 6A and C) and Glo2 (Fig. 6E and G). However, at 18 h, MG132 by itself decreased Trx1 and Glo2, and the combination of MGO and MG132 produced a stronger decrease in Trx1 and Glo2, as compared to the effect of MGO alone.
To confirm that the MGO-mediated decrease in Trx1 and Glo2 was dependent on autophagy, ATG5 was knocked down by siRNA (Fig. 7A). ATG5 has an essential role in the complex ubiquitin-like conjugation system 3, and therefore is also essential to autophagy [32]. While MGO treatment for 18 h produced a marked decrease in the levels of Trx1 (Fig. 7B and C) and Glo2 (Fig. 7B and D) in cells treated with control siRNA, the MGO-dependent decrease in Trx1 and Glo2 were not observed in cells treated with ATG5 siRNA, further supporting the idea that these proteins are degraded by autophagy.
Fig. 7.
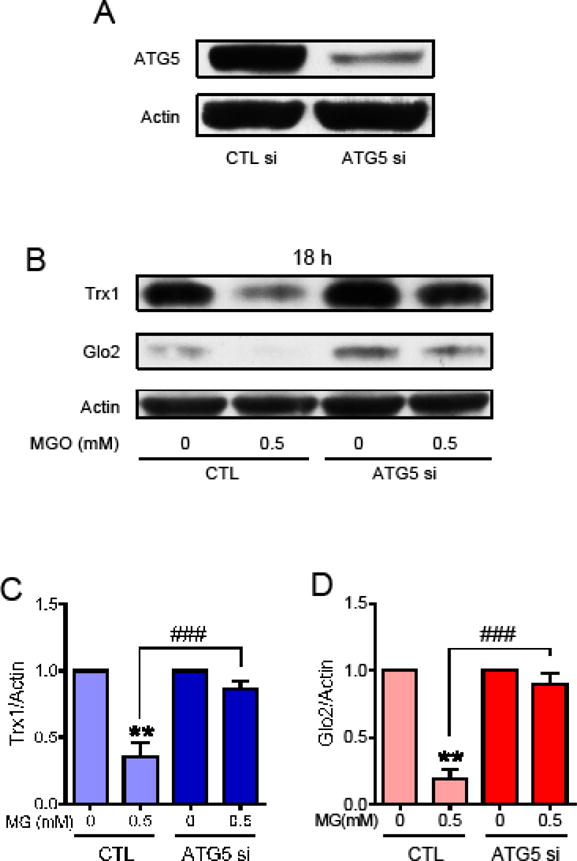
Effect of ATG5 siRNA on Trx1 and Glo2 expression in HT22 cells treated with MGO. (A) The effectiveness of the ATG5 siRNA in decreasing ATG5 protein levels; Trx1 (B and C) and Glo2 (B and D) protein levels were decreased by treatment with 0.5 mM MGO for 18 h in control siRNA treated cells (CTL), but not in the ATG5 siRNA treated cells (ATG5 si). Statistical significance is presented relative to untreated control as ** p < 0.01 relative to CTL; or ### p < 0.001 relative to the difference between control siRNA (CTL) and ATG5 siRNA (ATG5 si) treated with MGO (N = 3).
AMPK-dependent autophagy mediates the effect of MGO on Trx1 and Glo2 abundance
MGO can induce the activation of AMPK [33], a known inducer of autophagy [34]. Therefore, we measured AMPK phosphorylation as a possible mechanism underlying the observed effects of MGO on Trx1 and Glo2. We investigated the MGO effect on AMPK phosphorylation at serine 172, a site that is known to activate AMPK [35,36]. p-AMPK was not altered by MGO at 1 h after treatment, but after 3 h, MGO treatment induced a 10-fold increase in p-AMPK (Fig. 8A and B). The levels of p-AMPK remained elevated at 6 h (3-fold) and 18 h (5-fold) after MGO treatment. The effect of MGO on AMPK phosphorylation was dose dependent at 3, 6 and 18 h of treatment. To confirm that AMPK was activated by MGO treatment, the phosphorylation of an AMPK target, acetyl co-enzyme A carboxylase (ACC), was assessed after 3 h, a time point at which AMPK is maximally phosphorylated. As can be observed in Figure 8C, p-ACC increased progressively as the MGO concentration increased, presenting a 4-fold increase at 0.5 mM MGO. Activation of AMPK also usually results in mTOR inactivation and increased autophagy [37], thus we evaluated if phosphorylation at serine 2448, which is associated with mTOR activation, was decreased in MGO-treated HT22 cells. Figure 8D shows that the abundance of p-mTOR decreased dramatically, being barely detectable 3 h after treatment with 0.5 mM MGO.
Fig. 8.
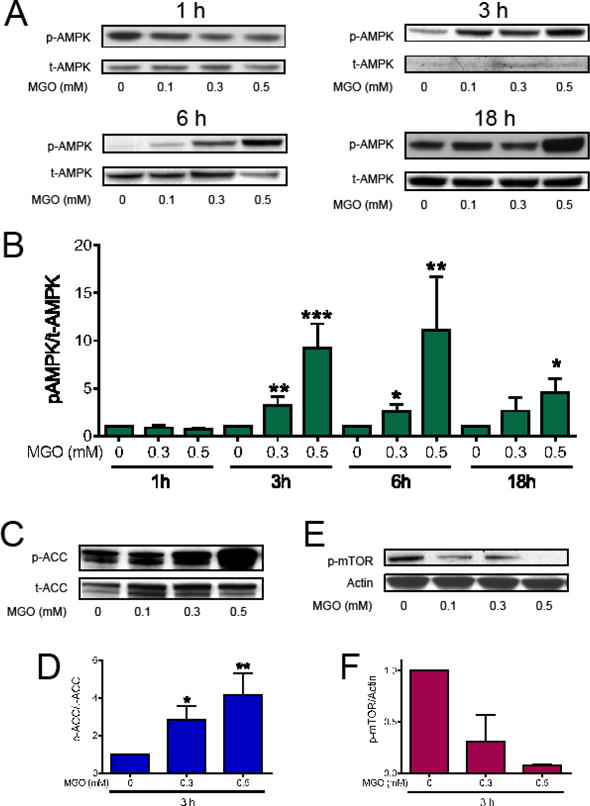
Effects of MGO on the AMPK/mTOR pathway. HT22 cells were treated with MGO for the indicated time points and concentrations. Membranes were probed with antibodies to p-AMPK (A and B); p-ACC (C and D); or p-mTOR (E and F) and expressed relative to α-AMPK, ACC, and actin, respectively. Statistical significance is presented relative to untreated control as * p < 0.05, ** p < 0.01 or *** p < 0.001 (N = 4–7; p-mTOR, N = 2).
To confirm that the MGO-mediated decrease in Trx1 and Glo2 was dependent on AMPK, we treated wild type and AMPK-deficient mouse embryonic fibroblasts (MEFs) with MGO (Fig. 9). MGO treatment for 18 h produced over a 50% decrease in the levels of Trx1 (Fig. 9A and B) and Glo2 (Fig. 9C and D) in wild type MEFs, while both proteins were preserved in the AMPK-deficient MEFs. These results strongly support the hypothesis that AMPK-dependent autophagic degradation of Trx1 and Glo2 is responsible for their loss in MGO-treated HT22 cells.
Fig. 9.

Trx1 and Glo2 expression in wild type and AMPK-deficient MEFs treated with MGO. Trx1 (A and B) and Glo2 (C and D) protein levels were decreased by treatment with 0.5 mM MGO for 18 h in the wild type MEFs (CTL), but not in the AMPK-deficient (AMPK-KO) MEFs. Statistical significance is presented relative to untreated control as * p < 0.05 relative to control MEFs; or # p < 0.05 relative to the difference between AMPK-wild type (CTL) and AMPK-deficient (AMPK-KO) MEFs treated with MGO (N = 3–4).
Discussion
In the present study, we used relatively high but sublethal MGO (0.1 – 0.5 mM) concentrations, in a range broadly found in the literature [16,17,38], with the aim to demonstrate that Trx1 and Glo2 are molecular targets of MGO. Once such targets are identified, further studies with additional, relevant models are needed to further test the hypotheses. Previously we demonstrated that MGO induces a marked decrease in Trx1 and Glo2 protein expression in HT22 nerve cells [9], which was reproduced in this study (Fig. 1). Herein, we investigated if the MGO-induced loss of these proteins is due to degradation by either autophagy or the proteasome.
In order to better understand the temporal profile of MGO-modified proteins, it was found that MGO-adduct formation increases with MGO concentration, peaking at 3 h and decreasing progressively thereafter (6 and 18 h). This profile is compatible with an initial condensation between the MGO carbonyl group and the guanidine atom of the lysine/arginine residues of proteins. Further rearrangements can produce several covalently modified protein adducts, known collectively as AGEs [2,39,40], decreasing the MGO-protein adduct signal over time (Fig. 2) since the MGO antibody only recognizes some of the adducts.
Modified proteins are often targeted for degradation by ubiquitination. At 1 h after MGO treatment, protein ubiquitination was markedly decreased which could not be attributed to a simple lack of substrate (α-ubiquitin) since its levels actually increased at 1 and 3 h after MGO treatment. In fact, it has been reported in the literature that MGO-adduct formation prevents ubiquitination, mostly by reacting with arginine and lysine residues, which are ubiquitination sites [23–25]. Our data showing that global ubiquitination increased at 18 h after MGO treatment is in line with the idea that the proteasome is either inhibited or overloaded. The literature supports both possibilities as AGE-modified proteins are less susceptible to degradation by trypsin and chymotrypsin-like proteasomal activity and there is a reported inhibitory effect of glycation on proteasomal activity [24,41–43].
The increase in global protein ubiquitination after MGO treatment suggests an impairment in proteasome activity, a finding already described in several models exposed to glycating agents such as MGO [24,41,42]. In contrast, MGO induced an increase in the active form of LC3 and a consistent induction of p62, both of which are autophagy markers. It has been previously shown that MGO can induce Nrf2 in HT22 cells [9], and Nrf2 is a known inducer of p62 [44]. Furthermore, MG132 is also a p62 inducer [45]. Altogether, these data are in line with the idea that MGO is good inducer of autophagy, which was already described for retinal pigment epithelium and endothelial cells [28–30].
Thus, we hypothesized that autophagy is responsible for Trx1 and Glo2 loss after MGO treatment. To confirm that Trx1 and Glo2 are degraded by an autophagic route, HT22 cells were exposed to MGO after a pre-treatment with autophagy or proteasome inhibitors. The results revealed that at 6 h both autophagy (BAF and CQ) and proteasome (MG132) inhibitors prevented the MGO-induced decrease in Trx1 and Glo2. At 18 h, BAF and CQ remained effective in preventing MGO-mediated Trx1 and Glo2 loss. Interestingly, basal levels of Trx1 (6 h) and Glo2 (18 h) were even increased by autophagy inhibitors, especially BAF. In contrast, MG132 treatment for 18 h produced a decrease in both Trx1 and Glo2. Given that MG132 increased the levels of LC3 II, total LC3 and p62 (data not shown), and has been considered an autophagy activator [26,27,45], it is reasonable to propose that the degradation of Trx1 and Glo2 is mediated by autophagy. In combination with MGO, the MG132 effect was even higher as compared to the effect of MGO alone, suggesting that the stimulating effects of MGO on autophagy were additive to those due to MG132 treatment. Furthermore, siRNA targeting the essential autophagy protein ATG5 [32], prevented the MGO-induced decrease in Trx1 and Glo2, further supporting the idea that both proteins are degraded by autophagy. MGO-induced decrease in vascular endothelial growth factor receptor 2 was also shown to be mediated by autophagy [29]. A previous work showed the MGO-dependent increase (24 h) in heme oxygenase-1 and glutamate cysteine ligase, TrxR1 and TrxR2 protein abundance [9]. This indicates that the autophagy-mediated decrease in Trx1 and Glo2 is a somewhat specific process. However, more experiments are required to thoroughly address this interesting question.
The marked increase (> 3-fold) in AMPK phosphorylation at 3, 6 and 18 h, after 0.5 mM MGO treatment suggests that autophagy was induced through AMPK activation. This strong AMPK activation was confirmed by increased phosphorylation of ACC, a known AMPK substrate [36]. AMPK phosphorylates and activates the tuberous sclerosis complex that, in turn, phosphorylates the Ras homolog enriched in brain small GTPase, preventing activation of mTOR [34]. Thus, a decrease in mTOR phosphorylation can be taken as further, indirect evidence of AMPK activation, as shown in Figure 8C.
To test if Trx1 and Glo2 degradation is dependent on AMPK, MEFs deficient in AMPK were treated with MGO for 18 h. Similar to the HT22 cells, Trx1 and Glo2 were decreased by MGO treatment in wild type MEFs. AMPK deficient MEFs, however, were insensitive to MGO, maintaining unaltered levels of Trx1 and Glo2 levels.
Normal ageing is associated with a decline in Glo1 expression in rodents and human subjects and increased AGEs formation [46]. There is also evidence showing a decline in the glyoxalase system in neurodegenerative diseases, along with increased AGEs and oxidative stress, which are strictly correlated with MGO levels [47,48]. These findings suggest a central role for AGEs and MGO in ageing and the progression of neurodegenerative diseases. Increased levels of modified proteins can also lead to the formation of aggregates, which are prominent features in age-dependent degenerative diseases [41,47,48]. Dysregulation of autophagy can impair the removal of damaged proteins, which is known to be involved in the pathogenesis of a variety of metabolic and age-related diseases [29,47,49,50].
Trx was shown to be critically important in protecting C. elegans and SH-SY5Y cells in the dopamine model of Parkinson’s disease [51], and was decreased in the galactose model of Alzheimer’s disease [52]. The cellular content of Trx was also decreased in Alzheimer’s patients, presenting a strong correlation with disease severity and therefore considered a good predictor for the conversion of mild cognitive impairment to Alzheimer’s disease [14]. In this regard, MGO can be taken as a potential modifying agent in the progression of age and neurodegenerative diseases, since it is proteotoxic, induces AGEs and impairs the glyoxalase, and the thioredoxin systems, as shown here.
Overall, the presented data show for the first time that autophagy is induced by MGO-dependent activation of AMPK, and that Trx1 and Glo2 are degraded by autophagy as summarized in Figure 10.
Fig. 10.
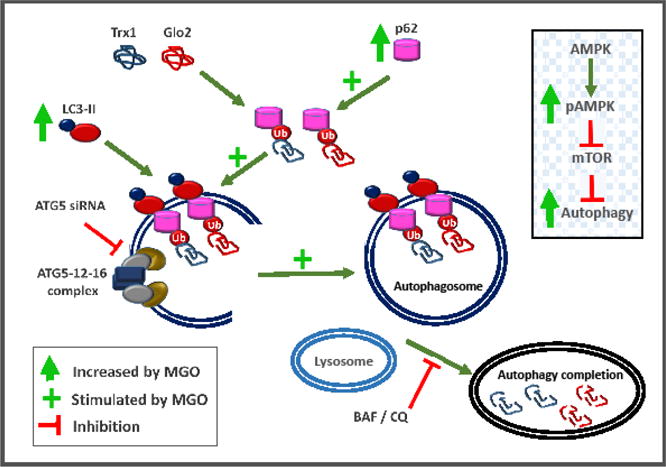
MGO-dependent mechanisms targeting Trx1 and Glo2 for degradation by autophagy. Activated LC3 (LC3 II) mediates membrane elongation by associating with autophagosomal membrane. Membrane-attached LC3-II allows the anchoring of p62 adaptor protein carrying Ub-tagged proteins, possibly Trx1 and Glo2. MGO putatively induces autophagy by increasing the abundance of LC3-II and p62. By binding to LC3-II, p62 facilitates autophagy by localizing in autophagic compartments, and allowing the transport of Ub-proteins and organelles for degradation. The complex ATG5-ATG12-ATG16 is necessary for autophagosome formation. Knockdown of ATG5 impairs the autophagosome formation and Trx1 and Glo2 degradation. The proteasome inhibitor MG132, which is known to activate autophagy [26,27,45], promotes Trx1 and Glo2 loss. Inset: MGO leads to AMPK activation by phosphorylation (p-AMPK), and as indicated by acetyl coenzyme A phosphorylation and mTOR inhibition, thus releasing mTOR’s negative effect on autophagy. AMPK-KO or autophagy inhibitors BAF and CQ prevent MGO-induced Trx1 and Glo2 degradation. Legend: AMPK, 5′ AMP-activated protein kinase; ATG, autophagy related; BAF, bafilomycin; CQ, chloroquine; Glo2, glyoxalase 2; LC3, autophagy marker light chain 3; MGO, methylglyoxal; mTOR mechanistic target of rapamycin; Trx1, thioredoxin 1; Ub, ubiquitin;
Highlights.
Thioredoxin 1 (Trx1) and glyoxalase 2 (Glo2) are decreased by methylglyoxal (MGO)
MGO activates autophagy by increasing p62, active LC3 and by activating AMPK
Bafilomycin or ATG5 knockdown inhibited autophagy, preventing Trx1 and Glo2 loss
Proteasome inhibition by MG132 activates autophagy, leading to Trx1 and Glo2 loss
AMPK-KO MEFs are protected against MGO-induced loss of Trx1 and Glo2
Acknowledgments
ALD is a research fellow of CNPq (National Counsel of Technological and Scientific Development), and awarded a travel grant from CAPES (Coordination for the Improvement of Higher Education Personnel). AES received Ph.D. scholarship and travel grant (Doutorado Sanduíche) from CAPES. This work was supported by NIH grant AG0438 to PM and funding from the Thome Foundation.
Abbreviations
- ACC
acetyl co-enzyme A carboxylase
- AGE
advanced glycation end products
- AMPK
5′ AMP-activated protein kinase
- ATG
autophagy related
- BAF
bafilomycin
- CQ
chloroquine
- DMEM
high-glucose Dulbecco’s modified Eagle medium
- Glo
glyoxalase
- GSH
glutathione
- Hepes
N-(2-hydroxyethyl)-piperazine-N-(2-ethanesulfonic acid)
- LC3
ATG8 or autophagy marker light chain 3
- MEFs
mouse embryonic fibroblasts
- MG132
Z-Leu-Leu-Leu-al
- MGO
methylglyoxal
- mTOR
mechanistic target of rapamycin
- MTT
3-(4,5-dimethylthiazol-2-yl)-2,5-diphenyltetrazolium bromide
- Nrf2
nuclear factor-erythroid 2 p45 related factor 2
- p62
sequestosome
- SDS-PAGE
sodium dodecyl sulfate polyacrylamide gel electrophoresis
- Tris
tris(hidroximetil)aminometano
- Trx
thioredoxin
- TrxR
thioredoxin reductase
- Ubi
ubiquitin
Footnotes
Publisher's Disclaimer: This is a PDF file of an unedited manuscript that has been accepted for publication. As a service to our customers we are providing this early version of the manuscript. The manuscript will undergo copyediting, typesetting, and review of the resulting proof before it is published in its final citable form. Please note that during the production process errors may be discovered which could affect the content, and all legal disclaimers that apply to the journal pertain.
References
- 1.Thornalley PJ, Rabbani N. Glyoxalase in tumourigenesis and multidrug resistance. Semin Cell Dev Biol. 2011;22:318–325. doi: 10.1016/j.semcdb.2011.02.006. [DOI] [PubMed] [Google Scholar]
- 2.Rabbani N, Xue M, Thornalley PJ. Dicarbonyls and glyoxalase in disease mechanisms and clinical therapeutics. Glycoconj J. 2016;33:513–525. doi: 10.1007/s10719-016-9705-z. [DOI] [PMC free article] [PubMed] [Google Scholar]
- 3.Grillo MA, Colombatto S. Advanced glycation end-products (AGEs): involvement in aging and in neurodegenerative diseases. Amino Acids. 2008;35:29–36. doi: 10.1007/s00726-007-0606-0. [DOI] [PubMed] [Google Scholar]
- 4.Jack M, Wright D. Role of advanced glycation endproducts and glyoxalase I in diabetic peripheral sensory neuropathy. Transl Res. 2012;159:355–365. doi: 10.1016/j.trsl.2011.12.004. [DOI] [PMC free article] [PubMed] [Google Scholar]
- 5.Beeri MS, Moshier E, Schmeidler J, Godbold J, Uribarri J, Reddy S, Sano M, Grossman HT, Cai W, Vlassara H, Silverman JM. Serum concentration of an inflammatory glycotoxin, methylglyoxal, is associated with increased cognitive decline in elderly individuals. Mech Ageing Dev. 2011;132:583–587. doi: 10.1016/j.mad.2011.10.007. [DOI] [PMC free article] [PubMed] [Google Scholar]
- 6.Masterjohn C, Park Y, Lee J, Noh SK, Koo SI, Bruno RS. Dietary fructose feeding increases adipose methylglyoxal accumulation in rats in association with low expression and activity of glyoxalase-2. Nutrients. 2013;5:3311–3328. doi: 10.3390/nu5083311. [DOI] [PMC free article] [PubMed] [Google Scholar]
- 7.Xu Y, Chen X. Glyoxalase II, a Detoxifying Enzyme of Glycolysis Byproduct Methylglyoxal and a Target of p63 and p73, Is a Pro-survival Factor of the p53 Family. J Biol Chem. 2006;281:26702–26713. doi: 10.1074/jbc.M604758200. [DOI] [PubMed] [Google Scholar]
- 8.Shin MJ, Kim DW, Lee YP, Ahn EH, Jo HS, Kim DS, Kwon OS, Kang TC, Cho YJ, Park J, Eum WS, Choi SY. Tat-glyoxalase protein inhibits against ischemic neuronal cell damage and ameliorates ischemic injury. Free Radic Biol Med. 2014;67:195–210. doi: 10.1016/j.freeradbiomed.2013.10.815. [DOI] [PubMed] [Google Scholar]
- 9.Dafre AL, Goldberg J, Wang T, Spiegel DA, Maher P. Methylglyoxal, the foe and friend of glyoxalase and Trx/TrxR systems in HT22 nerve cells. Free Radic Biol Med. 2015;89:8–19. doi: 10.1016/j.freeradbiomed.2015.07.005. [DOI] [PMC free article] [PubMed] [Google Scholar]
- 10.García-Giménez JL, Seco-Cervera M, Aguado C, Romá-Mateo C, Dasí F, Priego S, Markovic J, Knecht E, Sanz P, Pallardó FV. Lafora disease fibroblasts exemplify the molecular interdependence between thioredoxin 1 and the proteasome in mammalian cells. Free Radic Biol Med. 2013;65:347–359. doi: 10.1016/j.freeradbiomed.2013.07.001. [DOI] [PubMed] [Google Scholar]
- 11.Lu J, Holmgren A. Thioredoxin system in cell death progression. Antioxid Redox Signal. 2012;17:1738–1747. doi: 10.1089/ars.2012.4650. [DOI] [PubMed] [Google Scholar]
- 12.Cheng Z, Zhang J, Ballou DP, Williams CH. Reactivity of thioredoxin as a protein thiol-disulfide oxidoreductase. Chem Rev. 2011;111:5768–5783. doi: 10.1021/cr100006x. [DOI] [PMC free article] [PubMed] [Google Scholar]
- 13.García-Santamarina S, Boronat S, Hidalgo E. Reversible cysteine oxidation in hydrogen peroxide sensing and signal transduction. Biochemistry (Mosc) 2014;53:2560–2580. doi: 10.1021/bi401700f. [DOI] [PubMed] [Google Scholar]
- 14.Arodin L, Lamparter H, Karlsson H, Nennesmo I, Björnstedt M, Schröder J, Fernandes AP. Alteration of thioredoxin and glutaredoxin in the progression of Alzheimer’s disease. J Alzheimers Dis JAD. 2014;39:787–797. doi: 10.3233/JAD-131814. [DOI] [PubMed] [Google Scholar]
- 15.Wang XL, Lau WB, Yuan YX, Wang YJ, Yi W, Christopher TA, Lopez BL, Liu HR, Ma XL. Methylglyoxal increases cardiomyocyte ischemia-reperfusion injury via glycative inhibition of thioredoxin activity. Am J Physiol - Endocrinol Metab. 2010;299:E207–E214. doi: 10.1152/ajpendo.00215.2010. [DOI] [PMC free article] [PubMed] [Google Scholar]
- 16.Tatsunami R, Oba T, Takahashi K, Tampo Y. Methylglyoxal causes dysfunction of thioredoxin and thioredoxin reductase in endothelial cells. J Pharmacol Sci. 2009;111:426–432. doi: 10.1254/jphs.09131FP. [DOI] [PubMed] [Google Scholar]
- 17.Oba T, Tatsunami R, Sato K, Takahashi K, Hao Z, Tampo Y. Methylglyoxal has deleterious effects on thioredoxin in human aortic endothelial cells. Environ Toxicol Pharmacol. 2012;34:117–126. doi: 10.1016/j.etap.2012.03.007. [DOI] [PubMed] [Google Scholar]
- 18.Lewerenz J, Albrecht P, Tien MLT, Henke N, Karumbayaram S, Kornblum HI, Wiedau-Pazos M, Schubert D, Maher P, Methner A. Induction of Nrf2 and xCT are involved in the action of the neuroprotective antibiotic ceftriaxone in vitro. J Neurochem. 2009;111:332–343. doi: 10.1111/j.1471-4159.2009.06347.x. [DOI] [PubMed] [Google Scholar]
- 19.Maher P, Lewerenz J, Lozano C, Torres JL. A novel approach to enhancing cellular glutathione levels. J Neurochem. 2008;107:690–700. doi: 10.1111/j.1471-4159.2008.05620.x. [DOI] [PMC free article] [PubMed] [Google Scholar]
- 20.Ehren JL, Maher P. Concurrent regulation of the transcription factors Nrf2 and ATF4 mediates the enhancement of glutathione levels by the flavonoid fisetin. Biochem Pharmacol. 2013;85:1816–1826. doi: 10.1016/j.bcp.2013.04.010. [DOI] [PubMed] [Google Scholar]
- 21.Herhaus L, Dikic I. Expanding the ubiquitin code through post-translational modification. EMBO Rep. 2015;16:1071–1083. doi: 10.15252/embr.201540891. [DOI] [PMC free article] [PubMed] [Google Scholar]
- 22.Lippai M, Lőw P. The role of the selective adaptor p62 and ubiquitin-like proteins in autophagy. BioMed Res Int. 2014;2014:832704. doi: 10.1155/2014/832704. [DOI] [PMC free article] [PubMed] [Google Scholar]
- 23.Takizawa N, Takada K, Ohkawa K. Inhibitory effect of nonenzymatic glycation on ubiquitination and ubiquitin-mediated degradation of lysozyme. Biochem Biophys Res Commun. 1993;192:700–706. doi: 10.1006/bbrc.1993.1471. [DOI] [PubMed] [Google Scholar]
- 24.Uchiki T, Weikel KA, Jiao W, Shang F, Caceres A, Pawlak D, Handa JT, Brownlee M, Nagaraj R, Taylor A. Glycation-altered proteolysis as a pathobiologic mechanism that links dietary glycemic index, aging, and age-related disease (in non diabetics) Aging Cell. 2012;11:1–13. doi: 10.1111/j.1474-9726.2011.00752.x. [DOI] [PMC free article] [PubMed] [Google Scholar]
- 25.K S, R S, H L, A S, G X, M G, G M, S V, A H. Advanced glycated albumin impairs protein degradation in the kidney proximal tubules cell line LLC-PK1. Cell Mol Biol Noisy–Gd Fr. 1998;44:1051–1060. [PubMed] [Google Scholar]
- 26.Bao W, Gu Y, Ta L, Wang K, Xu Z. Induction of autophagy by the MG‑ 132 proteasome inhibitor is associated with endoplasmic reticulum stress in MCF‑ 7 cells. Mol Med Rep. 2016;13:796–804. doi: 10.3892/mmr.2015.4599. [DOI] [PubMed] [Google Scholar]
- 27.Zhan J, He J, Zhou Y, Wu M, Liu Y, Shang F, Zhang X. Crosstalk Between the Autophagy-Lysosome Pathway and the Ubiquitin-Proteasome Pathway in Retinal Pigment Epithelial Cells. Curr Mol Med. 2016;16:487–495. doi: 10.2174/1566524016666160429121606. [DOI] [PubMed] [Google Scholar]
- 28.Chang YC, Hsieh MC, Wu HJ, Wu WC, Kao YH. Methylglyoxal, a reactive glucose metabolite, enhances autophagy flux and suppresses proliferation of human retinal pigment epithelial ARPE-19 cells. Toxicol In Vitro. 2015;29:1358–1368. doi: 10.1016/j.tiv.2015.05.014. [DOI] [PubMed] [Google Scholar]
- 29.Liu H, Yu S, Zhang H, Xu J. Angiogenesis impairment in diabetes: Role of methylglyoxal-induced receptor for advanced glycation endproducts, autophagy and vascular endothelial growth factor receptor 2. PLoS ONE. 2012;7:e46720. doi: 10.1371/journal.pone.0046720. [DOI] [PMC free article] [PubMed] [Google Scholar] [Retracted]
- 30.Fang L, Li X, Zhong Y, Yu J, Yu L, Dai H, Yan M. Autophagy protects human brain microvascular endothelial cells against methylglyoxal-induced injuries, reproducible in a cerebral ischemic model in diabetic rats. J Neurochem. 2015:n/a–n/a. doi: 10.1111/jnc.13277. [DOI] [PubMed] [Google Scholar]
- 31.Kim KH, Lee MS. Autophagy—a key player in cellular and body metabolism. Nat Rev Endocrinol. 2014;10:322–337. doi: 10.1038/nrendo.2014.35. [DOI] [PubMed] [Google Scholar]
- 32.Noda NN, Inagaki F. Mechanisms of autophagy. Annu Rev Biophys. 2015;44:101–122. doi: 10.1146/annurev-biophys-060414-034248. [DOI] [PubMed] [Google Scholar]
- 33.Chang TJ, Tseng HC, Liu MW, Chang YC, Hsieh ML, Chuang LM. Glucagon-like peptide-1 prevents methylglyoxal-induced apoptosis of beta cells through improving mitochondrial function and suppressing prolonged AMPK activation. Sci Rep. 2016;6 doi: 10.1038/srep23403. [DOI] [PMC free article] [PubMed] [Google Scholar]
- 34.Kim J, Kundu M, Viollet B, Guan KL. AMPK and mTOR regulate autophagy through direct phosphorylation of Ulk1. Nat Cell Biol. 2011;13:132–141. doi: 10.1038/ncb2152. [DOI] [PMC free article] [PubMed] [Google Scholar]
- 35.Hardie DG. AMPK: a key regulator of energy balance in the single cell and the whole organism. Int J Obes 2005. 2008;32(Suppl 4):S7–12. doi: 10.1038/ijo.2008.116. [DOI] [PubMed] [Google Scholar]
- 36.Xue B, Kahn BB. AMPK integrates nutrient and hormonal signals to regulate food intake and energy balance through effects in the hypothalamus and peripheral tissues. J Physiol. 2006;574:73–83. doi: 10.1113/jphysiol.2006.113217. [DOI] [PMC free article] [PubMed] [Google Scholar]
- 37.Dunlop EA, Tee AR. mTOR and autophagy: A dynamic relationship governed by nutrients and energy. Semin Cell Dev Biol. 2014;36:121–129. doi: 10.1016/j.semcdb.2014.08.006. [DOI] [PubMed] [Google Scholar]
- 38.Bélanger M, Yang J, Petit J-M, Laroche T, Magistretti PJ, Allaman I. Role of the glyoxalase gystem in astrocyte-mediated neuroprotection. J Neurosci. 2011;31:18338–18352. doi: 10.1523/JNEUROSCI.1249-11.2011. [DOI] [PMC free article] [PubMed] [Google Scholar]
- 39.Vistoli G, De Maddis D, Cipak A, Zarkovic N, Carini M, Aldini G. Advanced glycoxidation and lipoxidation end products (AGEs and ALEs): an overview of their mechanisms of formation. Free Radic Res. 2013;47:3–27. doi: 10.3109/10715762.2013.815348. [DOI] [PubMed] [Google Scholar]
- 40.Aldini G, Carini M, Yeum KJ, Vistoli G. Novel molecular approaches for improving enzymatic and nonenzymatic detoxification of 4-hydroxynonenal: toward the discovery of a novel class of bioactive compounds. Free Radic Biol Med. 2014;69:145–156. doi: 10.1016/j.freeradbiomed.2014.01.017. [DOI] [PubMed] [Google Scholar]
- 41.Queisser MA, Yao D, Geisler S, Hammes HP, Lochnit G, Schleicher ED, Brownlee M, Preissner KT. Hyperglycemia impairs proteasome function by methylglyoxal. Diabetes. 2010;59:670–678. doi: 10.2337/db08-1565. [DOI] [PMC free article] [PubMed] [Google Scholar]
- 42.Bulteau AL, Verbeke P, Petropoulos I, Chaffotte AF, Friguet B. Proteasome Inhibition in Glyoxal-treated Fibroblasts and Resistance of Glycated Glucose-6-phosphate Dehydrogenase to 20 S Proteasome Degradation in Vitro. J Biol Chem. 2001;276:45662–45668. doi: 10.1074/jbc.M105374200. [DOI] [PubMed] [Google Scholar]
- 43.Kapphahn RJ, Bigelow EJ, Ferrington DA. Age-dependent inhibition of proteasome chymotrypsin-like activity in the retina. Exp Eye Res. 2007;84:646–654. doi: 10.1016/j.exer.2006.12.002. [DOI] [PMC free article] [PubMed] [Google Scholar]
- 44.Ichimura Y, Waguri S, Sou Y, Kageyama S, Hasegawa J, Ishimura R, Saito T, Yang Y, Kouno T, Fukutomi T, Hoshii T, Hirao A, Takagi K, Mizushima T, Motohashi H, Lee MS, Yoshimori T, Tanaka K, Yamamoto M, Komatsu M. Phosphorylation of p62 activates the Keap1-Nrf2 pathway during selective autophagy. Mol Cell. 2013;51:618–631. doi: 10.1016/j.molcel.2013.08.003. [DOI] [PubMed] [Google Scholar]
- 45.Cui W, Bai Y, Luo P, Miao L, Cai L. Preventive and therapeutic effects of MG132 by activating Nrf2-ARE signaling pathway on oxidative stress-induced cardiovascular and renal injury. Oxid Med Cell Longev. 2013;2013:e306073. doi: 10.1155/2013/306073. [DOI] [PMC free article] [PubMed] [Google Scholar]
- 46.Xue M, Rabbani N, Thornalley PJ. Glyoxalase in ageing, Semin. Cell Dev Biol. 2011;22:293–301. doi: 10.1016/j.semcdb.2011.02.013. [DOI] [PubMed] [Google Scholar]
- 47.Angeloni C, Zambonin L, Hrelia S. Role of methylglyoxal in Alzheimer’s disease. BioMed Res Int. 2014;2014:e238485. doi: 10.1155/2014/238485. [DOI] [PMC free article] [PubMed] [Google Scholar]
- 48.Krautwald M, Münch G. Advanced glycation end products as biomarkers and gerontotoxins – A basis to explore methylglyoxal-lowering agents for Alzheimer’s disease? Exp Gerontol. 2010;45:744–751. doi: 10.1016/j.exger.2010.03.001. [DOI] [PubMed] [Google Scholar]
- 49.Lenoir O, Tharaux PL, Huber TB. Autophagy in kidney disease and aging: lessons from rodent models. Kidney Int. 2016;90:950–964. doi: 10.1016/j.kint.2016.04.014. [DOI] [PubMed] [Google Scholar]
- 50.Filomeni G, De Zio D, Cecconi F. Oxidative stress and autophagy: the clash between damage and metabolic needs. Cell Death Differ. 2014 doi: 10.1038/cdd.2014.150. [DOI] [PMC free article] [PubMed] [Google Scholar]
- 51.Arodin L, Miranda-Vizuete A, Swoboda P, Fernandes AP. Protective effects of the thioredoxin and glutaredoxin systems in dopamine-induced cell death. Free Radic Biol Med. 2014;73:328–336. doi: 10.1016/j.freeradbiomed.2014.05.011. [DOI] [PubMed] [Google Scholar]
- 52.Gao J, He H, Jiang W, Chang X, Zhu L, Luo F, Zhou R, Ma C, Yan T. Salidroside ameliorates cognitive impairment in a d-galactose-induced rat model of Alzheimer’s disease. Behav Brain Res. 2015;293:27–33. doi: 10.1016/j.bbr.2015.06.045. [DOI] [PubMed] [Google Scholar]