

Summary
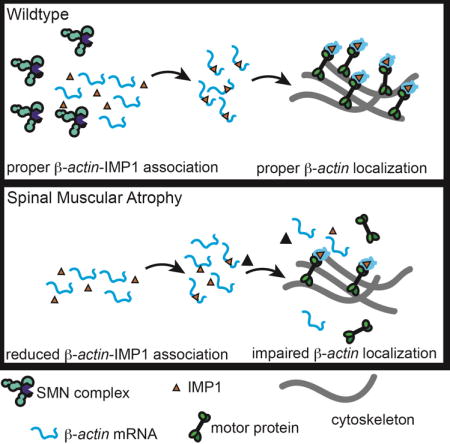
Spinal muscular atrophy (SMA) is a motor neuron disease caused by reduced levels of the survival of motor neuron (SMN) protein. SMN is part of a multiprotein complex that facilitates the assembly of spliceosomal small nuclear ribonucleoproteins (snRNPs). SMN has also been found to associate with mRNA binding proteins but the nature of this association was unknown. Here we have employed a combination of biochemical and advanced imaging methods to demonstrate that SMN promotes the molecular interaction between IMP1 protein and the 3′ UTR zipcode region of β-actin mRNA, leading to assembly of messenger ribonucleoprotein complexes (mRNPs) that associate with the cytoskeleton to facilitate trafficking. We have identified defects in mRNP assembly in cells and tissues from SMA disease models and patients that depend on the SMN Tudor domain and explain the observed deficiency in mRNA localization and local translation, providing insight into SMA pathogenesis as an RNP-assembly disorder.
eTOC Blurb
Donlin-Asp et al. show that in both a murine model of spinal muscular atrophy and human patient samples the association of IMP1 protein with β-actin mRNA is impaired. These results support a role for the survival of motor neuron (SMN) protein as a molecular chaperone for mRNP assembly.
Introduction
Spinal muscular atrophy (SMA) is the leading genetic cause of infant mortality (Prior, 2010). SMA is characterized by synaptic defects in the motor circuitry, especially at the neuromuscular junction (NMJ), and a dying-back axonopathy. This is followed by a gradual loss of motor neurons in the spinal cord, and results in progressive muscle weakness and eventual death due to respiratory distress (Phan et al., 2015). SMA is caused by reduced survival of motor neuron (SMN) protein levels due to either a deletion or mutation in the SMN1 gene. The ubiquitously expressed SMN protein is vital for normal cellular function, with complete loss of SMN in mice leading to early embryonic lethality (Schrank et al., 1997). In SMA patients, cells produce reduced levels of normal SMN protein from a duplication of the SMN encoding gene, SMN2 (Lorson et al., 1999). The mechanism underlying the higher sensitivity of motor neurons to reduced SMN protein levels remains unclear (Burghes and Beattie, 2009; Fallini et al., 2012; Li et al., 2014) (Donlin-Asp et al., 2016). SMN and its associated Gemin2-8 proteins function as a molecular chaperone, interacting with and assisting in the assembly of Sm proteins and snRNAs into spliceosomal snRNP complexes without being part of its final structure (Li et al., 2014). Consistent with the role of SMN in snRNP assembly, splicing defects have been described in a number of SMA models (Baumer et al., 2009; Custer et al., 2016; Gabanella et al., 2007; Garcia et al., 2016; Praveen et al., 2012; See et al., 2014; Zhang et al., 2013). However, these defects are found ubiquitously throughout various tissues (Doktor et al., 2016; Shababi et al., 2014) suggesting additional pathways might contribute to the pathophysiology of SMA. We and others have previously shown SMA-specific defects in the axonal localization of polyA mRNA and selected transcripts (β-actin, Gap43, neuritin) (Akten et al., 2011; Fallini et al., 2010; Fallini et al., 2016; Fallini et al., 2011; Rossoll et al., 2003) as well as mRNA-binding proteins (HuD, IMP1) (Akten et al., 2011; Fallini et al., 2014; Fallini et al., 2011; Hubers et al., 2011) in SMN-deficient motor neurons. We have also found that overexpression of both HuD and IMP1 can restore axon outgrowth and Gap43 mRNA and protein localization in growth cones of SMA motor neurons (Fallini et al., 2016). Our findings led us to hypothesize that analogous to its role in snRNP assembly, SMN plays a critical role in the assembly of messenger ribonucleoproteins (mRNPs), and that the reported mRNA localization defects in SMA motor neurons may be caused by a failure to assemble RNA transport complexes (Donlin-Asp et al., 2016).
To test this hypothesis, we have employed a combination of genetic reporters, biochemical fractionations, pull-down assays, and superresolution microscopy methods to quantify the association of specific mRNAs and proteins in mRNP complexes. We consistently found defects in mRNP assembly in cells and tissues from SMA disease models and patients. SMN deficiency leads to reduced binding of mRBPs to their transcripts, the assembly of smaller mRNP granules, and their reduced association with microtubules and actin filaments. Taken together, our data demonstrate that SMN plays a role as a molecular chaperone for mRNPs, indicating that SMN-dependent mRNP-assembly defects cause axonal mRNA localization defects in SMA.
Results
Association of IMP1 protein with the 3′UTR of β-actin mRNA is impaired in cultured motor neurons from an SMA mouse model
To establish a reporter assay for SMN-dependent assembly of mRNP complexes, in which we could eliminate any direct effect from defects in splicing, we focused on the association of the β-actin 3′ untranslated region (3′UTR) with its interacting protein, the Igf2-mRNA binding protein 1 or zipcode-binding protein 1 (IMP1/ZBP1) (Deshler et al., 1998; Ross et al., 1997). We have previously reported that IMP1 and SMN associate, and that reduced SMN levels cause impaired axonal localization of IMP1 in cultured primary motor neurons (Fallini et al., 2014). Importantly, the IMP1–β-actin interaction is well characterized, and known to be mediated through a sequence element in the 3′UTR of β-actin (“zipcode”) and the mRNA-binding KH-domains of IMP1 (Chao et al., 2010; Farina et al., 2003; Patel et al., 2012).
To study the formation of IMP1–β-actin mRNP complexes, we employed Trimolecular Fluorescence Complementation (TriFC) (Milev et al., 2010; Rackham and Brown, 2004; Yin et al., 2013) as a direct in situ method to visualize their association in cells. This technique is a variation of bimolecular fluorescence complementation (BiFC) (Hu et al., 2006; Kerppola, 2013). TriFC measures the binding of an mRNA-binding protein to its target transcript. TriFC uses a set of three reporter constructs including two mRNA-binding proteins fused to split venus yellow fluorescent protein, which upon binding to the same engineered mRNA reporter construct restore the fluorescent venus signal. The mRNA reporter construct encodes cyan fluorescent protein (CFP) followed by a boxB stem loop sequence and the β-actin 3′UTR. The bacteriophage protein λN22 fused to the N-terminal fragment of venus yellow fluorescent protein (YFP) is tethered to the reporter mRNA by binding the boxB motif. When IMP1 fused to the C-terminal fragment of YFP binds the β-actin 3-UTR, it can reconstitute a fluorescent YFP molecule together with the λN22 fusion protein and thus the strength of the signal can be used to measure in situ RNA–protein interaction (Figure 1A,B). Since the TriFC constructs are expressed as cDNAs, their maturation and translation in the cell will not be dependent on splicing, and therefore remain unaffected by SMN-dependent splicing defects. We found that the TriFC signal in primary cultured motor neurons was specific for the Full UTR construct and required both the BoxB motif and the full-length β-actin 3′UTR (Figure 1C–E). Importantly, we observe granular signal in the axon, which is reminiscent of fluorescent in situ hybridization signal for β-actin mRNA (Bassell et al., 1998; Fallini et al., 2016; Yao et al., 2006; Zhang et al., 1999). The weak signal for both the no UTR and the ΔBoxB control constructs illustrates the low background generated from IMP1 and λN22 outside of binding to the same mRNA molecule, highlighting the specificity of the TriFC methodology. The ΔZip construct shows more signal than the background levels in the ΔBoxB and no UTR constructs but less than the Full UTR construct. This is consistent with previous results demonstrating a homologous but less active secondary site downstream of the proximal zipcode motif that shows weak ability to localize β-actin (Kislauskis et al., 1994).
Figure 1.
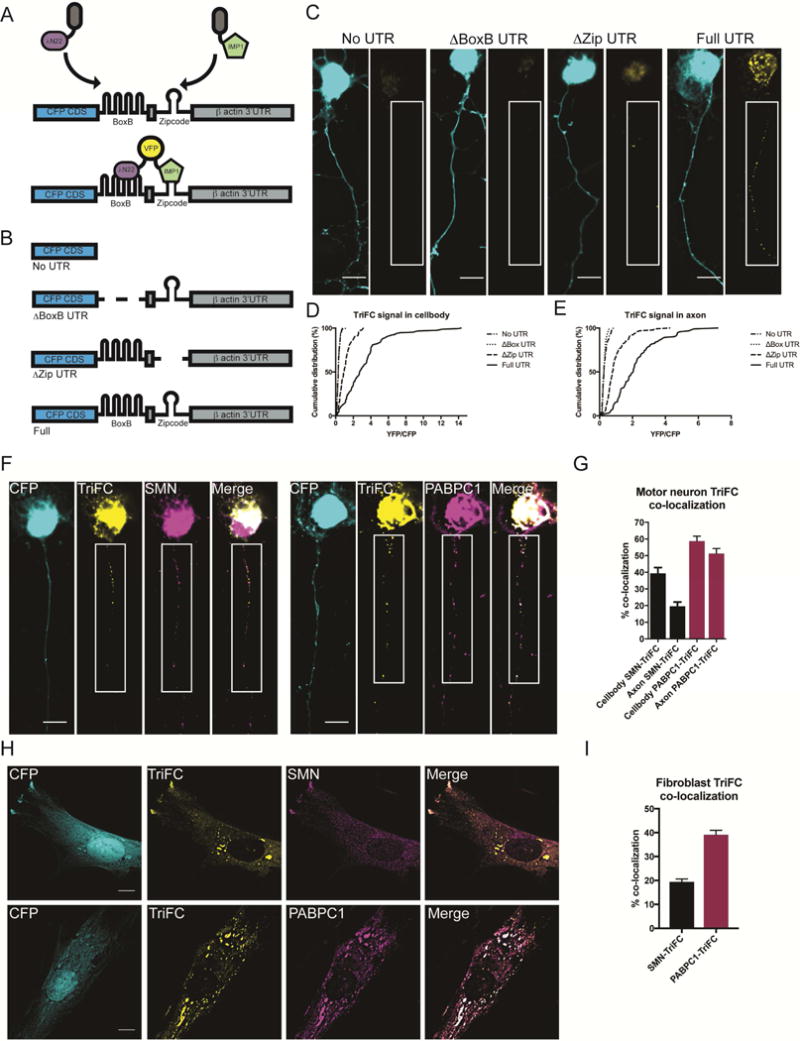
Trimolecular Fluorescence Complementation (TriFC) allows visualization of RNA and protein association in situ. A. Schematic of TriFC methodology. Upon expression of IMP1 and λN22 fused to complimentary fragments of venus yellow fluorescent protein, only binding of both fusion proteins to the same mRNA reporter will lead to reconstitution of the fluorescent protein. B. Reporter constructs include the entire β-actin 3′ untranslated region (Full UTR), a negative control lacking the 3′UTR (no UTR), a control lacking the binding site for the bacteriophage RNA-binding protein λN22 binding site (ΔBoxB UTR), and one lacking the main IMP1-binding “zipcode” region (ΔZip UTR.). C. Example images of TriFC controls in primary murine motor neurons. YFP intensities were normalized in all examples. For axonal segments in white boxes brightness and contrast were enhanced to highlight axonal granule signal (insets). Scale bar = 10 μm. D. Quantification of YFP/CFP signals for the cell body. Analyzed by Tukey’s multiple comparisons, for breakdown of statistical comparisons see Table S1. N=5, >50 cells/condition. Mean ± SEM; No UTR: .319 ± .0190, ΔBox UTR: .314 ±. 015, ΔZip UTR: 1.10 ± .076, Full UTR: 3.22 ± .209. E. Quantification of YFP/CFP signals for the axon. Analyzed by Tukey’s multiple comparisons, for breakdown of statistical comparisons see Table S2. N=5, >50 cells/condition. Mean ± SEM; No UTR: .311 ± .018, ΔBox UTR: .277 ± .011, ΔZip UTR: .990 ± .073, Full UTR: 2.24 ± .141. F. Example images of TriFC signal localization relative to SMN (left) or PABPC1 (right) in primary murine motor neurons. For enlarged axonal segments in white boxes, brightness and contrast were enhanced to highlight axonal granule signal (insets). Scale bar = 10 μm. G. Quantification of co-localization of TriFC signal with SMN and PABPC1 for the axon and cell body. N=4, >40 cells/condition. Mean ± SEM; Cell body SMN-TriFC: 39.39% ± 3.454%, Axon SMN-TriFC: 19.6% ± 2.531%, Cell body PABPC1-TriFC: 58.77% ± 2.944%, Axon PABPC1- TriFC: 51.26% ± 3.012%. H. Example images of TriFC signal localization relative to SMN (top) or PABPC1 (bottom) in primary human fibroblasts. Scale bar = 10 μm. I. Quantification of co-localization of TriFC signal with SMN and PABPC1. N=3, 50 cells/condition. Mean ± SEM; SMN-TriFC: 19.44% ± 1.221%, PABPC1-TriFC: 39.09% ± 1.892%.
Utilizing TriFC, we next sought to address what was the spatiotemporal relationship of SMN to assembled IMP1–β-actin complexes. If SMN is indeed a chaperone for mRNP assembly, it will not remain part of the final assembled complex. To test this, we compared the co-localization of TriFC signal with SMN to that of TriFC signal with PABPC1, a poly(A) mRNA binding protein, which is a stable component of mRNP granules (Figure 1F–I). In primary motor neurons, PABPC1 shows strong co-localization with the TriFC signal in both the cell body and axon (Figure 1F–G). In comparison, SMN shows weaker co-localization with TriFC granules in the cell body (Figure 1F–G), where these complexes are initially assembled, but even lower levels of co-localization in the axon. In primary human fibroblasts the same trend is observed (Figure 1H–I), with PABPC1 showing robust co-localization with the TriFC signal, unlike the signal for SMN. These data are consistent with a role for SMN as a molecular chaperone for IMP1–β-actin complex assembly.
To determine whether the IMP1–β-actin association is SMN-dependent, we employed this TriFC assay in motor neurons derived from a severe SMA mouse model (Monani et al., 2000). We observed a clear deficiency in the assembly of IMP1–β-actin complexes in SMA motor neurons (Figure 2A,B). Importantly, as the cellular production of the TriFC components does not directly depend on splicing, this defect in assembly of IMP1–β-actin complexes in SMA motor neurons is uncoupled from defective snRNP assembly. To provide biochemical evidence for impaired mRNP assembly, we performed RNA immunoprecipitation against IMP1 from embryonic brain lysates followed by qRT-PCR and found a similar reduction in the association of β-actin with IMP1 in SMA embryos (Figure 2C). Importantly, there is no change in steady state levels of either β-actin mRNA or IMP1 protein levels (Figure 2E,F), when SMN protein levels are reduced, suggesting a specific reduction in IMP1–β-actin association. Taken together, all of these data demonstrate an impairment of IMP1–β-actin association in SMA motor neurons and brain tissue, consistent with a role of SMN in the assembly of mRNP complexes.
Figure 2.
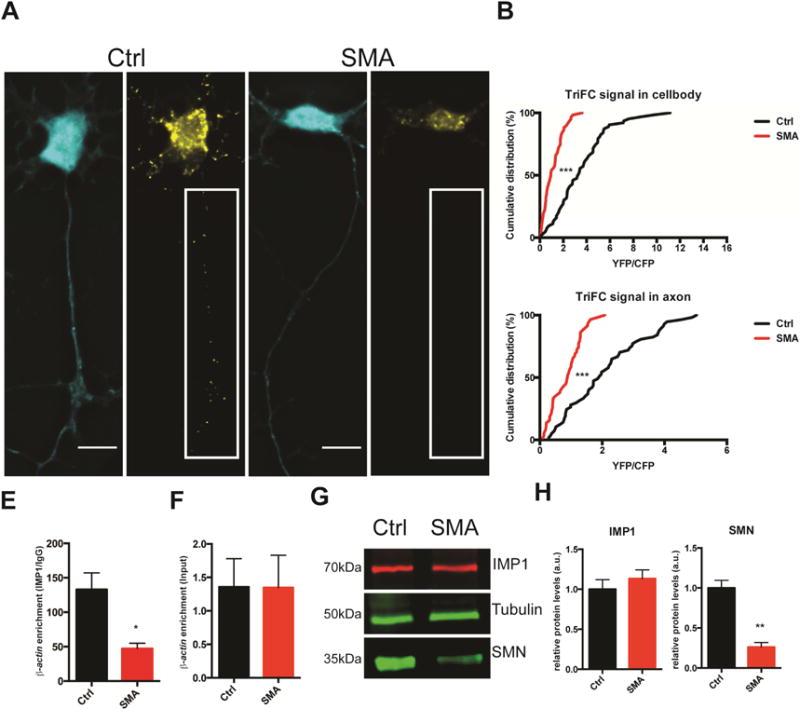
IMP1 and β-actin association is reduced in an SMA mouse model. A. TriFC in SMA motor neurons show reduced IMP1–β-actin granule assembly relative to wild type littermate controls. Scale bar =10 μm. B. Quantification of cell body and axonal TriFC signal. n=3, >50 cells/condition. Analyzed by Kolmogrov-Smirnov test, p<.0001. Cell body values mean ± SEM; Ctrl: 3.555 ± .288, SMA: 1.130 ± .108; axon values for mean ± SEM; Ctrl: 2.098 ± .169, SMA: .851 ± .065. C. RNA-immunoprecipitation with anti-IMP1 antibodies from embryonic brain lysate shows reduced association with β-actin mRNA in SMA brain lysate versus littermate controls. n=3, analyzed by Student T-test, p<0.05. Error bars +/− SEM. Mean ± SEM; Ctrl: 132.9 ± 24.12, SMA: 47.22 ± 7.74. D. Input levels of β-actin mRNA are unchanged. Error bars +/− SEM. Mean ± SEM; Ctrl: 1.357 ± .423, SMA: 1.343 ± .483; p= .989. E. IMP1 protein levels also remain unchanged, whereas SMN levels are significantly reduced. F. Quantification of E, n=3, analyzed by Student T-test, p<.01. Error bars +/− SEM. IMP1 protein levels mean ± SEM; Ctrl: 1.00 ± .120, SMA: 1.134 ± .108; p= .454; SMN protein levels mean ± SEM; Ctrl: 1.00 ± .096, SMA: .262 ± .0561; p= .003.
IMP1 mRNP granules show assembly defects and reduced size in SMA patient fibroblasts
We next sought to address if the IMP1–β-actin association defect is present in human SMA patient cells. We performed TriFC experiments in four SMA and four control primary fibroblast lines (Figure 3A,B) and found a clear deficiency in the assembly of these IMP1–β-actin complexes in all SMA patient lines. These data confirm our results from murine SMA motor neurons, and demonstrate that the splicing-independent IMP1–β-actin assembly defect is conserved in human patient samples.
Figure 3.
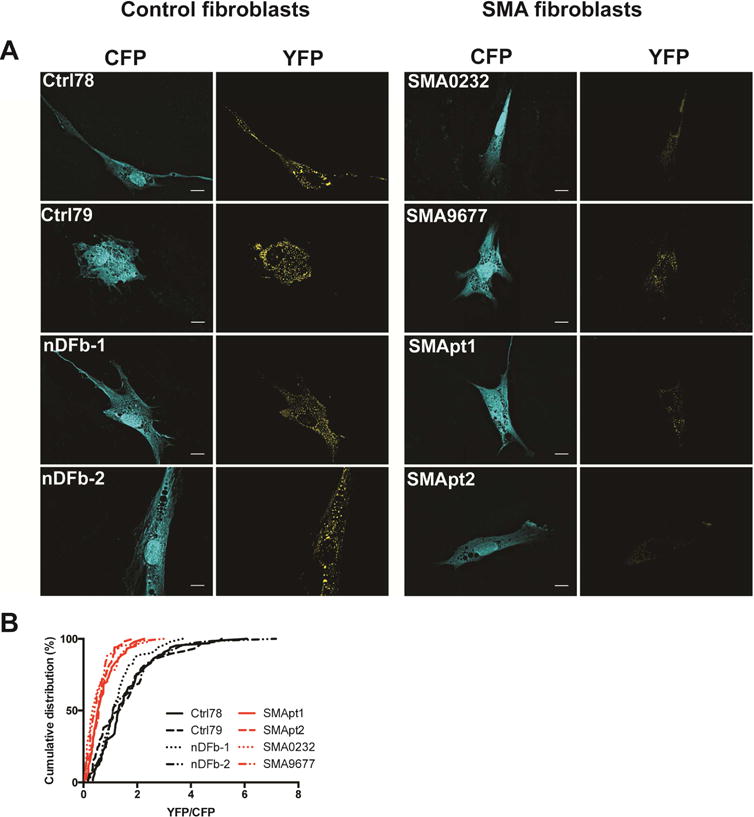
IMP1 and β-actin association is reduced in SMA patient fibroblasts. A. TriFC in SMA primary fibroblasts show reduced IMP1–β-actin granule assembly relative to control fibroblast lines (Ctrl78,79 and nDFb1,2). Scale bar = 10 μm. B. Quantification A. n=3, >50 cells/condition. Mean ± SEM; Ctrl78: 1.620 ± .147, Ctrl79: 1.743 ± .179 nDFb-1: 1.456 ± .124, nDFb-2: 1.737 ± .185, SMApt1: .774 ± .0791, SMApt2: .634 ± .0626, SMA0232: .610 ± .089, SMA9677: .559 ± .075. Analyzed by Tukey’s multiple comparisons. For a detailed breakdown of statistical comparisons see Table S3.
Similar to the SMA mouse model, IMP1 protein levels remain unchanged in SMA fibroblast lines relative to controls (Figure 4A,B), whereas SMN levels are reduced as expected. To determine if IMP1 association with mRNA is SMN-dependent, we employed an approach based on mRNA interactome capture (Castello et al., 2016). Using UV-crosslinking, followed by affinity purification with oligo(dT) beads under stringent conditions, we were able to capture endogenous mRNA-protein association (Figure 4C). Our experiments revealed a reduced amount of IMP1 protein pulled down with mRNA in SMA patient fibroblasts (Figure 4D,E), confirming that the association of endogenous IMP1 with mRNA is defective under conditions of reduced SMN protein levels.
Figure 4.
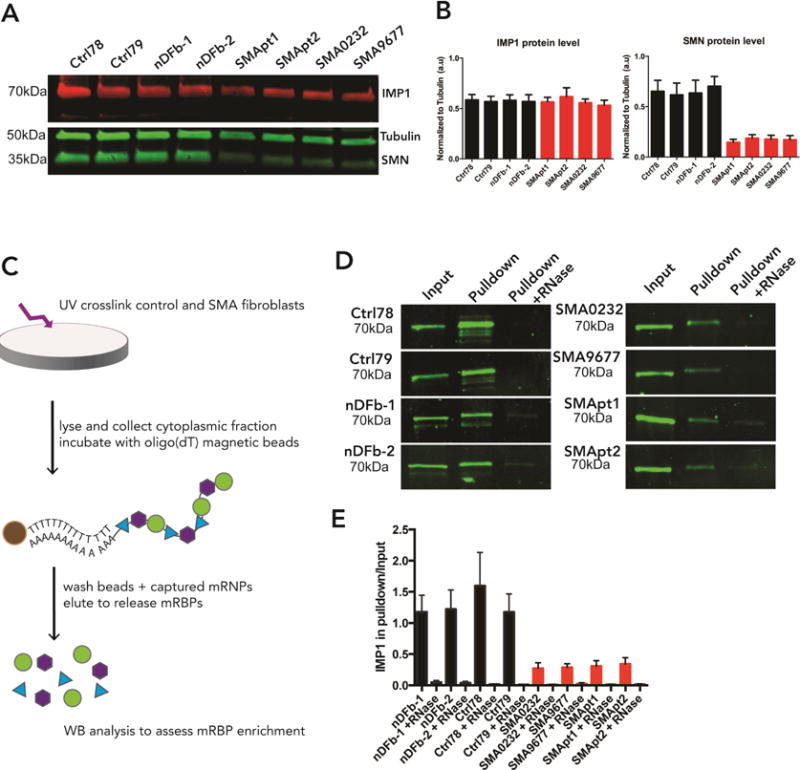
IMP1 association with mRNA is impaired in SMA patient fibroblasts. A. IMP1 protein levels in SMA patient fibroblasts remain unchanged relative to controls, whereas SMN levels are significantly reduced. B. Quantification of A. n=3, for statistical comparisons see Table S4 for IMP1 values and Table S5 for SMN values. Error bars +/− SEM. SMN protein levels mean ± SEM; Ctrl 78: .652 ± .109, Ctrl 79: .617 ± .117, nDFb-1: .636 ± .128, nDFb-2: .703 ± .097, SMApt1: .147 ± .0279, SMApt2: .188 ± .034, SMA0232: .178 ± .038, SMA9677: .172 ± .040. C. Schematic representation of the mRNA interactome assay. Control or SMA patient fibroblasts are subjected to UV-crosslinking and cytoplasmic lysates are incubated with oligo(dT) beads. Isolates are then used for western blot analysis for assessment of IMP1 association with mRNA. D. Quantification of mRNA-binding proteins demonstrates a significant decrease in the amount of IMP1 protein pulled down from SMA patient fibroblasts. E. Quantification of D. n=6, for statistical comparisons see Table S6. Error bars +/− SEM. Mean ± SEM; nDFb-1: 1.179 ± 0.265, nDFb-1 +RNase: 0.049 ± 0.029, nDFb-2: 1.222 ± 0.309, nDFb-2 + RNase: 0.036 ± 0.026, Ctrl78: 1.596 ± 0.536, Ctrl78 + RNase: 0.016 ± 0.008, Ctrl79: 1.176 ± 0.289, Ctrl79 + RNase: 0.009 ± 0.003, SMA0232: 0.272 ± 0.09, SMA0232 + RNase: 0.012 ± 0.004, SMA9677: 0.287 ± 0.058, SMA9677 + RNase: 0.024 ± 0.016, SMApt1: 0.308 ± 0.087, SMApt1 + RNase: 0.013 ± 0.005, SMApt2: 0.341 ± 0.102, SMApt2 + RNase: 0.017 ± 0.007.
mRNP granules are thought to consist of one or multiple transcripts that are bound by a diverse set of mRBPs (Buxbaum et al., 2015; Castello et al., 2013; Holt and Schuman, 2013; Martin and Ephrussi, 2009). To determine the complexity of mRNP granules, we adapted a density centrifugation method that has been established for the size fractionation and isolation of mRNPs (Fritzsche et al., 2013). In SMA fibroblast lysates, IMP1 shows a leftward shift towards lighter fractions as compared to control lysates, with an almost complete depletion from the heaviest fraction, which is consistent with decreased granule size (Figure 5A,B). A similar SMA-specific defect is seen for the cytoplasmic polyA-binding protein PABPC1 (Figure S2A,B), which shows a similar shift towards lighter fractions in its distribution pattern. These data indicate that widespread reductions in mRNP granule size is present in SMA. Non-RNA associated proteins, α-tubulin (Figure S1A,B) and β-actin (Figure S1C,D) do not show an altered gradient distribution.
Figure 5.
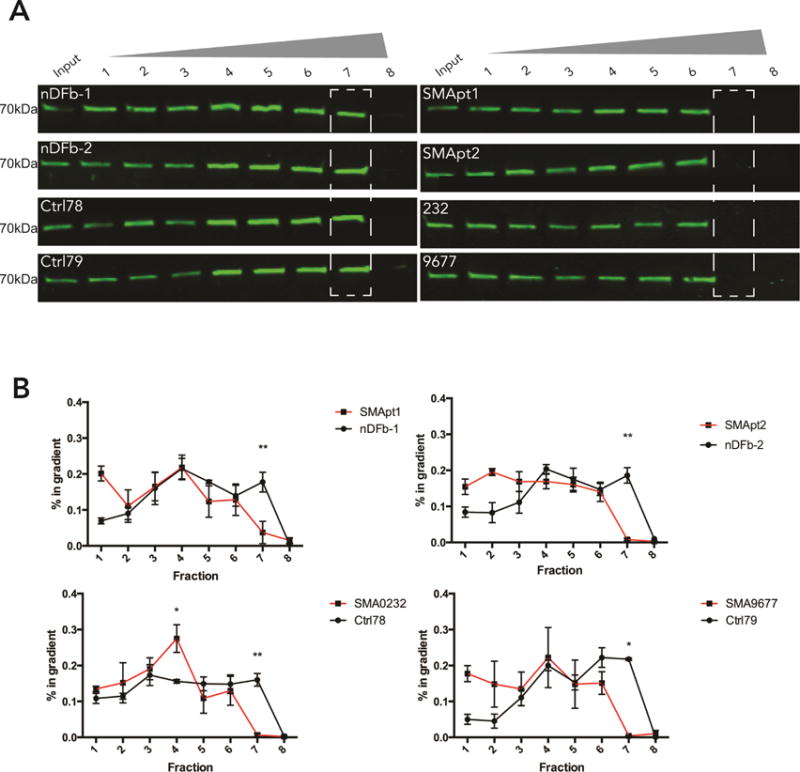
IMP1 granules show reduced size in SMA patient samples. A. Cytoplasmic RNP isolates from fibroblasts were subjected to Optiprep gradient centrifugation and fractions were analyzed for the presence of IMP1. SMA lysates show altered distribution of IMP1 complexes relative to control fractions. B. Distributions plotted as enrichment in % of the total signal in all fractions found in one particular fraction. n=3, analyzed by Sidak’s multiple comparisons test, *p<.05, **p<.01. Error bars +/− SEM.
IMP1 mRNP granules are reduced in volume in SMA patient fibroblasts
We next undertook direct visualization of IMP1-containing granules in SMA and control fibroblasts to confirm this finding in situ. Employing superresolution structured illumination microscopy (SIM) (Gustafsson, 2000; Gustafsson et al., 2008), we compared the nanoscale structure of IMP1 granules in SMA and control fibroblasts (Figure 6A–D). In SMA fibroblasts, a clear reduction in granule volume is seen. This finding confirms our biochemical evidence of impaired IMP1 association with mRNA and decreased size in biochemical fractionation. As an additional confirmation, we sought to determine if reduction of the volume of IMP1 granules in SMA fibroblasts is SMN dependent. We found that exogenous expression of mCherry-SMN drastically increases IMP1 granule volume, thus corroborating our findings (Figure 6E,F). The restoration of granule volume is dependent on the Tudor domain of SMN. Previous results show that IMP1 and SMN associate in a Tudor domain dependent manner (Fallini et al., 2014), indicating that IMP1 granule assembly is dependent on a direct interaction with SMN. All of these data demonstrate that the assembly of IMP1-containing granules and probably other mRNPs is deficient in SMA.
Figure 6.
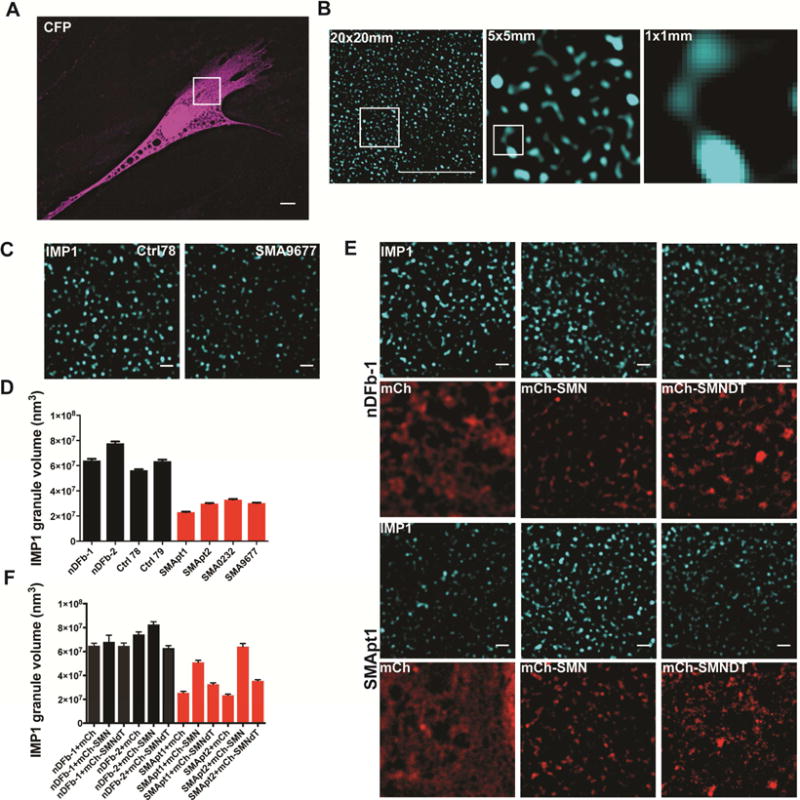
IMP1 granules are reduced in size in SMA patient samples and can be rescued by restoring expression of SMN. A. A CFP expressing control fibroblast pseudo-colored in magenta to highlight cell morphology and size. The inset highlights a 20μm × 20μm window to illustrate the regions of cells imaged in B. Scale bar =10μm. B. 20μm × 20μm view of IMP1 granules in a Ctrl and SMA fibroblast line, with inset region being a 5μm × 5μm region. An enlargement of inset from 5μm × 5μm region is shown, with an additional inset highlighting a 1μm × 1μm region. Enlargement of the 1μm × 1μm region highlighting the size of IMP1 granules. Scale bar =10μm. C. Superresolution Structured Illumination Microscopy (SIM) fluorescence imaging reveals that IMP1-containing granules have decreased volume in SMA fibroblasts. Scale bar = 1μm. D. Quantification of C. n=3, 15 cells/condition. Analyzed by Tukey’s multiple comparisons test. For breakdown of statistical comparisons see Table S7. Error bars +/− SEM. Mean ± SEM; Ctrl78: 5.64E+07 ± 812009, Ctrl79: 6.35E+07 ± 1.27E+06, nDFb-1: 6.42E+07 ± 1.33E+06, nDFb-2: 7.78E+07 ± 1.40E+06, SMApt1: 2.31E+07 ± 390215, SMApt2: 2.99E+07 ± 494158, SMA0232: 3.31E+07 ± 492832, SMA9677: 3.03E+07 ± 431995. E. Expression of mCherry-tagged full-length SMN but not the SMNΔTudor deletion mutant rescues IMP1 granule volume in 2 SMA lines. Scale bar = 1μm. F. Quantification of E. n=3, 15 cells/condition, for statistical comparisons see Table S7. Scale bar = 1μm. Error bars +/−SEM. Mean ± SEM; nDFb-1 mCherry: 6.49E+07 ± 1.97E+06, nDFb-1 mCherry-SMN: 6.81E+07 ± 5.55E+06, nDFb-1 mCherry-SMNΔTudor: 6.47E+07 ± 2.40E+06, nDFb-2 mCherry: 7.42E+07 ± 2.18E+06, nDFb-2 mCherry-SMN: 8.26E+07 ± 2.36E+06, nDFb-2 mCherry-SMNΔTudor: 6.30E+07 ± 1.90E+06, SMApt1 mCherry: 2.56E+07 ± 1.15E+06, SMApt1 mCherry-SMN: 5.10E+07 ± 1.68E+06, SMApt1 mCherry-SMNΔTudor: 3.26E+07 ± 1.23E+06, SMApt2 mCherry: 2.34E+07 ± 9.68E+05, SMApt2 mCherry-SMN: 6.41E+07 ± 2.57E+06, SMApt2 mCherry-SMNΔTudor: 3.55E+07 ± 918038.
IMP1 mRNP granules show decreased association with the cytoskeleton in SMA patient fibroblasts
Previous work in primary motor neurons has demonstrated IMP1 mislocalization in both SMN-depleted and SMA motor neurons. Therefore, we sought to assess if a similar localization defect occurs in SMA patient fibroblast lines (Figure 7A–C). Indeed, IMP1 shows altered distribution in SMA patient fibroblasts, with a specific reduction at the leading edge of the fibroblasts (Figure 7C), but no overall change in the actin rich lamellipodia. Interestingly, the distribution pattern of IMP1 signal in the lamellipodia is altered in the SMA patient fibroblasts (Figure 7A). Whereas in the control fibroblasts IMP1 aligns along linear structures in the lamellipodia (percent of cells showing linear IMP1 arrays; nDFb-1: 47.37%, nDFb-2: 56.86%, Ctrl78: 54.72%, Ctrl79: 51.85%) this ordered distribution pattern is reduced in SMA patient fibroblasts (percent of cells showing linear IMP1 arrays; SMApt1: 21.54%, SMApt2: 17.53%, SMA0232: 18.31%, SMA9677: 22.1%). Based on these results, we predicted that defects in mRNP assembly leads to a reduced formation of mature transport granules that are transported along cytoskeletal structures (Xing and Bassell, 2013).
Figure 7.
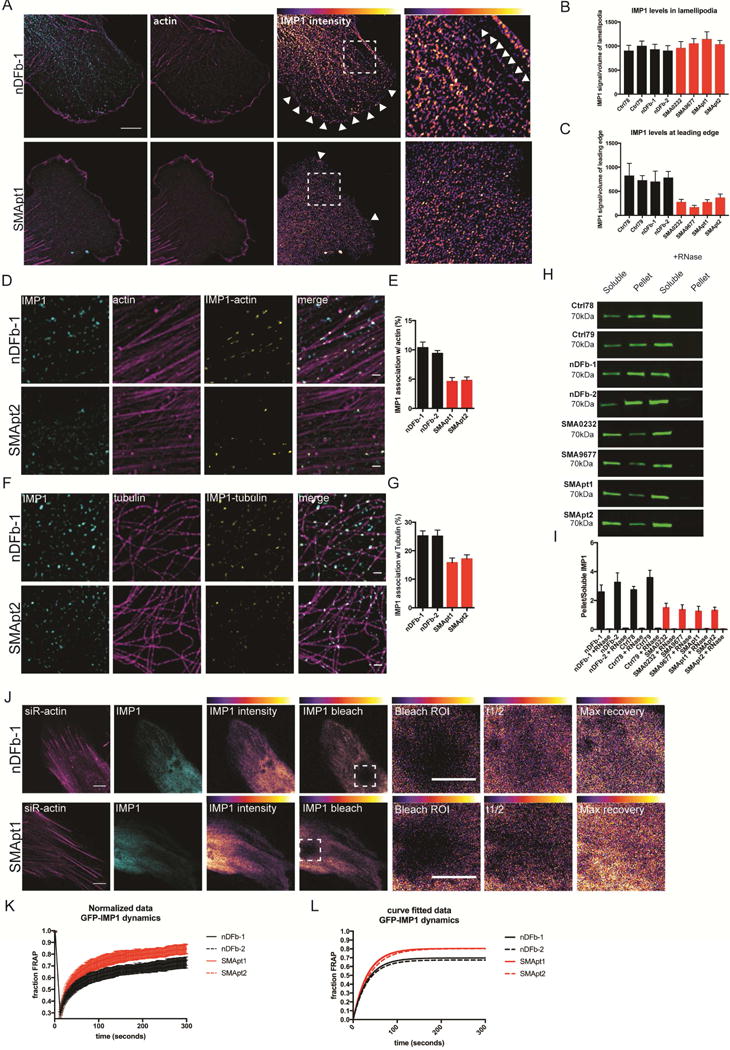
IMP1 complexes show reduced association with the cytoskeleton in SMA fibroblasts. A. IMP1 protein within the lamellipodia of SMA fibroblasts fails to properly localize to the leading edge. Arrowheads indicate the leading edge and highlight assembly of IMP1 along linear structures in control fibroblasts (insets). B. Quantification of IMP1 levels in the lamellipodia. n=3, >40 cells per condition, analyzed by Tukey’s multiple comparisons. For breakdown of statistical comparisons see Table S8. Error bars +/−SEM. Mean ± SEM; Ctrl78: 906.3 ± 109.6, Ctrl79: 1007 ± 97.18, nDFb-1: 932.5 ± 104.2, nDFb-2: 908.3 ± 101.2, SMA0232: 963.2 ± 130.8, SMA9677: 1057 ± 98.44, SMApt1: 1148 ± 147.4, SMApt2: 1038 ± 78.02. C. Quantification of IMP1 levels in the leading edge. n=3, >40 cells per condition, analyzed by Tukey’s multiple comparisons. For breakdown of statistical comparisons see Table S9. Error bars +/− SEM. Mean ± SEM; Ctrl78: 827.7 ± 253.8, Ctrl79: 731 ± 96.75, nDFb-1: 704.2 ± 216, nDFb-2: 787 ± 126, SMA0232: 278.8 ± 55.85, SMA9677: 172.4 ± 35.46, SMApt1: 277.2 ± 49.13, SMApt2: 369.9 ± 72.14. D. SIM imaging reveals decreased association of IMP1 granules with actin filaments. Scale bar = 1μm. E. Quantification of D. n=3, 15/cells per condition, analyzed by Tukey’s multiple comparisons. For breakdown of statistical comparisons see Table S10. Error bars +/− SEM. Mean ± SEM; nDFb-1: 25.2 ± 1.767, nDFb-2: 25.06 ± 2.181, SMApt1: 15.9 ± 1.809, SMApt2: 17.09 ± 1.507. F. SIM imaging demonstrates reduced association of IMP1 granules with microtubules. Scale bar = 1μm. G. Quantification of F. n=3, 15/cells per condition, analyzed by Tukey’s multiple comparisons. For breakdown of statistical comparisons see Table S11. Error bars +/−SEM. Mean ± SEM; nDFb-1: 25.2 ± 1.767, nDFb-2: 25.06 ± 2.181, SMApt1: 15.9 ± 1.809, SMApt2: 17.09 ± 1.507. H. Cytoskeleton pelleting shows a reduction in the amount of IMP1 pelleted in SMA fibroblasts relative to the controls, demonstrating an impairment in association with the cytoskeleton. RNaseA/T1 treatment fully releases IMP1 from the cytoskeletal pellet. I. Quantification of H. n=5, analyzed by Tukey’s multiple comparisons. For breakdown of statistical comparisons see Table S12. Error bars +/− SEM. Mean ± SEM; nDFb-1: 2.586 ± 0.491, nDFb-1 +RNase: 0.039 ± 0.015, nDFb-2: 3.251 ± 0.660, nDFb-2 + RNase: 0.075 ± 0.023, Ctrl78: 2.732 ± 0.243, Ctrl78 + RNase: 0.058 ± 0.028, Ctrl79: 3.577 ± 0.509, Ctrl79 + RNase: 0.069 ± 0.017, SMA0232: 1.497 ± 0.312, SMA0232 + RNase: 0.037 ± 0.014, SMA9677: 1.362 ± 0.342, SMA9677 + RNase: 0.026 ± 0.009, SMApt1: 1.251 ± 0.350, SMApt1 + RNase: 0.052 ± 0.018, SMApt2: 1.311 ± 0.226, SMApt2 + RNase: 0.033 ± 0.010. J. FRAP analysis of GFP-IMP1 dynamics reveals a decrease in the immobile fraction in SMA patient fibroblasts. Representative images of GFP-IMP1 in control and SMA fibroblasts pre and post bleaching. t1/2 values: nDFb-1: 40.56s, nDFb-2: 44.64s, SMApt1: 32.05s, SMApt2: 35.61s. Immobile fraction values: nFb-1: .314, nDFb-2: .336, SMApt1: .206, SMApt2: .208. K. Normalized GFP-IMP1 FRAP recovery curves for control and SMA fibroblasts. L. Curve fitted GFP-IMP1 FRAP recovery curves for control and SMA fibroblasts.
Therefore, we sought to determine if as a consequence of reduced SMN levels, IMP1 shows altered association with the cytoskeleton. Utilizing SIM, we took advantage of the enhanced axial and lateral resolution to resolve IMP1 mRNP granule association with both microtubules and actin filaments (Figure 7D–G). Superresolution imaging and 3D reconstructions of all IMP1 signal falling in the volume of the cytoskeleton, allowed direct comparison of the total number of IMP1 granules associating with either actin or microtubules in control and SMA fibroblasts. This stringent analysis demonstrates a substantial reduction of IMP1 co-localization with both the actin and microtubule cytoskeleton in SMA fibroblasts relative to control lines (Figure 7A–D), consistent with the predicted mRNP assembly defect leading to a cytoskeleton association defect. Furthermore, biochemical separation of proteins in the cytoskeleton-bound and free fractions, allowed direct assessment of the amount of IMP1 enriched on the intact filamentous cytoskeleton (Wang et al., 2008). This assay confirms reduced association of IMP1 with actin and tubulin in SMA patient vs. control fibroblasts (Figure 7E–F). Given that cytoskeletal protein levels were not affected (Figure S1), this reduced co-purification of IMP1 with the cytoskeleton likely reflects a specific defect in the assembly of transport-competent mRNP complexes. To test the effect of reduced association of IMP1 with the cytoskeleton and increased diffusion in situ, we performed fluorescence recovery after photobleaching (FRAP) to assess the dynamic behavior of IMP1 in control and SMA fibroblasts (Figure 7J–L). The maximal recovery of GFP-IMP1 in SMA patient fibroblasts is increased relative to the control lines, indicating a reduction in the immobile fraction (Figure 7K–L), which is consistent with a reduction in association and anchoring of IMP1 on the cytoskeleton. Taken together, these data provide a molecular mechanism how mRNAs and mRBPs fail to localize in SMA, with a reduction in functional SMN protein levels resulting in impaired association of mRBPs with mRNA, which leads to decreased assembly into mature transport complexes, causing mislocalization of mRNA and reduced local translation in SMA.
Discussion
The assembly of mRNA-binding proteins (mRBPs) with mRNAs into higher order mRNP granules regulates all stages of post-transcriptional regulation for mRNAs, including splicing, export, stability, subcellular localization, and translation of mRNAs. Misregulation of proper RNA–protein association via either excessive or reduced assembly of RNPs can lead to human diseases. Hyper-assembly into pathological mRNP aggregates is thought to contribute to a number of neurodegenerative disorders, including amyotrophic lateral sclerosis (ALS) and multisystem proteinopathy (Shukla and Parker, 2016). Pathological RNP hyper-assembly has been well characterized, resulting in structures such as stress granules transitioning from a liquid droplet like state in normal stress granules to more persistent abnormal granules and finally detergent-insoluble pathological aggregates (Lin et al., 2015; Shukla and Parker, 2016). The mechanisms, and specifically the molecular machinery, which regulates proper mRNA-protein association remains to be fully elucidated (Li et al., 2013).
SMA is characterized by SMN-dependent defects in the formation of RNPs and therefore represents an RNP hypo-assembly disease. Previous work on SMN has conclusively identified it as a chaperone for the assembly of snRNPs (Burghes and Beattie, 2009; Li et al., 2014), but it has been proposed to play additional roles, which would contribute to the neurodegeneration phenotype (Burghes and Beattie, 2009; Donlin-Asp et al., 2016; Li et al., 2014). While indirect evidence has been collected for mRNA mislocalization for a number of transcripts including β-actin, Gap43, neuritin and polyA mRNA (Akten et al., 2011; Fallini et al., 2010; Fallini et al., 2016; Fallini et al., 2011; Rossoll et al., 2003), there has been a lack of thorough investigation into the SMN-dependent molecular mechanism that influence these processes. Recently, we and others have proposed that SMN may play a more general role as a chaperone for the assembly of not only heptameric Sm-protein and related LSm-protein complexes with a role in pre-mRNA splicing and histone mRNA 3′-processing, but potentially also for heterogeneous mRNP complexes that regulate mRNA localization and stability (Li 2014, Donlin-Asp 2016). However, until now direct evidence for a mechanistic role of SMN in mRNP complex assembly was missing.
Through this study we have for the directly addressed the functional role of SMN in mRNA localization. Our results demonstrate that SMN, via a transient association, facilitates the assembly of IMP1 protein with β-actin mRNA independent of SMN’s role in snRNP-assembly and splicing (Figure 1–3). This SMN-dependent defect in mRNP assembly leads to smaller IMP1 granules and proper assembly requires SMN’s mRBP-binding Tudor domain (Figure 4–6, Figure S1–2). Assembly defects cause decreased association of IMP1 with the cytoskeleton and defective localization to the leading edge (Figure 7). Through employing a series of complementary biochemical and imaging methods across various in vitro and in vivo SMA disease models, we were able to demonstrate that SMN acts as a molecular chaperone for mRNP assembly, defined as a protein that interacts with and aids in the folding or assembly of other proteins without being part of their final structure (Kim et al., 2013). Our results suggest that beyond IMP1 granules there is a more general defect in bulk PABPC1 mRNP assembly that is likely to affect the localization of most transcripts (Figure S2A,B). This corroborates and further explains our previous finding that SMN-deficiency causes mislocalization of not only specific transcripts such as β-actin and Gap43 (Fallini et al., 2016), but also bulk polyA mRNA in axons of motor neurons (Fallini et al., 2010; Fallini et al., 2016; Fallini et al., 2011) and a large assortment of specific mRNAs (Saal et al., 2014).
The complex network of SMN’s protein interactions (Kroiss et al., 2008; Otter et al., 2007; Shafey et al., 2010), including Sm proteins (Buhler et al., 1999; Friesen et al., 2001), LSm proteins (Friesen and Dreyfuss, 2000; Pillai et al., 2003), and mRNA binding proteins (Akten et al., 2011; Fallini et al., 2014; Fallini et al., 2011; Hubers et al., 2011; Piazzon et al., 2008; Rossoll et al., 2002; Tadesse et al., 2008) highlights the variety of complex processes that are likely defective upon reduction of SMN protein levels. The mounting evidence that SMN broadly functions as a chaperone for RNP assembly strongly suggests that defects in a broad spectrum of RNA processing, including splicing (Li et al., 2014), stability, localization (Fallini et al., 2016; Rossoll et al., 2003), and translation (Fallini et al., 2016; Kye et al., 2014; Sanchez et al., 2013) contribute to SMA pathology. The contributions of each of these individual processes remain to be fully evaluated, however the dysregulation of all of these processes taken together likely explains the unique onset and presentation of the disease. For mRNP localization in particular, it remains to be seen how this manifests in vivo, and if local translation defects reported upon SMN deficiency (Fallini et al., 2016) stem from reductions in RNA delivery or from a direct role for SMN in axonal protein synthesis itself (Dombert et al., 2014; Kye et al., 2014; Prescott et al., 2014; Rage et al., 2013; Zhang et al., 2006). The observed defect in mRNP assembly in the cell body occurs upstream of the previously characterized localization defects, which then result in decreased local translation. Future studies will need to show how local dynamics of mRNP assembly and disassembly are affected in SMA, as mRNPs are well known to undergo dynamically regulated assembly and disassembly in distal regions of the axon, which may be a function of axonally localized SMN during development (Hao le et al., 2015; Zhang et al., 2006; Zhang et al., 2003).
An important remaining question is the scope of RNP defects in SMA in vivo, and how these defects contribute to the disease phenotypes observed in SMA. Given the known functions of SMN, SMA likely is a disease of general RNP hypo-assembly, where one expects widespread effects on all stages of posttranscriptional regulation (Donlin-Asp et al., 2016; Shukla and Parker, 2016), which will lead to widespread alterations in splicing, stability, localization and translation of RNA transcripts. This raises an intriguing question if all of these processes contribute to the manifestation of SMA pathology, or if specific defects in particular RNP classes result in certain phenotypes. Future work will need to address if rescuing the assembly of specific RNP classes, such as snRNPs or mRNPs, can mitigate some or all of the disease phenotypes.
Experimental Procedures
Cell culturing, transfections, and staining
Primary motor neurons from wild type and SMA (Smn−/−; hSMN2; Stock number: 005024, Jackson Laboratories) E13.5 mouse embryos were isolated, cultured, and transfected as previously described (Fallini et al., 2010). Primary fibroblast lines were acquired from Coriell (Ctrl: ND29178, ND29179, SMA: GM09677, GM00232), or derived from dermal skin biopsies obtained from Emory University Children’s Healthcare of Atlanta (SMApt1 and SMApt2). Patients SMApt1 and SMApt2 presented with signs of muscle weakness by the age of 2 months and were diagnosed with SMA type I after evaluation by a neurologist followed by genetic testing. Quantitative dosage analysis of genomic DNA showed 0 copy of SMN1 and 2 copies of SMN2 for both patients, correlating with the clinical impression. Additionally, two neonatal dermal fibroblast lines from foreskin (nDF-1, nDF-2; Invitrogen) were used for experimental procedures. Fibroblasts were cultured as described previously (Vangipuram et al., 2013). Transfections were performed using Lipofectamine LTX (Invitrogen). Neuro2a cells were cultured as previously described. IF was performed against IMP1 (1:500, MBL) and alpha tubulin (1:250, Abcam) overnight at 4°C.
Image Acquisition and Analysis
For fluorescence imaging, a 60× objective (1.4 NA) was used. Z-series (5 to 25 sections, 0.2μm thickness) were acquired with an epifluorescence microscope (Ti Eclipse, Nikon) equipped with a cooled CCD camera (HQ2, Photometrics). Z-stacks were deconvolved (Media Cybernetics) and analyzed using Imaris (Bitplane). For quantitative imaging experiments, image exposure settings were set at the beginning of the experiment and kept constant through all conditions and investigators were kept blind to the genotypes of all samples at the time of imaging and throughout all subsequent image analysis. Images were prepared using the Fiji software package (ImageJ).
Steady state protein level assessment
E13.5 mouse brains were homogenized in lysis buffer (50mM Tris-HCl, 150mM NaCl, 2% Triton X-100, protease inhibitors) and sonicated on ice for 3×10 minutes. Primary human fibroblasts were trypsinized, washed in PBS and counted (BioRad), and cell number was normalized prior to lysis in RIPA buffer. Proteins were separated on a 10% polyacrylamide-SDS gel and hybridized with primary antibodies directed against SMN (BD Bioscience, 1:500), IMP1 (MBL, 1:1000), β-actin (Sigma, 1:1000), and tubulin (Sigma, 1:1000). The intensity of the protein bands was quantified using an Odyssey imaging system and LiCor Image Studio.
TriFC
TriFC constructs were cloned similarly to previous described (Rackham and Brown, 2004). For TriFC experiments, IMP1-VFP1-154, λN22-VFP155-239, and CFP-UTR’s transfected into cells in a 1:1:1 ratio to limit oversaturation of TriFC signal. Expression of constructs was limited to 12–24 hours, and fixation was performed with 4% paraformaldehyde, followed by anti-GFP (Abcam) immunofluorescence with an Alexa647 secondary antibody. Exposure settings were held constant for all acquisitions for an experiment. Analysis was performed in Imaris (Bitplane). The total sum of pixel intensities was measured in a 3D volume for both the CFP and YFP channels, and the ratio of YFP/CFP was determined for the readout of TriFC signal.
RNA immunoprecipitation
RNA immunoprecipitation (RIP) experiments were performed following published protocols (Selth et al., 2009). For each RIP experiment, three SMA embryonic brain lysates were pooled as were three control littermate lysates. Immunoprecipitations were carried out overnight at 4C using a polyclonal IMP1 antibody (MBL). Following washes, RNA was extracted using Trizol reagent (Invitrogen). qRT-PCR was performed on a LightCycler (Roche) using a previously described primer sets for β-actin (5′-TGTTACCAACTGGGACGACA-3′ and 5′-GGGGTGTTGAAGGTCTCAAA-3′) and Gapdh (5′-GAGTCTACTGGTGTCTTCAC-3′ and 5′-CCACAATGCCAAAGTTGTCAT-3′) (Xing et al., 2012). Data was analyzed using the 2^−ΔΔ ct method (Livak and Schmittgen, 2001).
mRNA interactome
The mRNA interactome capture approach (Castello et al., 2013) was adapted for use on smaller scale isolation. In short, fibroblasts grown to confluency in four 10cm tissue culture dishes per line, washed in cold PBS and UV-crosslinked at 400mJ. Cell pellets were lysed in 2ml of lysis buffer and split into two 1mL aliquots, one of which were treated with RNaseA/T1 mix for 10 mins at 37°C. 900 l of sample were then incubated with 250 L of oligo(dT) beads following the original protocol, with all subsequent washes being performed with 1mL of wash buffers. 60uL’s of elution buffer was added to the beads along with RNaseA/T1 for 10 mins at 37°C. Samples were brought to 1X in SDS-PAGE buffer and run on 10% SDS-PAGE gels. Immunoblots against IMP1 were performed, and data was analyzed by quantifying IMP1 signal in both the Pulldown lane and the Pulldown +RNaseA/T1 lane and dividing these values over the Input lane value to determine IMP1 enrichment.
RNP isolation
RNP isolation experiments were adapted for cells in culture from a published protocol (Fritzsche et al., 2013). The top eight 1 mL fractions were collected based on initial characterization of the gradient composition after a 2.5 hour centrifugation at 4°C at 40,000 RPM. Fractions were brought to 1X in SDS-PAGE lysis buffer and flash frozen in liquid nitrogen. Samples were run on 4–15% precast SDS-PAGE gels (Biorad) at 80V for 2 hours. Immunoblots against IMP1, α tubulin (Abcam), β-actin (Abcam) and PABPC1 (Abcam) were performed, and data was analyzed by quantifying the total sum of the signals in all fractions and dividing the total signal per individual fraction over this value to determine the total enrichment per individual fraction.
Structured Illumination Microscopy of IMP1 granules
Two-color 3D SIM was performed on a Nikon SIM microscope using a 100× (1.49 NA) object. 3D SIM images were analyzed in Imaris 8.1 software (Bitplane). For granule volume 3D surfaces were generated using a constant threshold for an experiment set and particle volume in nm3 was recorded. Five individual fibroblasts were imaged per individual line and experiments were performed in triplicate for a total of 15 cells per line. For granule association with the cytoskeleton, either the actin or microtubule channel was used to generate a 3D surface. This surface was used to mask and duplicate the IMP1 channel into a new separate channel, representing the IMP1 signal that fell within the cytoskeleton volume, which was then subjected to particle counting, as was the original IMP1 image. The total number of particles in the cytoskeleton associated channel over the total number of IMP1 particles represents the % cytoskeletal associated IMP1.
Cytoskeletal association of mRNPs
Quantification of cytoskeletal association of IMP1 was carried out as previously described for FMRP (Wang et al., 2008). For RNase controls, RNasA/T1 (Invitrogen) treatments were carried out at 37°C for 10 minutes. Lysate was spun down for 1 min at 700g to pellet nuclei, and the supernatant was spun down at 16,000g at room temp for 20 minutes. Both pellet and supernatant fractions were suspended to 1X SDS-PAGE buffer and then run on 10% polyacrylamide gels. Western blots were performed for IMP1 to assess enrichment in the cytoskeletal pellet. Blots were quantified by assessing IMP1 in the pellet over IMP1 in the supernatant.
Fluorescence Recovery After Photobleaching
Primary human fibroblasts expressing GFP-IMP1 were grown in glass bottom dishes (MatTek). Imaging was performed on a Nikon A1R laser-scanning confocal microscope (equipped with a 60×/1.40 NA oil immersion objective and a temperature-regulated enclosure at 37°C. FRAP sequences consisted of two prebleach images, photobleaching of a section the cell at 100% laser intensity for 1 second pulses for a total of 10 bleach pulses, followed by acquisition of postbleach images every 1s for 5 min. Fluorescence recovery was calculated as the ratio of the background-subtracted fluorescence intensities within the bleach area to an unbleached region of the cell. Normalized value curves and exponential curves were generated in Graphpad Prism (GraphPad Software).
Statistical methods
Statistical analyses were performed by tests appropriate for experimental design. For single comparisons either the Student T-test or Kolmogrov-Smirnov test was used and for multiple comparisons Tukey’s multiple comparisons were used. Analysis was performed in GraphPad Prism (GraphPad Software). SEM is represented as error bars in the graphs.
Supplementary Material
Highlights.
SMN facilitates the association of IMP1 protein with the 3′UTR of β-actin mRNA.
SMN-deficiency leads to reduced size of IMP1-containing mRNP granules.
Rescue of mRNP assembly in SMA patient cells depends on the Tudor domain of SMN.
Impairments of IMP1–mRNA assembly lead to decreased association with the cytoskeleton.
Acknowledgments
The authors thank Lian Li and Shirley Huang for excellent technical support. This work was supported by the Muscular Dystrophy Association (MDA) and Weissman Family Foundation to GJB; the US National Institute of Health (NIH) Grant NS091749 to WR; the National Research Service Award (NRSA) training award F31NS084730-01 and ARCS Fellowship Roche Foundation award to PGDA. This research project was supported in part by the Emory University Integrated Cellular Imaging Microscopy Core of the Emory Neuroscience NINDS Core Facilities grant, P30NS055077. This study used samples from the NINDS Cell Line Repository (http://ccr.coriell.org/ninds), as well as clinical data. NINDS and NIGMS Repository sample numbers corresponding to the samples used are: ND29178, ND29179, GM09677, and GM00232.
Footnotes
Publisher's Disclaimer: This is a PDF file of an unedited manuscript that has been accepted for publication. As a service to our customers we are providing this early version of the manuscript. The manuscript will undergo copyediting, typesetting, and review of the resulting proof before it is published in its final citable form. Please note that during the production process errors may be discovered which could affect the content, and all legal disclaimers that apply to the journal pertain.
Author Contributions:
Conceptualization, P.G.D.A, C.F, G.J.B, and W.R; Methodology, P.G.D.A, C.F, and W.R.; Investigation, P.G.D.A; Formal Analysis, P.G.D.A, and J.C; Writing—Original Draft, P.G.D.A, and W.R; Writing—Reviewing and Editing, P.G.D.A, C.F, G.J.B, and W.R; Funding Acquisition, G.J.B, and W.R; Resources, P.G.D.A, C.F, C.C.C., H.C.P, and M.E.M; Supervision, G.J.B, and W.R.
References
- Akten B, Kye MJ, Hao le T, Wertz MH, Singh S, Nie D, Huang J, Merianda TT, Twiss JL, Beattie CE, et al. Interaction of survival of motor neuron (SMN) and HuD proteins with mRNA cpg15 rescues motor neuron axonal deficits. Proc Natl Acad Sci U S A. 2011;108:10337–10342. doi: 10.1073/pnas.1104928108. [DOI] [PMC free article] [PubMed] [Google Scholar]
- Bassell GJ, Zhang H, Byrd AL, Femino AM, Singer RH, Taneja KL, Lifshitz LM, Herman IM, Kosik KS. Sorting of beta-actin mRNA and protein to neurites and growth cones in culture. J Neurosci. 1998;18:251–265. doi: 10.1523/JNEUROSCI.18-01-00251.1998. [DOI] [PMC free article] [PubMed] [Google Scholar]
- Baumer D, Lee S, Nicholson G, Davies JL, Parkinson NJ, Murray LM, Gillingwater TH, Ansorge O, Davies KE, Talbot K. Alternative splicing events are a late feature of pathology in a mouse model of spinal muscular atrophy. PLoS genetics. 2009;5:e1000773. doi: 10.1371/journal.pgen.1000773. [DOI] [PMC free article] [PubMed] [Google Scholar]
- Buhler D, Raker V, Luhrmann R, Fischer U. Essential role for the tudor domain of SMN in spliceosomal U snRNP assembly: implications for spinal muscular atrophy. Hum Mol Genet. 1999;8:2351–2357. doi: 10.1093/hmg/8.13.2351. [DOI] [PubMed] [Google Scholar]
- Burghes AH, Beattie CE. Spinal muscular atrophy: why do low levels of survival motor neuron protein make motor neurons sick? Nat Rev Neurosci. 2009;10:597–609. doi: 10.1038/nrn2670. [DOI] [PMC free article] [PubMed] [Google Scholar]
- Buxbaum AR, Haimovich G, Singer RH. In the right place at the right time: visualizing and understanding mRNA localization. Nat Rev Mol Cell Biol. 2015;16:95–109. doi: 10.1038/nrm3918. [DOI] [PMC free article] [PubMed] [Google Scholar]
- Castello A, Horos R, Strein C, Fischer B, Eichelbaum K, Steinmetz LM, Krijgsveld J, Hentze MW. System-wide identification of RNA-binding proteins by interactome capture. Nat Protoc. 2013;8:491–500. doi: 10.1038/nprot.2013.020. [DOI] [PubMed] [Google Scholar]
- Castello A, Horos R, Strein C, Fischer B, Eichelbaum K, Steinmetz LM, Krijgsveld J, Hentze MW. Comprehensive Identification of RNA-Binding Proteins by RNA Interactome Capture. Methods Mol Biol. 2016;1358:131–139. doi: 10.1007/978-1-4939-3067-8_8. [DOI] [PubMed] [Google Scholar]
- Chao JA, Patskovsky Y, Patel V, Levy M, Almo SC, Singer RH. ZBP1 recognition of beta-actin zipcode induces RNA looping. Genes Dev. 2010;24:148–158. doi: 10.1101/gad.1862910. [DOI] [PMC free article] [PubMed] [Google Scholar]
- Custer SK, Gilson TD, Li H, Todd AG, Astroski JW, Lin H, Liu Y, Androphy EJ. Altered mRNA Splicing in SMN-Depleted Motor Neuron-Like Cells. PloS one. 2016;11:e0163954. doi: 10.1371/journal.pone.0163954. [DOI] [PMC free article] [PubMed] [Google Scholar]
- Deshler JO, Highett MI, Abramson T, Schnapp BJ. A highly conserved RNA-binding protein for cytoplasmic mRNA localization in vertebrates. Curr Biol. 1998;8:489–496. doi: 10.1016/s0960-9822(98)70200-3. [DOI] [PubMed] [Google Scholar]
- Doktor TK, Hua Y, Andersen HS, Broner S, Liu YH, Wieckowska A, Dembic M, Bruun GH, Krainer AR, Andresen BS. RNA-sequencing of a mouse-model of spinal muscular atrophy reveals tissue-wide changes in splicing of U12-dependent introns. Nucleic Acids Res. 2016 doi: 10.1093/nar/gkw731. [DOI] [PMC free article] [PubMed] [Google Scholar]
- Dombert B, Sivadasan R, Simon CM, Jablonka S, Sendtner M. Presynaptic localization of Smn and hnRNP R in axon terminals of embryonic and postnatal mouse motoneurons. PloS one. 2014;9:e110846. doi: 10.1371/journal.pone.0110846. [DOI] [PMC free article] [PubMed] [Google Scholar]
- Donlin-Asp PG, Bassell GJ, Rossoll W. A role for the survival of motor neuron protein in mRNP assembly and transport. Curr Opin Neurobiol. 2016;39:53–61. doi: 10.1016/j.conb.2016.04.004. [DOI] [PubMed] [Google Scholar]
- Fallini C, Bassell GJ, Rossoll W. High-efficiency transfection of cultured primary motor neurons to study protein localization, trafficking, and function. Mol Neurodegener. 2010;5:17. doi: 10.1186/1750-1326-5-17. [DOI] [PMC free article] [PubMed] [Google Scholar]
- Fallini C, Bassell GJ, Rossoll W. Spinal muscular atrophy: the role of SMN in axonal mRNA regulation. Brain Res. 2012;1462:81–92. doi: 10.1016/j.brainres.2012.01.044. [DOI] [PMC free article] [PubMed] [Google Scholar]
- Fallini C, Donlin-Asp PG, Rouanet JP, Bassell GJ, Rossoll W. Deficiency of the Survival of Motor Neuron Protein Impairs mRNA Localization and Local Translation in the Growth Cone of Motor Neurons. J Neurosci. 2016;36:3811–3820. doi: 10.1523/JNEUROSCI.2396-15.2016. [DOI] [PMC free article] [PubMed] [Google Scholar]
- Fallini C, Rouanet JP, Donlin-Asp PG, Guo P, Zhang H, Singer RH, Rossoll W, Bassell GJ. Dynamics of survival of motor neuron (SMN) protein interaction with the mRNA-binding protein IMP1 facilitates its trafficking into motor neuron axons. Developmental neurobiology. 2014;74:319–332. doi: 10.1002/dneu.22111. [DOI] [PMC free article] [PubMed] [Google Scholar]
- Fallini C, Zhang H, Su Y, Silani V, Singer RH, Rossoll W, Bassell GJ. The survival of motor neuron (SMN) protein interacts with the mRNA-binding protein HuD and regulates localization of poly(A) mRNA in primary motor neuron axons. J Neurosci. 2011;31:3914–3925. doi: 10.1523/JNEUROSCI.3631-10.2011. [DOI] [PMC free article] [PubMed] [Google Scholar]
- Farina KL, Huttelmaier S, Musunuru K, Darnell R, Singer RH. Two ZBP1 KH domains facilitate beta-actin mRNA localization, granule formation, and cytoskeletal attachment. J Cell Biol. 2003;160:77–87. doi: 10.1083/jcb.200206003. [DOI] [PMC free article] [PubMed] [Google Scholar]
- Friesen WJ, Dreyfuss G. Specific sequences of the Sm and Sm-like (Lsm) proteins mediate their interaction with the spinal muscular atrophy disease gene product (SMN) J Biol Chem. 2000;275:26370–26375. doi: 10.1074/jbc.M003299200. [DOI] [PubMed] [Google Scholar]
- Friesen WJ, Massenet S, Paushkin S, Wyce A, Dreyfuss G. SMN, the product of the spinal muscular atrophy gene, binds preferentially to dimethylarginine-containing protein targets. Mol Cell. 2001;7:1111–1117. doi: 10.1016/s1097-2765(01)00244-1. [DOI] [PubMed] [Google Scholar]
- Fritzsche R, Karra D, Bennett KL, Ang FY, Heraud-Farlow JE, Tolino M, Doyle M, Bauer KE, Thomas S, Planyavsky M, et al. Interactome of two diverse RNA granules links mRNA localization to translational repression in neurons. Cell Rep. 2013;5:1749–1762. doi: 10.1016/j.celrep.2013.11.023. [DOI] [PubMed] [Google Scholar]
- Gabanella F, Butchbach ME, Saieva L, Carissimi C, Burghes AH, Pellizzoni L. Ribonucleoprotein assembly defects correlate with spinal muscular atrophy severity and preferentially affect a subset of spliceosomal snRNPs. PloS one. 2007;2:e921. doi: 10.1371/journal.pone.0000921. [DOI] [PMC free article] [PubMed] [Google Scholar]
- Garcia EL, Wen Y, Praveen K, Matera AG. Transcriptomic comparison of Drosophila snRNP biogenesis mutants reveals mutant-specific changes in pre-mRNA processing: implications for spinal muscular atrophy. Rna. 2016;22:1215–1227. doi: 10.1261/rna.057208.116. [DOI] [PMC free article] [PubMed] [Google Scholar]
- Gustafsson MG. Surpassing the lateral resolution limit by a factor of two using structured illumination microscopy. J Microsc. 2000;198:82–87. doi: 10.1046/j.1365-2818.2000.00710.x. [DOI] [PubMed] [Google Scholar]
- Gustafsson MG, Shao L, Carlton PM, Wang CJ, Golubovskaya IN, Cande WZ, Agard DA, Sedat JW. Three-dimensional resolution doubling in wide-field fluorescence microscopy by structured illumination. Biophys J. 2008;94:4957–4970. doi: 10.1529/biophysj.107.120345. [DOI] [PMC free article] [PubMed] [Google Scholar]
- Hao le T, Duy PQ, Jontes JD, Beattie CE. Motoneuron development influences dorsal root ganglia survival and Schwann cell development in a vertebrate model of spinal muscular atrophy. Hum Mol Genet. 2015;24:346–360. doi: 10.1093/hmg/ddu447. [DOI] [PMC free article] [PubMed] [Google Scholar]
- Holt CE, Schuman EM. The central dogma decentralized: new perspectives on RNA function and local translation in neurons. Neuron. 2013;80:648–657. doi: 10.1016/j.neuron.2013.10.036. [DOI] [PMC free article] [PubMed] [Google Scholar]
- Hu CD, Grinberg AV, Kerppola TK. Visualization of protein interactions in living cells using bimolecular fluorescence complementation (BiFC) analysis. Curr Protoc Cell Biol Chapter. 2006;21 doi: 10.1002/0471143030.cb2103s29. Unit 21 23. [DOI] [PubMed] [Google Scholar]
- Hubers L, Valderrama-Carvajal H, Laframboise J, Timbers J, Sanchez G, Cote J. HuD interacts with survival motor neuron protein and can rescue spinal muscular atrophy-like neuronal defects. Hum Mol Genet. 2011;20:553–579. doi: 10.1093/hmg/ddq500. [DOI] [PubMed] [Google Scholar]
- Kerppola TK. Bimolecular fluorescence complementation (BiFC) analysis of protein interactions in live cells. Cold Spring Harb Protoc. 2013;2013:727–731. doi: 10.1101/pdb.prot076497. [DOI] [PubMed] [Google Scholar]
- Kim YE, Hipp MS, Bracher A, Hayer-Hartl M, Hartl FU. Molecular chaperone functions in protein folding and proteostasis. Annu Rev Biochem. 2013;82:323–355. doi: 10.1146/annurev-biochem-060208-092442. [DOI] [PubMed] [Google Scholar]
- Kislauskis EH, Zhu X, Singer RH. Sequences responsible for intracellular localization of beta-actin messenger RNA also affect cell phenotype. J Cell Biol. 1994;127:441–451. doi: 10.1083/jcb.127.2.441. [DOI] [PMC free article] [PubMed] [Google Scholar]
- Kroiss M, Schultz J, Wiesner J, Chari A, Sickmann A, Fischer U. Evolution of an RNP assembly system: a minimal SMN complex facilitates formation of UsnRNPs in Drosophila melanogaster. Proc Natl Acad Sci U S A. 2008;105:10045–10050. doi: 10.1073/pnas.0802287105. [DOI] [PMC free article] [PubMed] [Google Scholar]
- Kye MJ, Niederst ED, Wertz MH, Goncalves Ido C, Akten B, Dover KZ, Peters M, Riessland M, Neveu P, Wirth B, et al. SMN regulates axonal local translation via miR-183/mTOR pathway. Hum Mol Genet. 2014;23:6318–6331. doi: 10.1093/hmg/ddu350. [DOI] [PMC free article] [PubMed] [Google Scholar]
- Li DK, Tisdale S, Lotti F, Pellizzoni L. SMN control of RNP assembly: from post-transcriptional gene regulation to motor neuron disease. Seminars in cell & developmental biology. 2014;32:22–29. doi: 10.1016/j.semcdb.2014.04.026. [DOI] [PMC free article] [PubMed] [Google Scholar]
- Li YR, King OD, Shorter J, Gitler AD. Stress granules as crucibles of ALS pathogenesis. J Cell Biol. 2013;201:361–372. doi: 10.1083/jcb.201302044. [DOI] [PMC free article] [PubMed] [Google Scholar]
- Lin Y, Protter DS, Rosen MK, Parker R. Formation and Maturation of Phase-Separated Liquid Droplets by RNA-Binding Proteins. Mol Cell. 2015;60:208–219. doi: 10.1016/j.molcel.2015.08.018. [DOI] [PMC free article] [PubMed] [Google Scholar]
- Livak KJ, Schmittgen TD. Analysis of relative gene expression data using real-time quantitative PCR and the 2(−Delta Delta C(T)) Method. Methods. 2001;25:402–408. doi: 10.1006/meth.2001.1262. [DOI] [PubMed] [Google Scholar]
- Lorson CL, Hahnen E, Androphy EJ, Wirth B. A single nucleotide in the SMN gene regulates splicing and is responsible for spinal muscular atrophy. Proc Natl Acad Sci U S A. 1999;96:6307–6311. doi: 10.1073/pnas.96.11.6307. [DOI] [PMC free article] [PubMed] [Google Scholar]
- Martin KC, Ephrussi A. mRNA localization: gene expression in the spatial dimension. Cell. 2009;136:719–730. doi: 10.1016/j.cell.2009.01.044. [DOI] [PMC free article] [PubMed] [Google Scholar]
- Milev MP, Brown CM, Mouland AJ. Live cell visualization of the interactions between HIV-1 Gag and the cellular RNA-binding protein Staufen1. Retrovirology. 2010;7:41. doi: 10.1186/1742-4690-7-41. [DOI] [PMC free article] [PubMed] [Google Scholar]
- Monani UR, Sendtner M, Coovert DD, Parsons DW, Andreassi C, Le TT, Jablonka S, Schrank B, Rossoll W, Prior TW, et al. The human centromeric survival motor neuron gene (SMN2) rescues embryonic lethality in Smn(−/−) mice and results in a mouse with spinal muscular atrophy. Hum Mol Genet. 2000;9:333–339. doi: 10.1093/hmg/9.3.333. [DOI] [PubMed] [Google Scholar]
- Otter S, Grimmler M, Neuenkirchen N, Chari A, Sickmann A, Fischer U. A comprehensive interaction map of the human survival of motor neuron (SMN) complex. J Biol Chem. 2007;282:5825–5833. doi: 10.1074/jbc.M608528200. [DOI] [PubMed] [Google Scholar]
- Patel VL, Mitra S, Harris R, Buxbaum AR, Lionnet T, Brenowitz M, Girvin M, Levy M, Almo SC, Singer RH, Chao JA. Spatial arrangement of an RNA zipcode identifies mRNAs under post-transcriptional control. Genes Dev. 2012;26:43–53. doi: 10.1101/gad.177428.111. [DOI] [PMC free article] [PubMed] [Google Scholar]
- Phan HC, Taylor JL, Hannon H, Howell R. Newborn screening for spinal muscular atrophy: Anticipating an imminent need. Semin Perinatol. 2015;39:217–229. doi: 10.1053/j.semperi.2015.03.006. [DOI] [PubMed] [Google Scholar]
- Piazzon N, Rage F, Schlotter F, Moine H, Branlant C, Massenet S. In vitro and in cellulo evidences for association of the survival of motor neuron complex with the fragile X mental retardation protein. J Biol Chem. 2008;283:5598–5610. doi: 10.1074/jbc.M707304200. [DOI] [PubMed] [Google Scholar]
- Pillai RS, Grimmler M, Meister G, Will CL, Luhrmann R, Fischer U, Schumperli D. Unique Sm core structure of U7 snRNPs: assembly by a specialized SMN complex and the role of a new component, Lsm11, in histone RNA processing. Genes Dev. 2003;17:2321–2333. doi: 10.1101/gad.274403. [DOI] [PMC free article] [PubMed] [Google Scholar]
- Praveen K, Wen Y, Matera AG. A Drosophila model of spinal muscular atrophy uncouples snRNP biogenesis functions of survival motor neuron from locomotion and viability defects. Cell Rep. 2012;1:624–631. doi: 10.1016/j.celrep.2012.05.014. [DOI] [PMC free article] [PubMed] [Google Scholar]
- Prescott AR, Bales A, James J, Trinkle-Mulcahy L, Sleeman JE. Time-resolved quantitative proteomics implicates the core snRNP protein SmB together with SMN in neural trafficking. Journal of cell science. 2014;127:812–827. doi: 10.1242/jcs.137703. [DOI] [PubMed] [Google Scholar]
- Prior TW. Perspectives and diagnostic considerations in spinal muscular atrophy. Genet Med. 2010;12:145–152. doi: 10.1097/GIM.0b013e3181c5e713. [DOI] [PubMed] [Google Scholar]
- Rackham O, Brown CM. Visualization of RNA-protein interactions in living cells: FMRP and IMP1 interact on mRNAs. The EMBO journal. 2004;23:3346–3355. doi: 10.1038/sj.emboj.7600341. [DOI] [PMC free article] [PubMed] [Google Scholar]
- Rage F, Boulisfane N, Rihan K, Neel H, Gostan T, Bertrand E, Bordonne R, Soret J. Genome-wide identification of mRNAs associated with the protein SMN whose depletion decreases their axonal localization. Rna. 2013;19:1755–1766. doi: 10.1261/rna.040204.113. [DOI] [PMC free article] [PubMed] [Google Scholar]
- Ross AF, Oleynikov Y, Kislauskis EH, Taneja KL, Singer RH. Characterization of a beta-actin mRNA zipcode-binding protein. Mol Cell Biol. 1997;17:2158–2165. doi: 10.1128/mcb.17.4.2158. [DOI] [PMC free article] [PubMed] [Google Scholar]
- Rossoll W, Jablonka S, Andreassi C, Kroning AK, Karle K, Monani UR, Sendtner M. Smn, the spinal muscular atrophy-determining gene product, modulates axon growth and localization of beta-actin mRNA in growth cones of motoneurons. J Cell Biol. 2003;163:801–812. doi: 10.1083/jcb.200304128. [DOI] [PMC free article] [PubMed] [Google Scholar]
- Rossoll W, Kroning AK, Ohndorf UM, Steegborn C, Jablonka S, Sendtner M. Specific interaction of Smn, the spinal muscular atrophy determining gene product, with hnRNP-R and gry-rbp/hnRNP-Q: a role for Smn in RNA processing in motor axons? Hum Mol Genet. 2002;11:93–105. doi: 10.1093/hmg/11.1.93. [DOI] [PubMed] [Google Scholar]
- Saal L, Briese M, Kneitz S, Glinka M, Sendtner M. Subcellular transcriptome alterations in a cell culture model of spinal muscular atrophy point to widespread defects in axonal growth and presynaptic differentiation. Rna. 2014;20:1789–1802. doi: 10.1261/rna.047373.114. [DOI] [PMC free article] [PubMed] [Google Scholar]
- Sanchez G, Dury AY, Murray LM, Biondi O, Tadesse H, El Fatimy R, Kothary R, Charbonnier F, Khandjian EW, Cote J. A novel function for the survival motoneuron protein as a translational regulator. Hum Mol Genet. 2013;22:668–684. doi: 10.1093/hmg/dds474. [DOI] [PubMed] [Google Scholar]
- Schrank B, Gotz R, Gunnersen JM, Ure JM, Toyka KV, Smith AG, Sendtner M. Inactivation of the survival motor neuron gene, a candidate gene for human spinal muscular atrophy, leads to massive cell death in early mouse embryos. Proc Natl Acad Sci U S A. 1997;94:9920–9925. doi: 10.1073/pnas.94.18.9920. [DOI] [PMC free article] [PubMed] [Google Scholar]
- See K, Yadav P, Giegerich M, Cheong PS, Graf M, Vyas H, Lee SG, Mathavan S, Fischer U, Sendtner M, Winkler C. SMN deficiency alters Nrxn2 expression and splicing in zebrafish and mouse models of spinal muscular atrophy. Hum Mol Genet. 2014;23:1754–1770. doi: 10.1093/hmg/ddt567. [DOI] [PubMed] [Google Scholar]
- Selth LA, Gilbert C, Svejstrup JQ. RNA immunoprecipitation to determine RNA-protein associations in vivo. Cold Spring Harb Protoc. 2009;2009 doi: 10.1101/pdb.prot5234. pdb prot5234. [DOI] [PubMed] [Google Scholar]
- Shababi M, Lorson CL, Rudnik-Schoneborn SS. Spinal muscular atrophy: a motor neuron disorder or a multi-organ disease? Journal of anatomy. 2014;224:15–28. doi: 10.1111/joa.12083. [DOI] [PMC free article] [PubMed] [Google Scholar]
- Shafey D, Boyer JG, Bhanot K, Kothary R. Identification of novel interacting protein partners of SMN using tandem affinity purification. J Proteome Res. 2010;9:1659–1669. doi: 10.1021/pr9006987. [DOI] [PubMed] [Google Scholar]
- Shukla S, Parker R. Hypo- and Hyper-Assembly Diseases of RNA-Protein Complexes. Trends Mol Med. 2016;22:615–628. doi: 10.1016/j.molmed.2016.05.005. [DOI] [PMC free article] [PubMed] [Google Scholar]
- Tadesse H, Deschenes-Furry J, Boisvenue S, Cote J. KH-type splicing regulatory protein interacts with survival motor neuron protein and is misregulated in spinal muscular atrophy. Hum Mol Genet. 2008;17:506–524. doi: 10.1093/hmg/ddm327. [DOI] [PubMed] [Google Scholar]
- Vangipuram M, Ting D, Kim S, Diaz R, Schule B. Skin punch biopsy explant culture for derivation of primary human fibroblasts. J Vis Exp. 2013:e3779. doi: 10.3791/3779. [DOI] [PMC free article] [PubMed] [Google Scholar]
- Wang H, Dictenberg JB, Ku L, Li W, Bassell GJ, Feng Y. Dynamic Association of the Fragile X Mental Retardation Protein as a Messenger Ribonucleoprotein between Microtubules and Polyribosomes. Mol Biol Cell. 2008;19:105–114. doi: 10.1091/mbc.E07-06-0583. [DOI] [PMC free article] [PubMed] [Google Scholar]
- Xing L, Bassell GJ. mRNA localization: an orchestration of assembly, traffic and synthesis. Traffic. 2013;14:2–14. doi: 10.1111/tra.12004. [DOI] [PMC free article] [PubMed] [Google Scholar]
- Xing L, Yao X, Williams KR, Bassell GJ. Negative regulation of RhoA translation and signaling by hnRNP-Q1 affects cellular morphogenesis. Mol Biol Cell. 2012;23:1500–1509. doi: 10.1091/mbc.E11-10-0867. [DOI] [PMC free article] [PubMed] [Google Scholar]
- Yao J, Sasaki Y, Wen Z, Bassell GJ, Zheng JQ. An essential role for beta-actin mRNA localization and translation in Ca2+-dependent growth cone guidance. Nat Neurosci. 2006;9:1265–1273. doi: 10.1038/nn1773. [DOI] [PubMed] [Google Scholar]
- Yin J, Zhu D, Zhang Z, Wang W, Fan J, Men D, Deng J, Wei H, Zhang XE, Cui Z. Imaging of mRNA-protein interactions in live cells using novel mCherry trimolecular fluorescence complementation systems. PloS one. 2013;8:e80851. doi: 10.1371/journal.pone.0080851. [DOI] [PMC free article] [PubMed] [Google Scholar]
- Zhang H, Xing L, Rossoll W, Wichterle H, Singer RH, Bassell GJ. Multiprotein complexes of the survival of motor neuron protein SMN with Gemins traffic to neuronal processes and growth cones of motor neurons. J Neurosci. 2006;26:8622–8632. doi: 10.1523/JNEUROSCI.3967-05.2006. [DOI] [PMC free article] [PubMed] [Google Scholar]
- Zhang HL, Pan F, Hong D, Shenoy SM, Singer RH, Bassell GJ. Active transport of the survival motor neuron protein and the role of exon-7 in cytoplasmic localization. J Neurosci. 2003;23:6627–6637. doi: 10.1523/JNEUROSCI.23-16-06627.2003. [DOI] [PMC free article] [PubMed] [Google Scholar]
- Zhang HL, Singer RH, Bassell GJ. Neurotrophin regulation of beta-actin mRNA and protein localization within growth cones. J Cell Biol. 1999;147:59–70. doi: 10.1083/jcb.147.1.59. [DOI] [PMC free article] [PubMed] [Google Scholar]
- Zhang Z, Pinto AM, Wan L, Wang W, Berg MG, Oliva I, Singh LN, Dengler C, Wei Z, Dreyfuss G. Dysregulation of synaptogenesis genes antecedes motor neuron pathology in spinal muscular atrophy. Proc Natl Acad Sci U S A. 2013;110:19348–19353. doi: 10.1073/pnas.1319280110. [DOI] [PMC free article] [PubMed] [Google Scholar]
Associated Data
This section collects any data citations, data availability statements, or supplementary materials included in this article.