

Abstract
The Rett syndrome-associated methyl-CpG binding protein 2 (MeCP2) selectively binds methylated DNA to regulate transcription during the development of mature neurons. Like other members of the methyl-CpG binding domain (MBD) family, MeCP2 functions through the recognition of symmetrical 5-methylcytosines in CpG (mCG) dinucleotides. Advances in base level resolution epigenetic mapping techniques have revealed, however, that MeCP2 can bind asymmetrically methylated and hydroxymethylated CpA (h/mCA) dinucleotides and this alternative binding selectivity modifies gene expression in the developing mammalian brain. The structural determinants of binding to mCA and hydroxymethylated DNA have not been previously investigated. Here, we employ ITC and NMR spectroscopy to characterize MeCP2 binding to methylated and hydroxymethylated mCG and mCA DNA; examine the effects of Rett syndrome-associated missense mutations; and make comparisons to the related and evolutionarily most ancient protein, MBD2. These analyses reveal that MeCP2 binds mCA with high affinity in a strand-specific and orientation-dependent manner. In contrast, MBD2 does not show high affinity or methyl-specific binding to mCA. The Rett-associated missense mutations (T158M, R106W, and P101S) destabilize the MeCP2 MBD and disrupt recognition of mCG and mCA equally. Finally, hydroxymethylation of a high-affinity mCA site does not alter the binding properties; whereas, hemi-hydroxylation of the equivalent cytosine in an mCG site decreases affinity and specificity. Based on these findings, we suggest MeCP2 recognition of methylated/hydroxymethylated CpA dinucleotides functions as an epigenetic switch redistributing MeCP2 among mCG and mCA loci.
Keywords: epigenetics, Rett syndrome, methyl-binding domain, protein-DNA interaction, relaxation dispersion
Graphical Abstract
Introduction
Methyl-CpG binding protein 2 (MeCP2*) functions as a methylation-dependent transcriptional regulator, tuning the expression of methylated target genes throughout neuron maturation. Missense and frameshift mutations in MeCP2 occur in up to 80% of Rett Syndrome cases, an autism spectrum disorder characterized by arrested neurological development 6–18 months after birth [1–3]. Although MeCP2 was initially identified by its affinity for 5-methylcytosines in CpG (mCG) dinucleotides, advancements in methylation sequencing methods have enabled the examination of the developing neuronal methylome with greater resolution of non-CG methylated sites (mCH, where H = A, C, or T) and locations of hydroxymethylation. The results of these studies suggest the MeCP2 activity most relevant to development may, in fact, be at non-CG methylated sites. Healthy human and murine neurons accumulate mCH and hydroxymethylcytosine (hmC) marks while maintaining relatively stable levels of mCG from fetal to adult development [4]. MeCP2 binding correlates with mCH density and has higher occupancy of genes with elevated mCH levels. These loci appear to have functional roles in regulating neuronal gene expression as mouse models of MeCP2 disorders demonstrate elevated mCH levels in misregulated genes [5]. The most biologically significant MeCP2 mCH binding events appear to be to mCA and hmCA. By EMSA, MeCP2 demonstrates a lower affinity for mCC, mCT, hmCG and unmethylated DNA, than sequences containing mCG, mCA and hmCA sites [6,7]. Additionally, ChIP-seq analysis of the murine frontal cortex revealed high mCA and hmCA levels at loci of MeCP2 enrichment, suggesting they serve as MeCP2 binding sites in vivo [8].
The report of MeCP2 mCH binding events holds important implications for the structure function relationship of methylation-dependent DNA binding. Seven proteins comprise the human methyl-CpG binding domain (MBD) family, the first discovered, MeCP2, and MBD1-6 [9]. The protein family members share a homologous MBD domain of about seventy amino acids with varying degrees of specificity for symmetrically methylated mCG dinucleotides [10]. The available crystal and solution structures of MBD proteins bound to DNA reveal mCG motifs are similarly recognized across the family (PDBs: 1IG4, 3C2I, 2KY8, 3VXX) [11–14]. Two conserved arginine residues form bidentate hydrogen bonds with the symmetrical guanine bases and pack their guanidinium groups against the methyl-cytosine on the respective strand. A highly-conserved tyrosine at the protein-DNA interface interacts with the methyl-cytosine methyl group on one strand and is critical to forming a highly specific interaction with mCG DNA (Fig. 1A) [12]. The genetic, biochemical and biophysical properties of mCG and hmCG binding by MBD proteins have been extensively studied [10,15–19]. MeCP2, however, is the first MBD protein with demonstrated selectivity for asymmetrically methylated mCH and hmCH [5–8]. The reported evidence even suggests binding methylated and hydroxymethylated CpA (h/mCA) dinucleotides mediates the primary effects of MeCP2 on gene expression in the developing mammalian brain. Therefore, we sought to understand the features that enable binding these ‘alternative’ motifs, if they are unique to MeCP2 and how they may affect the distribution of MBD proteins across the genome.
Figure 1. MeCP2 MBD binding site with mCH.

Models comparing the (A) mCG complex, and highlighting in yellow the hydrogen bonds disrupted by substituting an AT base pair for one CG on the (B) 5′ or (C) 3′ strand. The sequence of the oligonucleotide used in the study is below each model, methylated bases are in red and substitutions are bolded.
In a few sequence-specific contexts, MBD-containing proteins have an enhanced selectivity for mCG sites. MBD2 has been shown to have an increased affinity for mCGG [13], while SELEX experiments with MeCP2 mCG suggested a preference for an adjacent [A/T] run of at least four bases [20]. In the crystal structure (PDB: 3C2I) [12], the MeCP2:mCG complex assembles such that the visible c-terminal residues of the MBD make contacts with the phosphate backbone of the AATT motif in the BDNF promoter sequence. We hypothesized this flanking A/T region serves to orient the MeCP2 MBD on the mCH site in one direction, positioning Arg111 and Arg133 to interact with a guanine on a particular strand. Previous work has suggested the conserved MBD arginines contribute unequally to DNA binding [21–23]. Therefore, we anticipated the binding of asymmetrically methylated mCA and hmC sites would be a strand-specific recognition event and asked if that could be differentially affected by Rett Syndrome-associated mutations.
Here, we investigated the interactions of MeCP2, and the related protein MBD2, with a defined single mCG or mCA site in a native high-affinity target sequence (Fig. 1B and 1C). We employed nuclear magnetic resonance spectroscopy and isothermal calorimetry to obtain robust, quantifiable binding measurements and elucidate the molecular details of the accommodation of mCH. As predicted, both MeCP2 and MBD2 better recognize an adenine substitution of the 3′ strand guanine (mCA 3) than on the 5′-strand (mCA-5). MeCP2, however, uniquely maintains a high affinity for mCA-3 possibly reflecting the dynamic flexibility of the bound state. The strand specificity is strongly affected by local sequence context and not primarily determined by the direction of the AATT motif, as MeCP2 demonstrated very similar affinities for mCAC on either stand. Additionally, we examined the effect of Rett syndrome associated mutations in the MeCP2 MBD on the ability to recognize methylation of CG and CA. While the mutations consistently destabilized the folded domain, we found at least two of the more common mutations (T158M and P101S) retain recognition of both mCG and mCA sites. Finally, we compared MeCP2 binding to hemi-hmCG and hmCA, and demonstrate the effects of hmC on the distribution among local binding sites, giving insight into a potential mechanism of regulating MeCP2 directed transcriptional control.
Results
Thermodynamic analysis of MeCP2 and MBD2 MBD-mCH interactions
We asked if the binding of asymmetrically methylated mCA and hmC sites by MeCP2 would be a strand-specific recognition event and if it is unique to MeCP2 among the MBD family of proteins. We compared the binding affinities of oligonucleotides based on a native MeCP2 binding site in the BDNF promoter with either a symmetrically methylated mCG, or an asymmetrically methylated mCA, substituting an adenine for the guanine on either the 5′ or 3′ strand. Models are shown of the expected interactions for each interface based on the x-ray crystal structure of the MeCP2:mCG complex (PDB: 3C2I) (Fig. 1A–C) [12]. Binding thermodynamics and dissociation constants were measured by isothermal calorimetry (ITC). MeCP2 binds the BDNF promoter sequences with a stoichiometry of 1:1, regardless of the methylated cytosine position. MeCP2 binding affinity has an apparent Kd value of 50 nM for mCG and 81 nM for mCA-3, and has a significantly lower affinity for mCA-5 with a Kd value of 409 nM (Fig. 2A–C and Table 1). The differences in binding affinity of MeCP2 for the mCA-5 and mCA-3 oligomers reflect an unfavorable change in entropy upon binding (TΔS = 2.8 and7.7 kcal/mol for mCA-5 and mCA-3, respectively) that is or is not fully compensated by a more favorable change in enthalpy (ΔH =−11.9 and −17.8 kcal/mol for mCA-5 and m-CA3, respectively). However, when the base following the mCA is replaced with a cytosine, high affinity binding is maintained for mCAC-3 with a Kd value of 36 nM and restored for mCAC-5 with a Kd value of 79 nM (Figure S1 and Table 1). As with mCA-3, a large unfavorable change in entropy for mCAC-3 and mCAC-5 (-TΔS = 5.7 and 8.0 kcal/mol, respectively), is compensated by a larger favorable change in enthalpy (ΔH =−16.3 and −18.1 kcal/mol, respectively). These results show that MeCP2 maintains high affinity binding to mCA-3, mCAC-3, and mCAC-5 through the development of additional enthalpically favorable interactions at the expense of a greater reduction in entropy. In contrast, MeCP2 does not effectively adapt to mCA-5 with a less favorable change in enthalpy as compared to mCpG (ΔH =−11.9 kcal/mol) with a similar change in entropy (-TΔS = 2.8 kcal/mol) (Figures 2B and Table 1).
Figure 2. MeCP2 and MBD2 binding affinity for mCH.

ITC titrations of the MeCP2 MBD with (A) mCG, (B) mCA-5 and (C) mCA-3 oligonucleotides, and of the MBD2 MBD with (D) mCG and (E) mCA-3. The lines represent the fit of the data (Table 1).
Table 1.
Binding affinity of methyl-binding domains to methylated BDNF DNA
| Complex | KD(nM) | n | ΔH (kcal/mol) | −TΔS (kcal/mol) | ΔG (kcal/mol) |
|---|---|---|---|---|---|
| MeCP2:mCG | 50 ± 17 | 1.1 | −13.7 ± 0.3 | 3.3 | −10.4 ± 0.2 |
| MeCP2:mCA-5 | 409 ± 87 | 1.3 | −11.9 ± 0.3 | 2.8 | −9.1 ± 0.1 |
| MeCP2:mCA-3 | 81 ± 13 | 0.9 | −17.8 ± 0.2 | 7.7 | −10.1 ± 0.1 |
| MBD2:mCG | 157 ± 23 | 1.1 | −15.9 ± 0.2 | 6.2 | −9.7 ± 0.1 |
| MBD2:mCA-3 | >1900 | 0.9 | −11.8 ± 0.9 | 3.7 | −8.1 ± 0.2 |
| MeCP2:mCAC-5 | 79 ± 17 | 0.9 | −18.1 ± 0.2 | 8.0 | −10.1 ± 0.1 |
| MeCP2:mCAC-3 | 36 ± 10 | 0.8 | −16.3 ± 0.3 | 5.7 | −10.6 ± 0.2 |
For comparison, we assessed mCA recognition by MBD2, which shows very high selectivity for mCG [16,24] and represents the most evolutionarily ancient MBD protein [25,26] (Fig. 3A). We found MBD2 has a slightly lower affinity than MeCP2 for the mCG BDNF sequence, with an apparent a Kd value of 157 nM (Fig. 2D). Unlike MeCP2, however, the binding affinity decreased substantially with the substitution of adenine on the 3′-strand. The ITC measurements presented an apparent Kd value of at least 1.5 μM (Fig. 2E), however, the isotherm of binding did not reach a plateau, and therefore was unable to be adequately fit with a one-site model. The failure to accomplish binding site saturation, regardless of increased DNA concentration, indicates a low-affinity and non-specific interaction.
Figure 3. Binding modes of MeCP2 and MBD2 to mCH.

(A) A structural alignment of the MBD domains of MeCP2 (cyan) and MBD2 (purple). (B) A schematic illustrating the exchange of an MBD between the non-specific (left) and methylation specific (right) binding modes. mC bases are represented as red circles. (C) An overlay of 15N HSQC spectra for key reporter residues of wild-type MeCP2 and MBD2 bound to CG, mCG, mCA-5, and mCA-3.
Chemical shift perturbations map the transition from the non-specific to methylation-specific binding mode
The NMR chemical shift parameter is highly sensitive to changes in the local environment and, thereby, subtle changes in the three-dimensional structure of proteins. The residue-specific changes in the amide backbone of MeCP2 bound to the BDNF promoter sequences were monitored by 1H/15N-Heteronuclear Single-Quantum Correlation (HSQC) NMR spectroscopy and compared using standard chemical shift perturbations (CSPs). In NMR studies of the MBD family proteins, we identified linear chemical shift changes that correlate with methylated DNA binding and present in every ortholog and paralog examined to date [13,26–28]. In particular, two of these resonances (Gly27 and Ala30 of MBD2) show large CSPs between the non-specific and methylation-specific binding modes, such that we have used these resonances as reporters of mCG binding [27]. We assigned the MeCP2 chemical shifts (BMRB: 26978) and likewise found the signature linear CSP of Gly114 and Ala117 upon binding methylated DNA (Fig. 3B). To confirm that the chemical shift changes reflect the bound state, we collected HSQCs for MeCP2:CpG at 200:220, 400:400, and 400:800 μM which show that MeCP2 is fully bound under the conditions of our analysis (Fig. S2). Therefore, they provide a unique opportunity to directly observe the domain’s non-specific and methylation-specific binding modes.
We compared the positions MeCP2 Gly114 and Ala117 or MBD2 Gly27 and Ala30 peaks when fully bound to mCA-5 and mCA-3. The chemical shifts for both residues were almost equivalent in the MeCP2:mCG and MeCP2:mCA-3 spectra, but in the MeCP2:mCA-5 complex Gly114 shifted from 102.8 ppm downfield in 15N to 103.5 ppm and Ala117 shifted downfield in 1H from 6.8 ppm to 6.9 ppm. Based on the measured binding affinity of MeCP2 for mCA-3 and mC-5, MeCp2 is saturated (99.6% and 98.3% bound, respectively) under the conditions of the experiment, such that the CSPs reflect the bound state. Similar to the CSPs observed in MeCP2, binding to mCA-5 shifted MBD2 resonances for Gly27 downfield from 102.5 ppm in 15N to 106.2 ppm and Ala30 from 6.85 to 7.15 ppm in 1H. Surprisingly, Gly27 and Ala30 also had large CSPs with an adenine substituted on the 3′-strand, shifting Gly27 downfield in 15N to 104.5 ppm and Ala30 to 7.00 ppm in 1H (Fig. 3C). Compared to mCG bound chemical shifts of MeCP2, mCA-5 and mCA-3 binding generated CSPs throughout the MBD, plotted in Fig. 4A. The largest perturbations clustered in three regions of the protein sequence, seen mapped to the crystal structure in Fig. 4B (PDB: 3C2I) [12].
Figure 4. Structural changes induced by binding of MeCP2 and MBD2 to mCH.

(A) Bar graphs showing the CSPs induced by MeCP2 binding to mCA-5 (top) and mCA-3 (bottom), compared to mCG bound chemical shifts. Sequence regions with the greatest CSPs are indicated. (B) Mapping of the CSPs induced by mCA-5 (left) and mCA-3 (right) binding to MeCP2 on the crystal structure of mCG-MeCP2 (PDB 3C2I). Residues with CSPs larger than 0.5 (yellow) and 1.0 (orange) p.p.m. are represented as sticks. (C) Representative relaxation dispersion curves of residues in the MeCP2:mCG complex, demonstrating slow exchange fit with the TSMFK01 model (left) or fast exchange fit with the CR72 model (right), corresponding to the yellow and orange spheres, respectively, in the structural map in (D).
Domain structures accommodating of mCA are dynamic in the mCG bound conformation
Relaxation dispersion experiments enable the quantitation of protein motions, detecting conformational exchange of dynamic residues. Motions in the MeCP2:mCG complex were measured with Carr-Purcell-Meiboom-Gill (CPMG) relaxation dispersion pulse sequences. Data was analyzed by relax-nmr software (see representative relaxation curves in Fig. 4C) and fit with either the CR72 or TSMFK01 2-site model [29–31]. Residues exchanged on different timescales and could not be uniformly fit to a single model. Therefore, the residues with faster exchange rates were fit to the CR72 model [32] and those with very slow exchange rates, within the range of millisecond to second time scale, were fit to the TSMFK01 model [33]. The extracted fit parameters are listed in Table S1 and S2, for the CR72 and TSMFK01 models, respectively. A large fraction of the well-resolved peaks displayed dispersion and residues with observable exchange are mapped to the MeCP2:mCG complex crystal structure in Fig. 4D (PDB: 3C2I) [12]. Regions displaying dynamic motion were the flexible loops at the n-terminus (R85, G92, M94, E102, T105) and the c-terminus (N153, D157, T160, G161, R162); the major groove binding loop and DNA interface (R111, K112, G114, R115, R133, S134, V136, E137); and residues in the hydrophobic core (V122, L124, I125, K130, A131, F132). Residues with slower exchange are highlighted as yellow spheres in Fig. 4D and clustered in the C-terminal loop, α-helix, and β-loop.
Rett Syndrome mutations do not affect MBD preference for mCG and mCA
Several of the Rett Syndrome-associated mutations (T158M, R016W, and P101S) were examined for recognition of mCG and mCA-3 by HSQC. All three mutants had less defined and dispersed spectra than wild-type, to varying degrees (Fig. S3). The spectrum for the R106W mutant lacked peaks for reporter residues Gly114 and Ala117, which indicates significant line broadening and a lack of stable interaction with mCG or mCA (Fig. S3C). The spectra for T158M and P101S, however, did show similar chemical shifts for reporter residues, indicating these mutants retain the ability to selectively and preferentially bind mCG and mCA (Fig. S3A and B).
Hydroxymethylation reduces MeCP2 affinity for CG but not CA and shifts the distribution of MBD populated sites
To compare the effects of hydroxymethylation on CG and CA DNA binding, we synthesized additional oligonucleotides, one hemi-hydroxymethylated at the CG position and one with a hydroxymethylated CA pair, both on the 3′ strand (Fig. 5A). We examined binding thermodynamics and dissociation constants of MeCP2 by ITC and measured an apparent Kd value of 667 nM for hemi-hmCG and 167 nM for hmCA-3 (Fig. 5B and Table 2). When inspected by HSQC, methylation-specific reader residues’ resonances shifted in the MeCP2:hemi-hmCG complex to 103.1 ppm in 15N for Gly114 and 6.8 ppm in 1H for Ala117. By the same method, in the MeCP2:hmCA-3 complex the resonances of Gly114 and Ala117 are observed at 102.8 ppm in 15N and 6.8 ppm in 1H, respectively (Fig. 5C). The CSPs throughout the domain clustered in three regions of the protein sequence (Fig. 6A), seen mapped to the crystal structure in Fig. 6B (PDB: 3C2I) [12].
Figure 5. MeCP2 MBD binding to hydroxymethylated CH.

(A) Models of the MeCP2 MBD binding site comparing the hemi-hydroxymethylated CG (left) and hydroxymethylated CA-3 (right) complexes, highlighting in yellow the predicted hydrogen bonds disrupted compared to the mCG bound crystal structure. The sequences of the oligonucleotides used in the studies are below each model, including methylated cytosines (red) and hydroxymethylated bases (underlined). (B) ITC titrations of MeCP2 MBD with hemi-hmCG (left) and hmCA-3 (right). The lines represent the fit to a one-site model (Table 2). (C) An overlay of 15N HSQC spectra for key reporter residues Gly114(left) and Ala117(right) of wild type MeCP2 bound to mCG (gray), hemi-hmCG (red) and hmCA-3 (navy).
Table 2.
Binding affinity of MeCP2 to hydroxymethylated BDNF DNA
| Substrate | KD(nM) | n | ΔH (kcal/mol) | −TΔS (kcal/mol) | ΔG (kcal/mol) |
|---|---|---|---|---|---|
| hemi-hmCG | 667 ± 129 | 0.7 | −10.5 ± 0.4 | 1.7 | −8.8 ± 0.1 |
| hmCA-3 | 161 ± 26 | 1.0 | −18.1 ± 0.3 | 8.4 | −9.6 ± 0.1 |
Figure 6. Structural changes induced by binding of MeCP2 to hmCH.

(A) Bar graphs showing the CSPs induced by MeCP2 binding to hmCA-3 (top) and hemi-hmCG (bottom), compared to mCG bound chemical shifts. Sequence regions with the greatest CSPs are indicated. (B) Mapping of the CSPs induced by hemi-hmCG (left) and hmCA-3 (right) binding to MeCP2 on the crystal structure of mCG-MeCP2 (PDB 3C2I). Residues with CSPs larger than 0.5 (yellow) and 1.0 (orange) p.p.m. are represented as sticks.
By NMR spectroscopy one can directly measure the relative population of distinct states and use differences in chemical shifts to detect the distribution between binding sites. To test whether the differences in relative binding affinities of MeCP2 for mCH and hmCH correlate with preferential localization, we examined MeCP2 incubated with a 1:1 mixture of mCG:mCA (Fig. 7A) and hemi-hmCG:hmCA (Fig. 7B). Resonances for both populations of complexes were consistent with a slow exchange between mCG and mCA DNA molecules. Hence, the peak height of six residues demonstrating non-overlapping chemical shifts was measured to derive the relative populations of the mCA and mCG bound states. In the presence of equal molar quantities, the fraction bound to mCG was 68.6 ± 4.1 % and to mCA was 31.4 ± 4 % consistent with preferential binding to mCG. When incubated with the hydroxymethylated DNAs, 33.4 ± 3.1 % bound to hemi-hmCG and 66.6 ± 3.1 % bound to hmCA-3, demonstrating MeCP2 now preferentially localizes to the hmCA site (Fig. 7C).
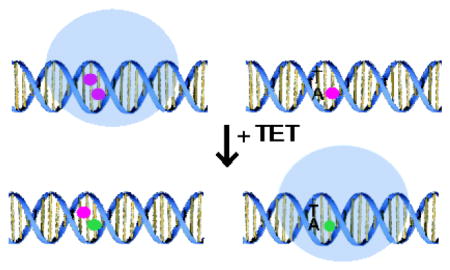
Figure 7. MeCP2 MBD distribution on methylated and hydroxymethylated CH.

15N HSQC spectra of key reporter residues of MeCP2 bound to (A) mCG (red), mCA-3 (blue) and a 1:1 mixture (green) with 1D slices on left and 2D overlays on right. Below, in (B) are reporter residues of MeCP2 bound to hemi-hmCG (red), hmCA-3 (blue) and a 1:1 mixture (green) with 1D slices on left and 2D overlays on right. (C) Box plot of the fraction of MeCP2 bound to mCG:mCA-3 and hmCG:hmCA-3 (n=6). (D) Model of distribution shift from mCG motifs to mCA-3 motifs (red circles) upon hydroxymethylation (green circles) of both sites.
Discussion
MeCP2 uniquely recognizes mCA sites in an orientation-dependent and methylation-specific binding mode
Our results suggest that the MeCP2 methyl-binding domain orients to interact specifically with the 5′-strand guanine through Arg111, anchored by Asp121, and with the 3′-strand guanine via Arg133. Tyr123, in a hydration shell around the methyl group, recognizes the 5′-strand mC. Substituting adenine for the 5′-strand guanine disrupts hydrogen bonding with Arg111, leaving intact the 3′-G: Arg133 and 5′-mC: Tyr123 interactions. In contrast, the change of the 3′-strand guanine to adenine results in the loss of hydrogen bonds between 3′-G: Arg133 while maintaining 5′-G: Arg111 interaction and substituting the 5′-mC with thymine to preserve the methyl-recognition of Tyr123. We originally hypothesized that the orienting of the MeCP2 MBD on DNA is driven by the proximal [A/T] region identified in SELEX experiments [20]. However, a recent preprint presents evidence that the primary MeCP2 bound mCA sequences in vivo occur in the mCAC context [34], therefore we asked if the neighboring base could alter the strand-specific preference. We found that MeCP2 binds mCAC on either strand with high affinity irrespective of the relative position of the BDNF promoter sequence’s AATT motif, however, a slight preference was observed for the 3′-mC orientation. This suggests that MeCP2 binding to mCA is strand-specific and orientation-dependent, driven by a preference for sites followed by a C or T to G.
As expected of a major-groove DNA interaction, the ITC experiments demonstrate mCG, mCA-5, and mCA-3 binding is an exothermic and enthalpically driven process [35,36]. The ITC measurements also reveal the methylated cytosine environment does not affect MeCP2:DNA binding stoichiometry but does affect binding affinity. We anticipated an mCA-3 preference for MeCP2 binding and found a less than two-fold change in binding affinity with an adenine substitution of the 3′-strand guanine, compared to a ten fold decrease with a substitution on the 5′-strand (Table 1). This observation is consistent with computational quantum mechanical modelling that suggested Arg133 is more exible than Arg111, which is strongly xed by hydrogen bonding with the Asp121 side chain, and that the Arg133 guanidinium group rotates towards Arg111 in the presence of a 5′-strand methylated base to create a ‘closed/locked’ state (Fig. 1A) [21]. Our relaxation dispersion measurements of the MeCP2 MBD bound to mCG DNA provide additional support for this model, measuring an exchange rate approximately 860x faster for Arg133 than Arg111 (Table S1 and S2). Remarkably, binding to mCA-3, mCAC-5 or mCAC-3 is more exothermic than mCG to compensate for a substantial decrease in entropy of 2–5 kcal/mol (Table 1). This suggests that MeCP2 forms additional enthalpically favorable hydrogen bonds and/or ionic interactions to adapt to binding alternative substrates with high affinity, however, the mCH-bound state is more restricted with fewer degrees of freedom.
In the methylation-specific binding mode, the MBD’s major-groove binding β-loop is stabilized by the hydrogen bonding between the 5′-strand guanine and Arg111, at the base of β-strand 1. Therefore, the resonances of loop residues are reporters of methylation-specific and non-specific binding by analysis of chemical shifts [27]. The linearity of the chemical shifts of Gly114and Ala117 of MeCP2 between the different DNAs is characteristic of fast exchange between the major conformations (Fig. 3C). We varied the ratio of bound MeCP2 and observed no measurable change in peak position (Fig. S2), therefore confirming that the shift of reporter residues do not reflect exchange between bound and free but instead reflect exchange between methylation specific and non-specific binding modes (as we have described previously for MBD2 and MBD3 [27]). When bound to mCA-5, the substitution of the 5′-strand guanine for adenine disrupts the bidentate hydrogen bond with Arg111 which fails to stabilize the loop, thus MeCP2’s Gly114 and Ala117 chemical shifts occur closer to their conformation on unmethylated DNA. When compared across the domain, residues with CSPs above 0.05 ppm between mCG and mCA bound MeCP2 clustered around the DNA interface and the major-groove binding loop, as well as the more distant helix 1 (Fig. 4A and B). In these regions and overall, the measured CSPs are fewer and smaller in the presence of mCA-3 than mCA-5, consistent with the mCA-3 bound state more closely resembling the mCG-bound MeCP2 MBD.
In contrast, the affinity of the MBD2 MBD for BDNF DNA is severely decreased by substitution of adenine, even on the 3′-strand (Fig. 2D and E). The methylation selectivity for mCA is also diminished, although less so for mCA-3, as indicated by the chemical shifts of Gly27 and Ala30 away from the specifically mCG-bound conformation (Fig. 3C) and towards the non specifically CG-associated conformation [27]. Taken together, the HSQC measurements demonstrate methylation-specific binding is orientation dependent for both MeCP2 and MBD2. They also imply mCA-3 selectivity is unique to MeCP2 among the MBD family proteins, and suggest that changes in helix 1 could contribute to accommodating mCA.
Therefore, we postulate MeCP2 retains high affinity for non-CG methylated DNA due to an increase in the length of helix 1. As we have described previously for MBD4 [28], MeCP2 has a small insertion of 4 amino acids that extends helix 1 by one additional turn as compared to MBD2. This addition contributes to a larger hydrophobic core possibly stabilizing the isolated domain. Consistent with this hypothesis, the HSQC spectrum of MeCP2 MBD in the absence of DNA is well-dispersed indicative of a folded domain, while that of MBD2 MBD is significantly broadened until bound to DNA, indicating it undergoes a disorder-to-order transition upon binding (Fig. S4). Likewise, the CD spectra of the isolated domains indicate that MeCP2 is more structured in the absence of DNA (Fig. S5).
Furthermore, relaxation dispersion measurements can detect dynamic processes, such as side chain reorientation, loop motion, secondary structure changes and hinged domain movements. The dispersion observed in the MeCP2:mCG complex indicates residues at the DNA interface undergo microsecond to millisecond motions (Table S1 and S2). This exchange likely represents the rapid breaking and reforming of salt bridges and hydrogen bonds between coordinating amino acids, as well as direct amino acid-base interactions. The loops of the N and C-terminal unstructured regions demonstrated the fastest exchange rates which likely reflects a dynamic transient interaction between the amino-acid residues and the DNA backbone, leading to large chemical shifts, noted with orange in Fig. 4 [37]. The majority of residues with distinguishable chemical shifts along helix 1 and the β-loop display slower exchange, noted in yellow in Fig. 4, on the millisecond to second time scale, consistent with larger coordinated motions. Taken with the chemical shift analysis, the relaxation dispersion measurements further indicate flexibility and dynamics in helix 1 and at the protein-DNA interface.
Rett Syndrome associated mutations in the MeCP2 MBD do not eliminate methylation recognition function
Interestingly, mutations in the MeCP2 MBD that disrupt the domain architecture do not preferentially affect selectivity for mCG or mCA sequences. The R016W mutation inserts a bulky tryptophan residue into the domain’s hydrophobic core, destabilizing the MBD as evident from the decrease in discretely defined peaks in an HSQC spectrum. The presence of neither mCG or mCA-3 DNA ordered the R106W MBD sufficiently to observe peaks for the Gly114 and Ala117 reporter residues (Fig. S3C). The less disruptive mutations of T158M and P101S lead to line-broadening and reduce dispersion in the apo spectra, compared to wild-type (Fig. S4A), but apparently retain the ability to bind mC in the methylation-specific binding mode in the preferred orientation. The chemical shifts indicate the loss of hydrogen bonds between Arg133 and the 3′-strand guanine of the mCA-3 sequence does not inhibit mC recognition even when the MBD is moderately destabilized (Fig. S3A and B). We were unable to sufficiently concentrate the mutant proteins for ITC analysis due to aggregation; however, our results support the recent suggestion that mutations in the MBD may not cause Rett by affecting selectivity for methyl-cytosines. Instead, our data are consistent with the dysfunction associated with changes in MeCP2 levels in both MeCP2-null and -overexpressing mice [5,38–40]. Furthermore, Rett Syndrome associated mutations lead to much lower MeCP2 cellular concentrations as compared to wild type [41]. Perhaps aggregates of destabilized MeCP2 more readily signal for degradation and the remaining soluble protein cannot fully occupy high affinity sites, creating a dilution effect that is further amplified by the lower overall affinity of the mutant protein for both mCpA and mCpG sites. Our findings further support the therapeutic potential of re-stabilizing mutant MeCP2 to restore native protein function, but this model of MeCP2 dysfunction needs to be rigorously tested via extensive investigation.
Hydroxymethylation reduces MeCP2 affinity for CG while maintaining selectivity for CA
By HSQC, there were clear chemical shift differences between the hemi-hmCG and hmCA-3 bound states, however, the reporter residues of the methylation bound state were relatively close to each other and mCG (Fig. 5C). The ITC derived Kd is a highly sensitive measure of global binding affinity, whereas the chemical shift changes of Gly114 and Ala117 reflect distribution between CG specific and non-specific binding modes. Our data indicates MeCP2 recognizes hmC in a similar manner as mC, despite not retaining a high affinity for hemi -hmCG. From examining the 3D models based on the MeCP2:mCG crystal structure (Fig. 5A) (PDB: 3C2I) [12], we expected both hemi-hmCG and hmCA-3 would retain the 5′-G:Arg111 interaction; supply a methyl-group for recognition by Tyr123; and, by adding a hydroxyl group to the mC that packs against Arg133, potentially disrupt the hydrophobic interaction. The preservation of the 5′-G:Arg111 interaction continues to stabilize the β-loop in which Gly114 and Ala117 reside. As such, their corresponding methylation specific reporter peaks in the hemi hmCG and hmCA HSCQs do not shift far from mCG (Fig. 5C). Furthermore, the hemi-hmCG bound conformation remains highly similar to mCG with the fewest and least extreme changes in chemical shift (Fig. 6A and B).
In contrast, hydroxymethylation of the 5′-mC significantly changes the binding affinity of MeCP2. Our ITC measurements demonstrate only a two-fold difference in the apparent Kd between mCA-3 and hmCA-3, however, hydroxymethylation of the same cytosine position in the hemi-hmCG oligo resulted in a greater than ten-fold decrease from the mCG binding affinity (Fig. 5B and Table 2). This observation implies that the anchoring of Arg133 through hydrogen bonding with the mCG 5′-strand guanine impedes the accommodation of a hydroxyl group on the 5′-strand mC. When adenine replaces the 5′-strand guanine, Arg133 is ‘unlocked’ and released from the hydroxyl-imposed steric tension.
We asked if the changes in binding affinity with hydroxymethylation would reflect a change in the distribution of MeCP2 among mC sites. The Kd measurements would suggest MeCP2 equitably occupies mCG and mCA-3 sites. Peak heights in an HSQC provide information about the relative populations of states. In the presence of a 1:1 mixture of mCG:mCA-3 DNA, peaks with distinct chemical shifts between mCG and mCA-3 bound conformations (Fig. 7A) indicated nearly 70% of the MeCP2 present was mCG bound (Fig. 7C). Alternatively, upon addition to a 1:1 mixture of hemi-hmCG:hmCA-3 DNA (Fig. 7B), the MeCP2 populations shifted to over 65% hmCA-3 bound (Fig. 7C), consistent with the discrepancy in binding affinity. To date, hmCA has rarely been observed in base-level resolution mapping of the hydroxymethylome of the human neurons [8], however, hmCG is known to accumulate in the brain throughout development, especially in the gene bodies of highly expressed genes [4,17,42]. Therefore, our findings support a model in which hydroxymethylation could serve as a molecular switch to effectively redistribute MeCP2 from mCG to h/mCA-3 sites, modeled in Fig. 7D, and warrant further investigation into the role of MeCP2 function at mCA-3 and hmCA-3 loci.
Materials and Methods
Protein expression and purification
Amino acid residues 2–72 from chicken MBD2 were expressed and purified as a fusion protein with thioredoxin and a hexahistidine N-terminal tag using a modified pET32a (Novagen) vector as previously described [13]. Amino acid residues 77–167 from human MeCP2 was cloned into the pet28a (Novagen) vector, untagged, and transformed into BL21 Rosetta (DE3) cells (Novagen). Bacterial cultures were grown in LB broth or isotopically labeled M9 media at 37 °C until the culture reached an A600 of 0.6 absorbance units. Cultures were induced with 1 mM isopropyl 1-thio-β-D-galactopyranoside for 2–4 h. Cells were pelleted and lysed in 30 mL of 20 mM Tris-HCl (pH 8.0), 6 M Guanidine HCl by sonication. Extracts were centrifuged for 20 min at 10,000 × g, and dialyzed against 4 L of 20 mM Tris-HCl (pH 8.0), 150 mM NaCl, 2 mM 2 -mercaptoethanol for 16 hr. Precipitates were removed by centrifugation for 20 min at 10,000 × g. The supernatant was incubated with 35% ammonium sulfate by mixing for 20 minutes and precipitates were removed by centrifugation for 20 minutes at 10,000 × g. MeCP2 was precipitated from the supernatant with 70% ammonium sulfate, centrifuged for 20 minutes at 10,000 × g, and suspended in gel filtration buffer (20 mM Tris-HCl (pH 8.0), 300 mM NaCl, 1mM dithiothreitol). The protein solution was syringe filtered and loaded onto a HiLoad 26/600 Superdex 200 (GE Healthcare). MeCP2-containing fractions were buffer exchanged into 20 mM Tris-HCl (pH 8.0), 100 mM NaCl and loaded onto a MonoS 10/100 GL (GEHeathcare). Proteins were eluted with a linear gradient of 20 mM Tris-HCl (pH 8.0), 1 M NaCl and MeCP2-containing fractions were combined and stored at 4 °C.
Sample preparation
Nineteen base complementary oligonucleotides with a central- methylated cytosine (Integrated DNA Technologies) or hydroxymethylated cytosine (Midland Inc) were purchased and further purified over a MonoQ (GE Healthcare) ion exchange column after annealing. The DNA sequence was derived from the BDNF promoter known to be a native target sequence for MeCP2. Purified MeCP2 or MBD2 protein was combined with 10% excess double stranded oligonucleotide, buffer exchanged into 10 mM NaPO4, pH 6.5, 1 mM dithiothreitol, 10% 2H2O and concentrated to 0.2–1 mM.
NMR Spectroscopy
Spectra from standard experiments for resonance assignments, distance, and torsional angle restraints were collected at 25°C with Bruker Avance III NMR spectrometers equipped with a cryogenic probe and operated at a 1H frequency of 500, 700 or 850 MHz. The data were processed with the NMR-Pipe program [43] and analyzed with the CcpNMR Analysis program [44]. For both the free and DNA-bound MeCP2 proteins, backbone resonance was assigned based on 3D HNCO, HNCA, CBCA(CO)NH, and HNCACB spectra using standard techniques (32). Side-chain 1H and 13C resonances were assigned based on 3D HBHA(CO)NH, HCCH TOCSY, H(CCO)NH and C(CO)NH spectra (32). The resonance assignment data were deposited to Biological Magnetic Resonance Bank with the accession number 26978 for the DNA-bound protein.
For chemical shift perturbation (CSP) measurements, assigned peaks in the mCG-bound protein HSQC spectrum were transferred to mCH-bound HSQCs and confirmed by 15NOESY. CSPs and peak heights were calculated with the CcpNMR Analysis program and plotted with pro Fit 7.0.9 (Quansoft).
Relaxation dispersion
Relaxation dispersion spectra were collected at 25°C on instruments operating at 1H frequencies of 500, 700, and 850 MHz using a constant time CPMG delay of 60 ms [45,46]. A total of 13 pulse frequencies (VCPMG) ranging from 67 to 1800 Hz, with a repeat of two frequencies for error analysis, were collected in an interleaved fashion with heating compensation. Data was analyzed using the relax-nmr software [29,30] and fit with either the CR72 [32] or TSMFK01 [33] 2-site models. Model selection was based on the AIC technique [47] as implemented in relax-nmr [48].
Binding Affinity
Binding affinities were determined by isothermal calorimetry analysis on a MicroCal Auto iTC200 (Malvern). Proteins and DNA were purified as described above and buffer exchanged into 10mM potassium phosphate pH 6.0, 100mM KCl, and 1mM EDTA. At 37°C, 400 μL of DNA (10–30 μM) was titrated with 20 injections of 2 μL of protein (100–300 μM) with intervals of 120 s between successive injections. Binding isotherms were generated by plotting the corrected heats of binding against the ratio of the protein to DNA. Data plots were fit to a one-site binding model and used to calculate dissociation constants (Kd), enthalpies of binding (ΔH), stoichiometry (n), and entropy of binding (ΔS) with the manufacturer’s software Origin 7.0.
Circular Dichroism
Purified MeCP2 MBD and MBD2 MBD protein was buffer exchanged into 100 mM sodium phosphate pH 7.5 and concentrated to 0.1 mg/ml. Circular dichroism (CD) spectra were collected from 190 to 260 nm (0.2 nm interval, 24 nm/min, 0.1 cm path length, 25 °C) on a Chirascan Plus CD spectrometer (Applied Photophysics). CD spectra were normalized to provide mean residue molar ellipticity in degrees cm−2 dmol−1 residue−1.
Supplementary Material
Highlights.
MeCP2 binding of methylated CpA (mCA) is high-affinity, strand-specific, orientation-dependent and unique among the MBD-containing proteins
MeCP2 bound to methylated DNA displays dynamic motion at the protein-DNA interface that extends out the core α-helix
Hydroxymethylation of cytosine shifts the distribution of MeCP2 proteins from mCG to mCA loci
Acknowledgments
We thank Dorothy Erie and Justin Sperlazza for helpful discussions, Ashutosh Tripathy for assistance with isothermal calorimetry, and Gregory B. Young for spectrometer maintenance. This work was supported by National Institutes of Health (R01 GM098624) [D.C.W.].
Footnotes
Abbreviations: MBD, methyl-CpG binding domain; MeCP2, Methyl-CpG binding protein 2; MBD2, methyl-CpG binding domain protein 2; mC, 5-methylcytosine; hmC, 5-hydroxymethylcytosine; CSP, chemical shift perturbation; CPMG, Carr-Purcell-Meiboom-Gill; HSQC, heteronuclear single quantum coherence; ITC, isothermal titration calorimetry
Accession numbers NMR assignments have been deposited in the Biological Magnetic Resonance Data Bank (BMRB) with accession number 26978.
Publisher's Disclaimer: This is a PDF file of an unedited manuscript that has been accepted for publication. As a service to our customers we are providing this early version of the manuscript. The manuscript will undergo copyediting, typesetting, and review of the resulting proof before it is published in its final citable form. Please note that during the production process errors may be discovered which could affect the content, and all legal disclaimers that apply to the journal pertain.
References
- 1.Bienvenu T, Carrié A, de Roux N, Vinet MC, Jonveaux P, Couvert P, Villard L, Arzimanoglou A, Beldjord C, Fontes M, Tardieu M, Chelly J. MECP2 mutations account for most cases of typical forms of Rett syndrome. Hum Mol Genet. 2000;9:1377–84. doi: 10.1093/HMG/9.9.1377. [DOI] [PubMed] [Google Scholar]
- 2.Cheadle JP, Gill H, Fleming N, Maynard J, Kerr A, Leonard H, Krawczak M, Cooper DN, Lynch S, Thomas N, Hughes H, Hulten M, Ravine D, Sampson JR, Clarke A. Long-read sequence analysis of the MECP2 gene in Rett syndrome patients: correlation of disease severity with mutation type and location. Hum Mol Genet. 2000;9:1119–29. doi: 10.1093/HMG/9.7.1119. [DOI] [PubMed] [Google Scholar]
- 3.Huppke P, Laccone F, Krämer N, Engel W, Hanefeld F. Rett syndrome: analysis of MECP2 and clinical characterization of 31 patients. Hum Mol Genet. 2000;9:1369–75. doi: 10.1093/HMG/9.9.1369. [DOI] [PubMed] [Google Scholar]
- 4.Lister R, Mukamel EA, Nery JR, Urich M, Puddifoot CA, Nicholas D, Lucero J, Huang Y, Dwork AJ, Schultz MD, Yu M, Heyn H, Hu S, Wu JC, Rao A, Esteller M, He C. Global Epigenomic Reconfiguration During Mammalian Brain Development. Science. 2013;341:629–643. doi: 10.1126/science.1237905. [DOI] [PMC free article] [PubMed] [Google Scholar]
- 5.Chen L, Chen K, Lavery LA, Baker SA, Shaw CA, Li W, Zoghbi HY. MeCP2 binds to non-CG methylated DNA as neurons mature, influencing transcription and the timing of onset for Rett syndrome. Proc Natl Acad Sci. 2015;112:201505909. doi: 10.1073/pnas.1505909112. [DOI] [PMC free article] [PubMed] [Google Scholar]
- 6.Kinde B, Gabel HW, Gilbert CS, Griffith EC, Greenberg ME, Pfaff DW. Reading the unique DNA methylation landscape of the brain: Non-CpG methylation, hydroxymethylation, and MeCP2. Proc Natl Acad Sci U S A. 2015;112:6800–6. doi: 10.1073/pnas.1411269112. [DOI] [PMC free article] [PubMed] [Google Scholar]
- 7.Guo JU, Su Y, Shin JH, Shin J, Li H, Xie B, Zhong C, Hu S, Le T, Fan G, Zhu H, Chang Q, Gao Y, Ming GL, Song H. Distribution, recognition and regulation of non-CpG methylation in the adult mammalian brain. Nat Neurosci. 2014;17:215–222. doi: 10.1038/nn.3607. [DOI] [PMC free article] [PubMed] [Google Scholar]
- 8.Gabel HW, Kinde B, Stroud H, Gilbert CS, Harmin DA, Kastan NR, Hemberg M, Ebert DH, Greenberg ME. Disruption of DNA-methylation-dependent long gene repression in Rett syndrome. Nature. 2015;522:89–93. doi: 10.1038/nature14319. [DOI] [PMC free article] [PubMed] [Google Scholar]
- 9.Gigek CO, Chen ES, Smith MAC. Methyl-CpG-Binding Protein (MBD) Family: Epigenomic Read-Outs Functions and Roles in Tumorigenesis and Psychiatric Diseases. J Cell Biochem. 2016;117:29–38. doi: 10.1002/jcb.25281. [DOI] [PubMed] [Google Scholar]
- 10.Fraga MF, Ballestar E, Montoya G, Taysavang P, Wade PA, Esteller M. The affinity of different MBD proteins for a specific methylated locus depends on their intrinsic binding properties. Nucleic Acids Res. 2003;31:1765–74. doi: 10.1093/nar/gkg249. [DOI] [PMC free article] [PubMed] [Google Scholar]
- 11.Ohki I, Shimotake N, Fujita N, Jee JG, Ikegami T, Nakao M, Shirakawa M. Solution structure of the methyl-CpG binding domain of human MBD1 in complex with methylated DNA. Cell. 2001;105:487–497. doi: 10.1016/S0092-8674(01)00324-5. [DOI] [PubMed] [Google Scholar]
- 12.Ho KL, McNae IW, Schmiedeberg L, Klose RJ, Bird AP, Walkinshaw MD. MeCP2 Binding to DNA Depends upon Hydration at Methyl-CpG. Mol Cell. 2008;29:525–531. doi: 10.1016/j.molcel.2007.12.028. [DOI] [PubMed] [Google Scholar]
- 13.Scarsdale JN, Webb HD, Ginder GD, Williams DC. Solution structure and dynamic analysis of chicken MBD2 methyl binding domain bound to a target-methylated DNA sequence. Nucleic Acids Res. 2011;39:6741–52. doi: 10.1093/nar/gkr262. [DOI] [PMC free article] [PubMed] [Google Scholar]
- 14.Otani J, Arita K, Kato T, Kinoshita M, Kimura H, Suetake I, Tajima S, Ariyoshi M, Shirakawa M. Structural basis of the versatile DNA recognition ability of the methyl-CpG binding domain of methyl-CpG binding domain protein 4. J Biol Chem. 2013;288:6351–6362. doi: 10.1074/jbc.M112.431098. [DOI] [PMC free article] [PubMed] [Google Scholar]
- 15.Du Q, Luu PL, Stirzaker C, Clark SJ. Methyl-CpG-binding domain proteins: readers of the epigenome. Epigenomics. 2015;7:1051–73. doi: 10.2217/epi.15.39. [DOI] [PubMed] [Google Scholar]
- 16.Hashimoto H, Liu Y, Upadhyay AK, Chang Y, Howerton SB, Vertino PM, Zhang X, Cheng X. Recognition and potential mechanisms for replication and erasure of cytosine hydroxymethylation. Nucleic Acids Res. 2012;40:4841–9. doi: 10.1093/nar/gks155. [DOI] [PMC free article] [PubMed] [Google Scholar]
- 17.Mellén M, Ayata P, Dewell S, Kriaucionis S, Heintz N. MeCP2 binds to 5hmC enriched within active genes and accessible chromatin in the nervous system. Cell. 2012;151:1417–30. doi: 10.1016/j.cell.2012.11.022. [DOI] [PMC free article] [PubMed] [Google Scholar]
- 18.Heimer BW, Tam BE, Sikes HD. Characterization and directed evolution of a methyl-binding domain protein for high-sensitivity DNA methylation analysis. Protein Eng Des Sel. 2015;28:543–551. doi: 10.1093/protein/gzv046. [DOI] [PMC free article] [PubMed] [Google Scholar]
- 19.Esadze A, Chen C, Zandarashvili L, Roy S, Pettitt BM, Iwahara J. Changes in conformational dynamics of basic side chains upon protein-DNA association. Nucleic Acids Res. 2016;44:6961–70. doi: 10.1093/nar/gkw531. [DOI] [PMC free article] [PubMed] [Google Scholar]
- 20.Klose RJ, Sarraf SA, Schmiedeberg L, McDermott SM, Stancheva I, Bird AP. DNA binding selectivity of MeCP2 due to a requirement for A/T sequences adjacent to methyl-CpG. Mol Cell. 2005;19:667–678. doi: 10.1016/j.molcel.2005.07.021. [DOI] [PubMed] [Google Scholar]
- 21.Mezei PD, Csonka GI. Features of the interactions between the methyl-CpG motif and the arginine residues on the surface of MBD proteins. Struct Chem. 2016;27:1317–1326. doi: 10.1007/s11224-016-0783-0. [DOI] [Google Scholar]
- 22.Kudo S, Nomura Y, Segawa M, Fujita N, Nakao M, Schanen C, Tamura M. Heterogeneity in residual function of MeCP2 carrying missense mutations in the methyl CpG binding domain. J Med Genet. 2003;40:487–93. doi: 10.1136/jmg.40.7.487. [DOI] [PMC free article] [PubMed] [Google Scholar]
- 23.Free A, Wakefield RI, Smith BO, Dryden DT, Barlow PN, Bird AP. DNA recognition by the methyl-CpG binding domain of MeCP2. J Biol Chem. 2001;276:3353–60. doi: 10.1074/jbc.M007224200. [DOI] [PubMed] [Google Scholar]
- 24.Hendrich B, Bird A. Identification and characterization of a family of mammalian methyl-CpG binding proteins. Mol Cell Biol. 1998;18:6538–47. doi: 10.1128/MCB.18.11.6538. [DOI] [PMC free article] [PubMed] [Google Scholar]
- 25.Hendrich B, Tweedie S. The methyl-CpG binding domain and the evolving role of DNA methylation in animals. Trends Genet. 2003;19:269–277. doi: 10.1016/S0168-9525(03)00080-5. [DOI] [PubMed] [Google Scholar]
- 26.Cramer JM, Pohlmann D, Gomez F, Mark L, Kornegay B, Hall C, Siraliev-Perez E, Walavalkar NM, Sperlazza MJ, Bilinovich S, Prokop JW, Hill AL, Williams DC., Jr Methylation specific targeting of a chromatin remodeling complex from sponges to humans. Sci Rep. 2017;7:40674. doi: 10.1038/srep40674. [DOI] [PMC free article] [PubMed] [Google Scholar]
- 27.Cramer JM, Scarsdale JN, Walavalkar NM, Buchwald WA, Ginder GD, Williams DC. Probing the Dynamic Distribution of Bound States for Methylcytosine-binding Domains on DNA. J Biol Chem. 2014;289:1294–1302. doi: 10.1074/jbc.M113.512236. [DOI] [PMC free article] [PubMed] [Google Scholar]
- 28.Walavalkar NM, Cramer JM, Buchwald WA, Scarsdale JN, Williams DC., Jr Solution structure and intramolecular exchange of methyl-cytosine binding domain protein 4 (MBD4) on DNA suggests a mechanism to scan for mCpG/TpG mismatches. Nucleic Acids Res. 2015;42:11218–11232. doi: 10.1093/nar/gku782. [DOI] [PMC free article] [PubMed] [Google Scholar]
- 29.d’Auvergne EJ, Gooley PR. Optimisation of NMR dynamic models I. Minimisation algorithms and their performance within the model-free and Brownian rotational diffusion spaces. J Biomol NMR. 2008;40:107–119. doi: 10.1007/s10858-007-9214-2. [DOI] [PMC free article] [PubMed] [Google Scholar]
- 30.d’Auvergne EJ, Gooley PR. Optimisation of NMR dynamic models II. A new methodology for the dual optimisation of the model-free parameters and the Brownian rotational diffusion tensor. J Biomol NMR. 2008;40:121–133. doi: 10.1007/s10858-007-9213-3. [DOI] [PMC free article] [PubMed] [Google Scholar]
- 31.Morin S, Linnet TE, Lescanne M, Schanda P, Thompson GS, Tollinger M, Teilum K, Gagné S, Marion D, Griesinger C, Blackledge M, D’auvergne EJ. Relax: The analysis of biomolecular kinetics and thermodynamics using NMR relaxation dispersion data. Bioinformatics. 2014;30:2219–2220. doi: 10.1093/bioinformatics/btu166. [DOI] [PMC free article] [PubMed] [Google Scholar]
- 32.Carver JP, Richards RE. A general two-site solution for the chemical exchange produced dependence of T2 upon the carr-Purcell pulse separation. J Magn Reson. 1972;6:89–105. doi: 10.1016/0022-2364(72)90090-X. [DOI] [Google Scholar]
- 33.Tollinger M, Skrynnikov NR, Mulder FAA, Forman-Kay JD, Kay LE. Slow dynamics in folded and unfolded states of an SH3 domain. J Am Chem Soc. 2001;123:11341–11352. doi: 10.1021/ja011300z. [DOI] [PubMed] [Google Scholar]
- 34.Lagger S, Connelly JC, Schweikert G, Webb S, Selfridge J, Ramsahoye BH, Yu M, DeSousa D, Seiser C, He C, Sanguinetti G, Sowers LC, Walkinshaw MD, Bird AP. Domains of methylated CAC and CG target MeCP2 to tune transcription in the brain. 2016 bioRxiv. https://doi.org/10.1101/087577.
- 35.Spolar RS, Record MT. Coupling of local folding to site-specific binding of proteins to DNA. Science. 1994;263:777–84. doi: 10.1126/science.8303294. [DOI] [PubMed] [Google Scholar]
- 36.Ferrari ME, Lohman TM. Apparent Heat Capacity Change Accompanying a Nonspecific Protein-DNA Interaction. Escherichia coli SSB Tetramer Binding to Oligodeoxyadenylates. Biochemistry. 1994;33:12896–12910. doi: 10.1021/bi00209a022. [DOI] [PubMed] [Google Scholar]
- 37.Chia JY, Tan WS, Ng CL, Hu NJ, Foo HL, Ho KL. A/T Run Geometry of B-form DNA Is Independent of Bound Methyl-CpG Binding Domain, Cytosine Methylation and Flanking Sequence. Sci Rep. 2016;6:31210. doi: 10.1038/srep31210. [DOI] [PMC free article] [PubMed] [Google Scholar]
- 38.Guy J, Hendrich B, Holmes M, Martin JE, Bird A. A mouse Mecp2-null mutation causes neurological symptoms that mimic Rett syndrome. Nat Genet. 2001;27:322–6. doi: 10.1038/85899. [DOI] [PubMed] [Google Scholar]
- 39.Chen RZ, Akbarian S, Tudor M, Jaenisch R. Deficiency of methyl-CpG binding protein-2 in CNS neurons results in a Rett-like phenotype in mice. Nat Genet. 2001;27:327–331. doi: 10.1038/85906. [DOI] [PubMed] [Google Scholar]
- 40.Collins AL, Levenson JM, Vilaythong AP, Richman R, Armstrong DL, Noebels JL, David Sweatt J, Zoghbi HY. Mild overexpression of MeCP2 causes a progressive neurological disorder in mice. Hum Mol Genet. 2004;13:2679–89. doi: 10.1093/hmg/ddh282. [DOI] [PubMed] [Google Scholar]
- 41.Brown K, Selfridge J, Lagger S, Connelly J, De Sousa D, Kerr A, Webb S, Guy J, Merusi C, Koerner MV, Bird A. The molecular basis of variable phenotypic severity among common missense mutations causing Rett syndrome. Hum Mol Genet. 2016;25:558–570. doi: 10.1093/hmg/ddv496. [DOI] [PMC free article] [PubMed] [Google Scholar]
- 42.Szulwach KE, Li X, Li Y, Song CX, Wu H, Dai Q, Irier H, Upadhyay AK, Gearing M, Levey AI, Vasanthakumar A, Godley LA, Chang Q, Cheng X, He C, Jin P, Manuscript A. 5-hmC-mediated epigenetic dynamics during postnatal neurodevelopment and aging. Nat Neurosci. 2011;14:1607–1616. doi: 10.1038/nn.2959. http://dx.doi.org/10.1038/nn.2959. [DOI] [PMC free article] [PubMed] [Google Scholar]
- 43.Delaglio F, Grzesiek S, Vuister GW, Zhu G, Pfeifer J, Bax A. NMRPipe: a multidimensional spectral processing system based on UNIX pipes. J Biomol NMR. 1995;6:277–93. doi: 10.1007/BF00197809. [DOI] [PubMed] [Google Scholar]
- 44.Vranken WF, Boucher W, Stevens TJ, Fogh RH, Pajon A, Llinas M, Ulrich EL, Markley JL, Ionides J, Laue ED. The CCPN data model for NMR spectroscopy: Development of a software pipeline. Proteins Struct Funct Genet. 2005;59:687–696. doi: 10.1002/prot.20449. [DOI] [PubMed] [Google Scholar]
- 45.Loria JP, Rance M, Palmer AG. A Relaxation-Compensated Carr - Purcell - Meiboom - Gill Sequence for Characterizing Chemical Exchange by NMR Spectroscopy. J Am Chem Soc. 1999;121:2331–2332. doi: 10.1021/ja983961a. [DOI] [Google Scholar]
- 46.Long D, Liu M, Yang D. Accurately probing slow motions on millisecond timescales with a robust NMR relaxation experiment. J Am Chem Soc. 2008;130:2432–2433. doi: 10.1021/ja710477h. [DOI] [PubMed] [Google Scholar]
- 47.Akaike H. Int Symp Inf Theory. Springer; New York: 1973. Information theory and an extension of the maximum likelihood principle; pp. 267–81. [DOI] [Google Scholar]
- 48.d’Auvergne EJ, Gooley PR. The use of model selection in the model-free analysis of protein dynamics. J Biomol NMR. 2003;25:25–39. doi: 10.1023/A:1021902006114. [DOI] [PubMed] [Google Scholar]
Associated Data
This section collects any data citations, data availability statements, or supplementary materials included in this article.