Abstract
The effect of serum protein adsorption on the biological fate of Spherical Nucleic Acids (SNAs) is investigated. Through a proteomic analysis, it is shown that G-quadruplexes templated on the surface of a gold nanoparticle in the form of SNAs mediate the formation of a protein corona that is rich in complement proteins relative to SNAs composed of poly-thymine (poly-T) DNA. Cellular uptake studies show that complement receptors on macrophage cells recognize the SNA protein corona, facilitating their internalization, and causing G-rich SNAs to accumulate in the liver and spleen more than poly-T SNAs in vivo. These results support the conclusion that nucleic acid sequence and architecture can mediate nanoparticle—biomolecule interactions and alter their cellular uptake and biodistribution properties and illustrate that nucleic acid sequence is an important parameter in the design of SNA therapeutics.
1. Introduction
Spherical Nucleic Acids (SNAs) are a unique class of nanoparticles (NPs) that are comprised of a dense and highly oriented nucleic acid shell.[1] This architecture imparts several novel properties to SNAs that are fundamentally different from those of their linear counterparts. For example, unlike linear nucleic acids, SNAs readily enter most cell types without the use of additional transfection reagents.[2] This process is often facilitated by the recognition of the 3D architecture of SNAs by class A scavenger receptors, which have high affinities for SNAs but not the particle-free sequences.[2] These structure-dependent properties make the SNA a promising single-entity agent for probing and regulating nucleic acid-dependent cellular processes.[1b,3]
Though elucidating the mechanism of cellular uptake of SNAs has been an active area of research,[2] little is known about the effect of serum protein adsorption on this process. It is conceivable that the formation of a SNA protein corona could impact cellular uptake by altering the surface chemistry that is presented to cells and tissues. In particular, the adsorption of proteins could enable SNAs to be internalized by macrophage cells and cause them to accumulate in the liver and spleen following intravenous administration.[4] While previous work has shown that the identity and types of proteins that comprise the SNA protein corona can impact their uptake by macrophage cells,[5] no data have been collected to probe how macrophage cells internalize protein-coated SNAs or the effects of this process on the biodistribution of SNAs in mice.
Herein, we utilize two SNAs, one composed of guanine-rich (G-rich) oligonucleotides that form G-quadruplexes and one composed of poly-thymine (poly-T) oligonucleotides (Scheme 1), to study the effect of nucleic acid sequence on the formation of a NP protein corona and the subsequent effects on their uptake by macrophage cells. We find that nucleic acid sequence can dictate the chemical composition of the SNA protein corona and alter their recognition by macrophage cells and their accumulation in macrophage-rich tissues in vivo. Our results show that SNA surface ligand architecture, and the formation of G-quadruplexes in particular, can alter the biological fate of SNAs. While the biological fate of NPs is known to be dependent upon both size and surface charge, it is increasingly apparent that the chemical composition and architecture of surface ligands also plays a significant role in facilitating the interactions of nanomaterials with biological entities, including serum and cell surface proteins.
Scheme 1.
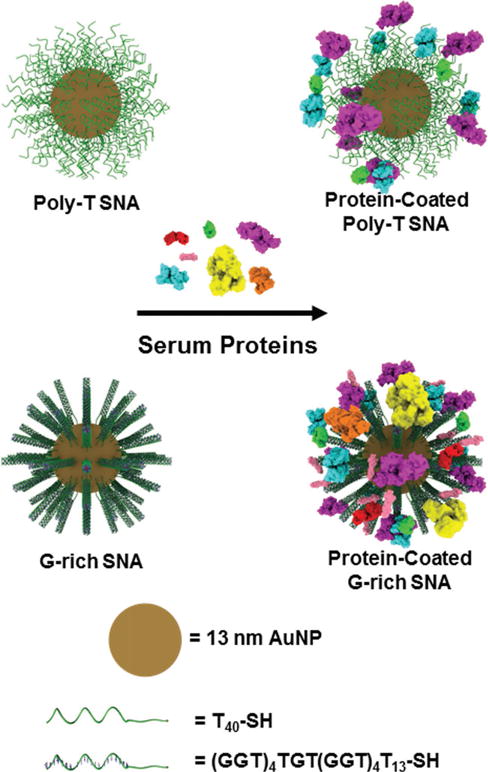
G-rich SNAs adsorb more types of proteins and more total protein from serum than poly-T SNAs.
2. Results and Discussion
Previous work has shown that SNAs composed of G-rich oligonucleotide sequences facilitate interactions with both cell-surface scavenger receptors[6] and a variety of serum proteins[5] due to the enhanced formation of G-quadruplexes, which is mediated by the dense layer of oligonucleotides that brings preoriented DNA strands in close proximity to one another on the SNA surface. Based upon the enhanced interaction of G-quadruplex-forming, G-rich SNAs with serum proteins, we hypothesized that the protein corona formed on G-rich SNAs would facilitate their uptake into phagocytic macrophage cells, and that this would lead to subsequent accumulation in the macrophage-rich liver and spleen in vivo. To probe the effect of secondary oligonucleotide structure on SNA protein corona formation and subsequent biodistribution in vivo, we designed two oligonucleotide sequences and synthesized G-rich SNAs and poly-T SNAs with a gold NP (AuNP) core. We studied the amounts and types of human serum proteins that bind to G-rich and poly-T SNAs, and their effect on SNA uptake into phagocytic cells and subsequent sequestration by the liver and spleen in mice.
2.1. Characterization of the SNA Protein Corona
To study the effect of G-quadruplex formation on the SNA protein corona, we incubated G-rich SNAs and poly-T SNAs in 10% human serum (HS) for 15–90 min and studied the quantity and identity of serum proteins that adsorb to SNAs. Protein-coated SNAs were isolated from unbound serum proteins by centrifugation and analyzed by dynamic light scattering (DLS) to determine the relative increase in the hydrodynamic diameter of the SNAs upon protein corona formation (Figure 1A). The hydrodynamic diameter of protein-coated G-rich SNAs increased from 49.2 ± 0.6 nm prior to incubation with HS to 195.2 ± 9.9 nm in a linear fashion over the 90 min incubation period. Meanwhile, the hydrodynamic diameter of poly-T SNAs increased from 52.4 ± 2.3 nm prior to incubation with HS to 128.2 ± 7.4 nm after 90 min. Importantly, the hydrodynamic diameter of G-rich SNAs is consistently higher than that of poly-T SNAs throughout the 90 min incubations with HS, most likely due to the increase in protein-SNA interactions that is caused by the enhanced formation of G-quadruplexes on the SNA surface.[5] In addition, the increase in SNA size is likely due to two factors: (1) the adsorption of protein to the nanoparticle surface, and (2) nanoparticle clustering facilitated by protein–protein interactions.
Figure 1.
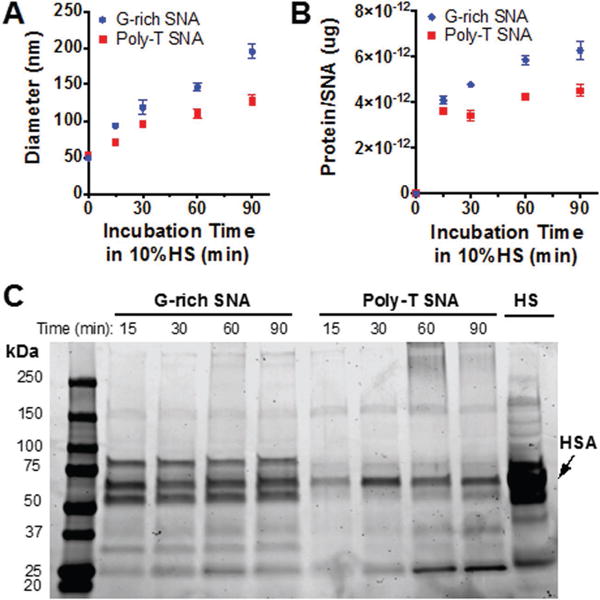
Characterization of protein-coated SNAs and quantification of protein bound to SNAs. A) The hydrodynamic diameter of G-rich and poly-T SNAs incubated in HS from 15 to 90 min increases. B) Quantitative analysis of the amount of protein bound to G-rich and poly-T SNAs after incubation in HS. C) SDS-PAGE gel of proteins isolated from G-rich and poly-T SNAs after incubation in HS from 15 to 90 min indicates that more proteins, both in number and type, bind to G-rich SNAs than to poly-T SNAs. Note that the heavy band in HS corresponds to human serum albumin (HSA).
To quantify the amount of protein bound to G-rich and poly-T SNAs, we performed a bicinchoninic acid (BCA) assay (Figure 1B). Protein-coated SNAs were incubated with Tween-20 and heated to isolate the tightly bound proteins. The amount of protein bound to G-rich SNAs increased from 4.09 × 10⁻¹² ±1.8 × 10⁻¹³ μg per SNA following a 15 min incubation in HS to 6.27 × 10⁻¹² ± 3.9 × 10⁻¹³ μg per SNA following a 90 min incubation in HS. In contrast, the amount of protein isolated from poly-T SNAs increased from 3.60 × 10⁻¹² ± 6.9 × 10⁻¹³ μg per SNA following a 15 min incubation in HS to 4.50 × 10⁻¹² ± 2.5 × 10⁻¹³ μg per SNA following a 90 min incubation in HS. These results indicate that G-rich SNAs bind more total protein than poly-T SNAs, and that the amount of protein bound to both G-rich and poly-T SNAs increases over time, which is consistent with the increase in hydrodynamic diameter observed by DLS.
In addition to quantifying the amount of protein bound to the nanoparticle, the identity of the specific proteins that adsorb to G-rich and poly-T SNAs with increasing incubation time in HS was determined. To study corona composition, we isolated proteins from SNAs incubated in 10% HS for 15–90 min and then separated them by sodium dodecyl sulfate-polyacrylamide gel electrophoresis (SDS-PAGE, Figure 1C). The gel indicates that at each time point, more types and amount of protein are bound to G-rich SNAs than poly-T SNAs.
To identify the specific proteins that bind to G-rich and poly-T SNAs over time, mass spectrometry of the trypsin-digested isolated proteins was performed (Tables S3–S10, Supporting Information). The number of distinct proteins identified by mass spectrometry (Figures 2A and S1) increases for G-rich SNAs from 59 to 86 following 15–90 min incubations in HS. For poly-T SNAs, 62 distinct proteins were isolated after a 15 min incubation in HS. After 30–90 min incubations in HS, this levels off to around 50 distinct proteins. This suggests that the protein corona composition for SNAs changes over time, which correlates well with observations that the specific types of proteins that form a nanoparticle protein corona changes over time, a phenomenon known as the Vroman effect.[7] In addition, a comparison of the distinct proteins isolated from G-rich and poly-T SNAs indicates that about 45 proteins bind to both types of SNAs, regardless of incubation time in HS (Figure 2B). Importantly, the number of proteins that bind exclusively to G-rich SNAs increases over time, while those that bind to poly-T SNAs decreases initially before leveling off. These results further enforce the dynamic interaction of serum proteins with SNAs over time and demonstrate the sequence-specific nature of this process.
Figure 2.
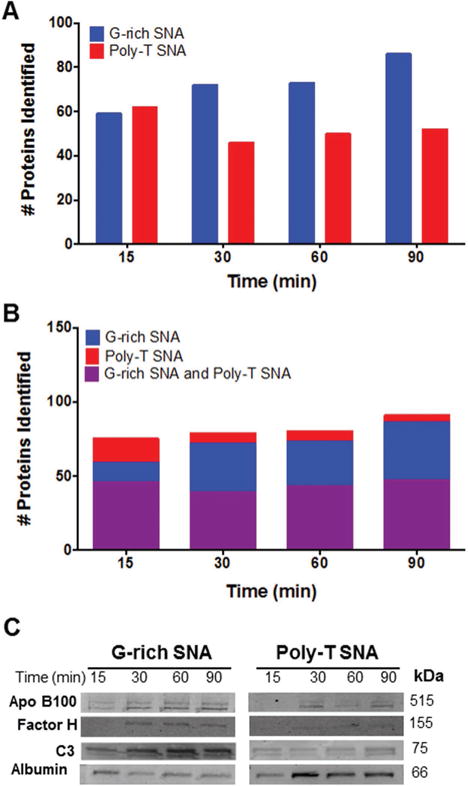
Analysis and identification of proteins isolated from SNAs postincubation in HS. A) The number of distinct proteins isolated from G-rich SNAs increases with longer incubations in HS. B) A comparison of the proteins that bind G-rich and poly-T SNAs indicates that there are about 45 proteins that bind to both particle types, while only the number of proteins bound uniquely to G-rich SNAs increases with longer incubations in HS. C) Western blot analysis of the relative amounts of apolipoprotein B100, complement factor H, complement C3, and human serum albumin isolated from G-rich and poly-T SNAs after incubation in HS from 15 to 90 min.
Western blotting of proteins isolated from G-rich and poly-T SNAs (3 pmol) was used to quantify the relative abundance of proteins bound to G-rich and poly-T SNAs over time: apolipoprotein B100 (Apo B100), complement factor H, complement C3b, and serum albumin (Figure 2C). The relative amount of human serum albumin (HSA), the highest abundant serum protein studied, decreased for G-rich SNAs over time. For poly-T SNAs, HSA initially increases from 15 to 30 min of incubation in HS before decreasing in relative abundance. The band intensities for Apo B100, Factor H, and C3b are low after a 15 min incubation, but increases and plateaus for both G-rich and poly-T SNAs over time. In addition, an exchange of higher abundance proteins (HSA) for lower abundance proteins (Apo B100, complement factor H, and complement C3b) is observed, indicating that the composition of the SNA protein corona changes over time, which is consistent with the Vroman effect.[7] These results corroborate the DLS and BCA assay experiments, suggesting that G-rich SNAs bind more types and amount of protein following incubation in HS than their poly-T SNA counterparts. In particular, more complement C3b adsorbs onto G-rich than poly-T SNAs, which is a protein that is recognized by complement receptors on the macrophage cell surface, and can lead to NP phagocytosis.[8]
2.2. The Impact of Protein Corona Composition on the Uptake of SNAs by Macrophage Cells
Based on the observed differences in SNA protein corona composition over time, we hypothesized that G-rich SNAs would be recognized by macrophages, resulting in higher uptake compared to poly-T SNAs. To test this hypothesis, phorbol 12-myristate 13-acetate (PMA) induced human macrophages differentiated from THP-1 monocytes were treated with G-rich and poly-T SNAs with and without 10% HS for 15–90 min. Cell uptake and association were then quantified by inductively coupled plasma mass spectrometry (ICP-MS, Figure 3 A). The results reveal that G-rich SNAs in 10% HS exhibit higher cellular uptake and association than G-rich SNAs without HS and poly-T SNAs with or without HS. At initial times, uptake and association of G-rich SNAs in 10% HS is about three times higher than uptake and association of G-rich SNAs without HS and poly-T SNAs with or without HS. Over time, uptake and association of G-rich SNAs in HS increases substantially, resulting in a fourfold higher number of AuNPs/cell. Though a protein corona is formed on both poly-T and G-rich SNAs, no significant increase in the uptake of poly-T SNAs by macrophages is observed in the presence of serum proteins. This suggests that beyond the presence of adsorbed protein, the identity and types of proteins that comprise the SNA protein corona impact their recognition by macrophage cells. One possible explanation for this increase in the uptake of G-rich SNAs transfected in HS is the presence of opsonin proteins, which may bind to G-rich SNAs and flag them for phagocytosis.
Figure 3.
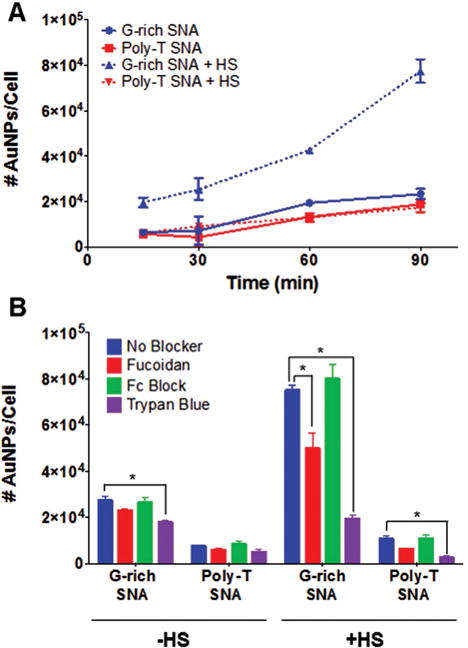
Effects of SNA human serum protein corona formation on macrophage uptake. A) The uptake and association of G-rich and poly-T SNAs in the presence and absence of HS following 15–90 min incubations with THP-1 cells was quantified by ICP-MS. G-rich SNAs exhibit significantly higher uptake in the presence of HS compared to poly-T SNAs with or without HS present. B) The uptake of SNAs into THP-1 macrophages following treatment with chemical blockers to inhibit binding to cell surface receptors was quantified. Fucoidan was used to block class A scavenger receptors, Fc block was used to block Fc receptors, and trypan blue was used to block complement receptors. The results indicate that the macrophage uptake and association of SNAs in the presence of HS was significantly inhibited by trypan blue and suggests that complement receptor-mediated phagocytosis plays a large role in the uptake of protein-coated SNAs into THP-1 macrophage cells. *P < 0.05.
Two main classes of cell surface receptors that bind opsonin proteins are complement receptors and Fc receptors, which recognize complement proteins and IgG proteins, respectively.[9] These classes of proteins have been identified to bind to SNAs by proteomic mass spectrometry analysis, and it was hypothesized that their presence in the SNA protein corona may be responsible for recognition and uptake by macrophages (Tables S3–S10, Supporting Information). To probe the role of these receptors in facilitating SNA uptake by macrophages, chemical blockers were used to inhibit recognition of differentiated THP-1 cells by class A scavenger receptors (fucoidan),[10] complement receptors (trypan blue),[11] and Fc receptors (Fc block). Cells pretreated with blocker were treated with G-rich and poly-T SNAs with and without HS for 90 min, and cell uptake and association was quantified by ICP-MS (Figure 3B). Although class A scavenger receptors have been shown to facilitate uptake of SNAs in serum-free conditions,[2b] the uptake of G-rich and poly-T SNAs was not substantially decreased by blocking class A scavenger receptors, suggesting that cellular uptake of SNAs by macrophages in the presence of serum may occur primarily by an alternate mechanism.
Blocking Fc receptors on THP-1 macrophages did not result in a significant change in uptake and association of G-rich and poly-T SNAs transfected with or without HS. In contrast, blocking complement receptors resulted in about a fourfold decrease in the uptake of G-rich SNAs in the presence of HS. This appears to inhibit the increase in uptake that is observed in the presence of HS, resulting in uptake that is comparable to G-rich SNAs in the absence of HS. This suggests that complement receptors recognize complement proteins on the SNA protein corona, such as complement C3, and facilitate phagocytosis. This result supports the observed increase in macrophage uptake of G-rich SNAs in the presence of HS compared to poly-T SNAs in the absence of HS, since G-rich SNAs adsorb more complement C3b than poly-T SNAs (Figure 2C).
In order to probe the relative abundance of complement receptors, Fc receptors, and class A scavenger receptors on THP-1 macrophages compared to HaCaT cells, which primarily uptake SNAs via class A scavenger receptor-mediated endocytosis,[2b] we treated cells with fluorophore-tagged antibodies targeting these three classes of receptors and analyzed them using flow cytometry (Figure 4). Our results indicate that differentiated THP-1 macrophages express ≈11 times more complement receptors and ≈26 times more Fc receptors than HaCaT cells and that HaCaT cells express about approximately two times more scavenger receptors than THP-1 macrophages. Taken together, these results suggest that the difference in cell surface receptor expression in macrophage cells, in addition to the formation of the SNA protein corona, may account for the difference in uptake mechanism observed in THP-1 macrophage cells compared to HaCaT cells.
Figure 4.
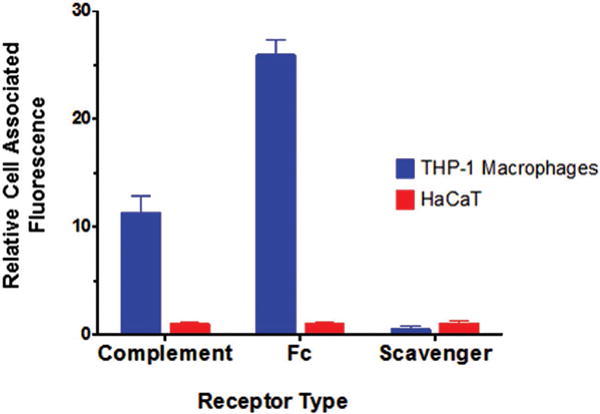
Comparison of cell surface receptor expression between THP-1 macrophages and HaCaT cells. Relative cell-associated fluorescence of THP-1 macrophages and HaCaT cells treated with fluorophore-labeled antibodies targeting complement receptors, Fc receptors, and class A scavenger receptors.
2.3. The Effect of SNA Sequence on Accumulation in the Liver and Spleen
Based upon the difference in uptake of G-rich and poly-T SNAs by macrophages in cell culture, we hypothesized that in vivo, G-rich SNAs would be sequestered by macrophage-rich tissues, such as the liver and spleen, to a greater extent than poly-T SNAs. To probe this hypothesis, C57BL/6 mice were injected with either G-rich SNAs or poly-T SNAs via the tail vein. Mice were sacrificed, perfused, and the organs were collected for analysis of AuNP content via ICP-MS 8–672 h following injection (Figure 5). More than 80% of the injected dose of G-rich SNAs is found in the liver, compared to nearly 50% of the injected dose of poly-T SNAs, 8 h postinjection. Over time, SNAs are cleared from the liver, and at 672 h postinjection, the difference in the percentage of the injected dose of G-rich versus poly-T SNAs in the liver is statistically insignificant. Similar trends are observed for the accumulation of SNAs in the spleen, though the percent of the injected dose is less than 10%, due to the relatively smaller size of the spleen compared to the liver. These results confirm our hypothesis that secondary oligonucleotide structure formation on SNAs, which influences the NP protein corona, can significantly alter the biodistribution profile of SNAs in vivo.
Figure 5.
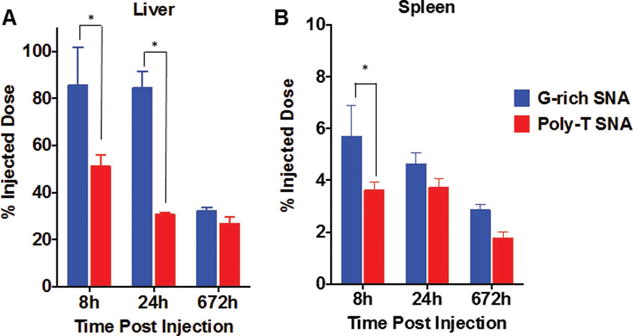
Quantification of SNA accumulation in the A) liver and B) spleen of mice injected with either G-rich or poly-T SNAs 8, 24, and 672 h postinjection. *P < 0.05.
3. Conclusions
We have shown that the presence of G-quadruplexes on the SNA surface increases protein binding over time, where more proteins, both in number and in type, bind to G-rich SNAs than poly-T SNAs. This difference in the protein corona alters the interaction of G-rich and poly-T SNAs with macrophage cells in vitro, where G-rich SNAs exhibit higher uptake via complement receptors. Indeed, in vivo experiments show that G-rich SNAs accumulate in macrophage-rich tissues, a consequence of the recognition of certain proteins on the corona by cell surface receptors. This work highlights the importance of nucleic acid sequence in designing therapeutic SNAs, since the formation of nucleic acid secondary structures can result in markedly different biodistribution profiles. In addition, some of the observations herein likely apply to other nucleic acid-modified nanostructures, and should be taken into consideration for therapeutic design.
4. Experimental Section
Synthesis of SNAs
Citrate capped, 13 nm gold nanoparticles were synthesized using the Frens method. DNA was synthesized using a MM38 oligonucleotide synthesizer (BioAutomation) using standard solid-phase phosphoramidite coupling chemistry. SNAs were synthesized by functionalizing AuNPs with 3 × 10⁻⁹ mole thiolated DNA per mL of AuNPs (at 7.5 × 10⁻⁹ M). SNAs were stabilized with 0.2% Tween-20 and salted slowly over time (0.5 and 1 M final NaCl concentrations for G-rich and poly-T SNAs, respectively). To ensure the SNAs were consistent in DNA loading, 1 × 10⁻⁹ M of each SNA was dissolved using 40 × 10−3 M KCN, and the number of DNA strands per particle was determined using the OliGreen Assay (Life Technologies, Table S1, Supporting Information).
Incubation of SNAs in Human Serum and Isolation of Serum Proteins
SNAs (5 × 10⁻⁹ M) were incubated in 10% type AB male HS (Sigma) for 15–90 min at 37 °C with shaking. Unbound protein was removed by centrifugation (3X, for 30 min at 13 000 rpm). The concentration of purified SNAs with proteins bound was determined, and adjusted to 120 × 10−9 M by dilution with phosphate buffered saline (PBS). Tween-20 was added to the protein-coated SNAs at a final concentration of 1%, and heated for 5 min at 95 °C to release the specifically bound proteins. The mixture was then centrifuged for 30 min at 13 000 rpm, and the supernatant was collected to analyze the specifically bound proteins. SNAs were collected from the pellet and further analyzed.
DLS Measurements
DLS measurements were taken using a Malvern Zetasizer NanoZS using the refractive index of gold. Samples were prepared in PBS at a concentration of 1 × 10⁻⁹ M SNA and measurements were taken at 25 °C. For diameter, the average and standard deviation of five measurements are reported and for zeta-potential, the average of three measurements is reported.
Protein Quantification
The BCA assay was used to quantify protein bound to SNAs following incubation in human serum. Protein samples were isolated from 1 pmol SNA following the procedure described previously, and were analyzed using the BCA Protein Assay Kit (Pierce), and using bovine serum albumin to generate a standard curve from 0 to 250 μg protein.
SDS-PAGE
Proteins harvested from 3 pmol SNA were analyzed by SDS-PAGE using precast Mini ProTEAN TGX 4%–15% polyacrylamide gels (BioRad). To compare the amount of protein from each type of SNA, the protein samples loaded were isolated from the same volume and concentration of SNAs. Spectra MultiColor Broad Range Protein Ladder was used as a molecular weight marker (Pierce) and the gels were run for 1 h at 100 V in Tris-Glycine-SDS buffer. Gels were then stained using IR Blue Protein stain and imaged on an Odyssey imager at 700 nm (LI-COR Biosciences).
Proteomic Mass Spectrometry Protein Identification
Protein samples isolated as previously described were prepared for mass spectrometry analysis by using acetone precipitation to remove SDS, denatured in 8 M urea, reduced using dithiothreitol (DTT), and alkylated using iodoacetamide. The proteins were then digested with sequencing grade trypsin in 1 M urea at 37 °C overnight. The samples were desalted before they were loaded into a 10 cm long, 75 × 10−6 M reverse phase capillary column (ProteoPep II C18, 300Å, 5 μm size, New Objective) and separated using a 100 min gradient from 5% to 100% acetonitrile on a Proxeon Easy n-LC II (Thermo Scientific). Next, the peptides were eluted into an LTQ Orbitrap Velos mass spectrometer (Thermo Scientific) with electrospray ionization at 350 nL min−1 flow rate. The mass spectrometer was run in a data-dependent mode, where 10 of the most intense ions from each MS1 precursor ion scan were selected from fragmentation by collision-induced dissociation. The parameters for mass spectrometry were as follows: the resolution of MS1 was set at 60 000, normalized collision energy was set to 35%, activation time was 10 ms, isolate width was 1.5, and the +1 and +4 and higher charge states were rejected.
The results were processed using Proteome Discoverer (Thermo Scientific) and searched using an in-house MASCOT server. The results were also searched against the Swiss-Prot database, with the following database search filters: Homo sapiens, trypsin for enzyme specificity, cysteine carbamidomethylation for fixed modification, methionine oxidation, and N-terminal acetylation for variable modification, precursor mass tolerance of ±10 ppm, and a fragment ion mass tolerance of ±0.8 Da. All spectra were searched against target/decoy databases, and the mascot significance threshold was chosen to achieve a targeted false discovery rate of 1%. The peptide identification was considered valid if its corresponding mascot score was equal or less than the threshold. Protein grouping was enabled in Proteome Discoverer, and were grouped to satisfy the rule of parsimony. Finally, proteins with less than three unique peptides were not considered to eliminate false discovery.
Western Blotting
Proteins isolated from 3 pmol of SNAs were run on a 4%–15% Mini-PROTEIN TGX gel (Bio-Rad), transferred onto a nitrocellulose membrane (Thermo Scientific) using a Trans-Blot SD semi-dry transfer cell (Bio-Rad). Odyssey blocking buffer (LI-COR) was used to block the membranes, and the following proteins were probed with an antibody: apolipoprotein B100 using a primary goat antibody (1:1000, Abcam ab98132), factor H using a primary goat antibody (1:2000, Abcam ab36134), complement C3 using a primary rabbit antibody (1:500, Abcam ab97462), and serum albumin using a primary goat antibody (1:1000, Abcam ab19194). The bands were labeled with the following secondary antibodies: anti-goat (1:10 000) IgG IRDye 800 (LI-COR) and anti-rabbit (1:10 000) IgG IRDye 680 (LI-COR), and the protein bands were visualized using the Odyssey CLx Infrared Imaging System (LI-COR).
THP-1 and HaCaT Cell Culture
Cells were cultured in a 5% CO2 incubator following ATCC’s recommended instructions. THP-1 cells were cultured in RPMI containing 10% fetal bovine serum (FBS) and 1% penicillin/streptomycin supplemented with 0.05 × 10⁻³ M 2-mercaptoethanol. HaCaT cells were cultured in DMEM containing 10% FBS and 1% penicillin/streptomycin and subcultured using trypsin.
Cellular Uptake, Receptor Blocking Studies, and ICP-MS Analysis
One million THP-1 cells per well were seeded in a 12-well plate, and were differentiated using 100 × 10−9 M PMA in RPMI containing 20% FBS for 72 h. To quantify cellular uptake, differentiated THP-1 cells were treated with 1 × 10⁻⁹ M SNA in OptiMEM with and without 10% HS for 15, 30, 60, and 90 min. For receptor blocking studies, 50 μg mL−1 fucoidan (Sigma-Aldrich) or 5 μg mL−1 Fc block (BD Biosciences) in OptiMEM was incubated with cells for 30 min prior to transfection with SNAs, and 1 × 10⁻³ M trypan blue (Life Technologies) was incubated with cells for 60 min. Before SNAs were added to the cells, the wells were washed twice with OptiMEM to remove blockers. THP-1 cells were then treated with SNAs in OptiMEM with or without 10% HS for 90 min.
Following transfection, cells from both experiments were washed with OptiMEM three times before they were counted (Countess Cell Counter, Invitrogen) and digested using 3% HCl in 97% HNO3 at 55 °C for 1 h. Acid-treated samples were resuspended in 2% HCl and 2% HNO3 in water and analyzed using an X Series II ICP-MS (ThermoFisher). The data presented represent the average and standard deviation from N = 3 for each sample group.
Cell Surface Receptor Expression Analysis
THP-1 monocytes were differentiated using 100 × 10−9 M PMA in RPMI containing 20% FBS for 48 h. 300 000 THP-1 monocytes, THP-1 differentiated macrophages, and HaCaT cells were stained with FcγRII antibody (CD32, BD Biosciences 550586, diluted to 1:50), class A scavenger receptor antibody (SR-AI, R&D Systems FAB2708, diluted 1:100), and complement receptor 3 antibody (CD11b, BD Biosciences 564518, diluted 1:200) for 30 min at 4 °C. Samples were then analyzed on an LSRII flow cytometer. The mean fluorescence intensity of each sample was plotted following dead cell and doublet exclusion. The values reported represent the mean and standard deviation of triplicate experiments with values normalized to the fluorescence associated with HaCaT cells for each receptor type studied.
In Vivo SNA Biodistribution and Pharmacokinetics
All experiments were conducted under an approved protocol of the Institutional Animal Care and Use Committee of Northwestern University. 6–8 week old male CD57BL/6 mice were injected with 200 μ L of 100 × 10−9 M G-rich SNA, poly-T SNA, or 1X PBS as a control intravenously via the tail vein. Blood samples were collected 1, 5, 10, 15, 30, 45, 60, 120, 240, 480, 720, 960, 1440, and 2880 min following injection via retro-orbital draw. Blood samples were weighed, dried, and digested with acid for quantification of gold content using ICP-MS. To determine SNA accumulation in the liver and spleen, mice were sacrificed and perfused 8 h, 24 h, and 28 d postinjection, and tissues were collected for analysis by ICP-MS. Detailed procedures for the preparation of samples for ICP-MS can be found in the Supporting Information. The data presented represent the average and standard deviation from N = 4 for each experimental group (G-rich or poly-T SNAs).
Supplementary Material
Acknowledgments
Research reported in this publication was supported by the National Cancer Institute of the National Institutes of Health under Award Numbers U54CA151880 and U54CA199091. The content is solely the responsibility of the authors and does not necessarily represent the official views of the National Institutes of Health. This material is based on research sponsored by Air Force Research Laboratory under agreement number FA8650-15-2-5518. The U.S. Government is authorized to reproduce and distribute reprints for Governmental purposes notwithstanding any copyright notation thereon. The views and conclusions contained herein are those of the authors and should not be interpreted as necessarily representing the official policies or endorsements, either expressed or implied, of Air Force Research Laboratory or the U.S. Government. A.B.C. and C.M.G. both acknowledge a National Defense Science and Engineering Graduate Fellowship.
Footnotes
Supporting Information
Supporting Information is available from the Wiley Online Library or from the author.
Contributor Information
Dr. Alyssa B. Chinen, International Institute for Nanotechnology, Northwestern University, 2145 Sheridan Road, Evanston, IL 60208, USA Department of Chemistry, Northwestern University, 2145 Sheridan Road, Evanston, IL 60208, USA.
Dr. Chenxia M. Guan, International Institute for Nanotechnology, Northwestern University, 2145 Sheridan Road, Evanston, IL 60208, USA Department of Chemical and Biological Engineering, Northwestern University, 2145 Sheridan Road, Evanston, IL 60208, USA.
Dr. Caroline H. Ko, International Institute for Nanotechnology, Northwestern University, 2145 Sheridan Road, Evanston, IL 60208, USA Department of Chemistry, Northwestern University, 2145 Sheridan Road, Evanston, IL 60208, USA.
Prof. Chad A. Mirkin, International Institute for Nanotechnology, Northwestern University, 2145 Sheridan Road, Evanston, IL 60208, USA Department of Chemistry, Northwestern University, 2145 Sheridan Road, Evanston, IL 60208, USA; Department of Chemical and Biological Engineering, Northwestern University, 2145 Sheridan Road, Evanston, IL 60208, USA.
References
- 1.a) Mirkin CA, Letsinger RL, Mucic RC, Storhoff JJ. Nature. 1996;382:607. doi: 10.1038/382607a0. [DOI] [PubMed] [Google Scholar]; b) Cutler JI, Auyeung E, Mirkin CA. J Am Chem Soc. 2012;134:1376. doi: 10.1021/ja209351u. [DOI] [PubMed] [Google Scholar]
- 2.a) Giljohann DA, Seferos DS, Patel PC, Millstone JE, Rosi NL, Mirkin CA. Nano Lett. 2007;7:3818. doi: 10.1021/nl072471q. [DOI] [PMC free article] [PubMed] [Google Scholar]; b) Choi CH, Hao L, Narayan SP, Auyeung E, Mirkin CA. Proc Natl Acad Sci USA. 2013;110:7625. doi: 10.1073/pnas.1305804110. [DOI] [PMC free article] [PubMed] [Google Scholar]
- 3.a) Rosi NL, Giljohann DA, Thaxton CS, Lytton-Jean AK, Han MS, Mirkin CA. Science. 2006;312:1027. doi: 10.1126/science.1125559. [DOI] [PubMed] [Google Scholar]; b) Seferos DS, Giljohann DA, Hill HD, Prigodich AE, Mirkin CA. J Am Chem Soc. 2007;129:15477. doi: 10.1021/ja0776529. [DOI] [PMC free article] [PubMed] [Google Scholar]; c) Prigodich AE, Seferos DS, Massich MD, Giljohann DA, Lane BC, Mirkin CA. ACS Nano. 2009;3:2147. doi: 10.1021/nn9003814. [DOI] [PMC free article] [PubMed] [Google Scholar]; d) Zheng D, Seferos DS, Giljohann DA, Patel PC, Mirkin CA. Nano Lett. 2009;9:3258. doi: 10.1021/nl901517b. [DOI] [PMC free article] [PubMed] [Google Scholar]; e) Giljohann DA, Seferos DS, Daniel WL, Massich MD, Patel PC, Mirkin CA. Angew Chem, Int Ed. 2010;49:3280. doi: 10.1002/anie.200904359. [DOI] [PMC free article] [PubMed] [Google Scholar]; f) Prigodich AE, Randeria PS, Briley WE, Kim NJ, Daniel WL, Giljohann DA, Mirkin CA. Anal Chem. 2012;84:2062. doi: 10.1021/ac202648w. [DOI] [PMC free article] [PubMed] [Google Scholar]; g) Zheng D, Giljohann DA, Chen DL, Massich MD, Wang XQ, Iordanov H, Mirkin CA, Paller AS. Proc Natl Acad Sci USA. 2012;109:11975. doi: 10.1073/pnas.1118425109. [DOI] [PMC free article] [PubMed] [Google Scholar]; h) Jensen SA, Day ES, Ko CH, Hurley LA, Luciano JP, Kouri FM, Merkel TJ, Luthi AJ, Patel PC, Cutler JI, Daniel WL, Scott AW, Rotz MW, Meade TJ, Giljohann DA, Mirkin CA, Stegh AH. Sci Transl Med. 2013;5:209. doi: 10.1126/scitranslmed.3006839. [DOI] [PMC free article] [PubMed] [Google Scholar]; i) Halo TL, McMahon KM, Angeloni NL, Xu Y, Wang W, Chinen AB, Malin D, Strekalova E, Cryns VL, Cheng C, Mirkin CA, Thaxton CS. Proc Natl Acad Sci USA. 2014;111:17104. doi: 10.1073/pnas.1418637111. [DOI] [PMC free article] [PubMed] [Google Scholar]
- 4.a) Aggarwal P, Hall JB, McLeland CB, Dobrovolskaia MA, McNeil SE. Adv Drug Delivery Rev. 2009;61:428. doi: 10.1016/j.addr.2009.03.009. [DOI] [PMC free article] [PubMed] [Google Scholar]; b) Cedervall T, Lynch I, Foy M, Berggad T, Donnelly SC, Cagney G, Linse S, Dawson KA. Angew Chem Int Ed. 2007;46:5754. doi: 10.1002/anie.200700465. [DOI] [PubMed] [Google Scholar]; c) Cedervall T, Lynch I, Lindman S, Berggard T, Thulin E, Nilsson H, Dawson KA, Linse S. Proc Natl Acad Sci USA. 2007;104:2050. doi: 10.1073/pnas.0608582104. [DOI] [PMC free article] [PubMed] [Google Scholar]; d) Lundqvist M, Stigler J, Cedervall T, Berggard T, Flanagan MB, Lynch I, Elia G, Dawson K. ACS Nano. 2011;5:7503. doi: 10.1021/nn202458g. [DOI] [PubMed] [Google Scholar]; e) Lundqvist M, Stigler J, Elia G, Lynch I, Cedervall T, Dawson KA. Proc Natl Acad Sci USA. 2008;105:14265. doi: 10.1073/pnas.0805135105. [DOI] [PMC free article] [PubMed] [Google Scholar]; f) Moghimi SM, Patel HM. Adv Drug Delivery Rev. 1998;32:45. doi: 10.1016/s0169-409x(97)00131-2. [DOI] [PubMed] [Google Scholar]; g) Nagayama S, Ogawara K, Fukuoka Y, Higaki K, Kimura T. Int J Pharm. 2007;342:215. doi: 10.1016/j.ijpharm.2007.04.036. [DOI] [PubMed] [Google Scholar]; h) Owens DE, Peppas NA. Int J Pharm. 2006;307:93. doi: 10.1016/j.ijpharm.2005.10.010. [DOI] [PubMed] [Google Scholar]; i) Walkey CD, Chan WC. Chem Soc Rev. 2012;41:2780. doi: 10.1039/c1cs15233e. [DOI] [PubMed] [Google Scholar]; j) Walkey CD, Olsen JB, Guo H, Emili A, Chan WC. J Am Chem Soc. 2012;134:2139. doi: 10.1021/ja2084338. [DOI] [PubMed] [Google Scholar]; k) Walkey CD, Olsen JB, Song F, Liu R, Guo H, Olsen DW, Cohen Y, Emili A, Chan WC. ACS Nano. 2014;8:2439. doi: 10.1021/nn406018q. [DOI] [PubMed] [Google Scholar]
- 5.Chinen AB, Guan CM, Mirkin CA. Angew Chem. 2015;54:527. doi: 10.1002/anie.201409211. [DOI] [PMC free article] [PubMed] [Google Scholar]
- 6.Narayan SP, Choi CH, Hao L, Calabrese CM, Auyeung E, Zhang C, Goor OJ, Mirkin CA. Small. 2015;11:4173. doi: 10.1002/smll.201500027. [DOI] [PMC free article] [PubMed] [Google Scholar]
- 7.a) Wojciechowski P, Tenhove P, Brash JL. J Colloid Interface Sci. 1986;111:455. [Google Scholar]; b) Slack SM, Horbett TA. J Colloid Interface Sci. 1989;133:148. [Google Scholar]; c) Slack SM, Horbett TA. ACS Symp Ser. 1995;602:112. [Google Scholar]; d) Turbill P, Beugeling T, Poot AA. Biomaterials. 1996;17:1279. [PubMed] [Google Scholar]; e) Jung SY, Lim SM, Albertorio F, Kim G, Gurau MC, Yang RD, Holden MA, Cremer PS. J Am Chem Soc. 2003;125:12782. doi: 10.1021/ja037263o. [DOI] [PubMed] [Google Scholar]; f) Casals E, Pfaller T, Duschl A, Oostingh GJ, Puntes V. ACS Nano. 2010;4:3623. doi: 10.1021/nn901372t. [DOI] [PubMed] [Google Scholar]
- 8.a) Aderem A, Underhill DM. Annu Rev Immunol. 1999;17:593. doi: 10.1146/annurev.immunol.17.1.593. [DOI] [PubMed] [Google Scholar]; b) Moghimi SM, Szebeni J. Prog Lipid Res. 2003;42:463. doi: 10.1016/s0163-7827(03)00033-x. [DOI] [PubMed] [Google Scholar]; c) Owens DE, 3rd, Peppas NA. Int J Pharm. 2006;307:93. doi: 10.1016/j.ijpharm.2005.10.010. [DOI] [PubMed] [Google Scholar]; d) Alexis F, Pridgen E, Molnar LK, Farokhzad OC. Mol Pharm. 2008;5:505. doi: 10.1021/mp800051m. [DOI] [PMC free article] [PubMed] [Google Scholar]; e) Dobrovolskaia MA, Aggarwal P, Hall JB, McNeil SE. Mol Pharm. 2008;5:487. doi: 10.1021/mp800032f. [DOI] [PMC free article] [PubMed] [Google Scholar]; f) Yoo JW, Chambers E, Mitragotri S. Curr Pharm Des. 2010;16:2298. doi: 10.2174/138161210791920496. [DOI] [PubMed] [Google Scholar]; g) Moghimi SM, Hunter AC, Andresen TL. Annu Rev Pharmacol Toxicol. 2012;52:481. doi: 10.1146/annurev-pharmtox-010611-134623. [DOI] [PubMed] [Google Scholar]
- 9.a) Campagne MV, Helmy K, Katschke K, Gorgani N, Kjavin N, Elliott M, Diehl L, Scales S, Ghilardi N. J Immunol. 2006;176:S98. doi: 10.1016/j.cell.2005.12.039. [DOI] [PubMed] [Google Scholar]; b) He JQ, Wiesmann C, Campagne MV. Mol Immunol. 2008;45:4041. doi: 10.1016/j.molimm.2008.07.011. [DOI] [PubMed] [Google Scholar]; c) Mosser DM, Zhang X. In: Current Protocols in Immunology. Coligan JE, editor. Vol. 95. Wiley-VCH; Weinheim, Germany: 2011. Ch. 14. [Google Scholar]; d) Nimmerjahn F, Ravetch JV. Immunity. 2006;24:19. doi: 10.1016/j.immuni.2005.11.010. [DOI] [PubMed] [Google Scholar]; e) Swanson JA, Hoppe AD. J Leukocyte Biol. 2004;76:1093. doi: 10.1189/jlb.0804439. [DOI] [PubMed] [Google Scholar]
- 10.Patel PC, Giljohann DA, Daniel WL, Zheng D, Prigodich AE, Mirkin CA. Bioconjugate Chem. 2010;21:2250. doi: 10.1021/bc1002423. [DOI] [PMC free article] [PubMed] [Google Scholar]
- 11.Harper BL, Fine DP, Guckian JC, Cavallo T. Immunology. 1981;42:61. [PMC free article] [PubMed] [Google Scholar]
Associated Data
This section collects any data citations, data availability statements, or supplementary materials included in this article.


