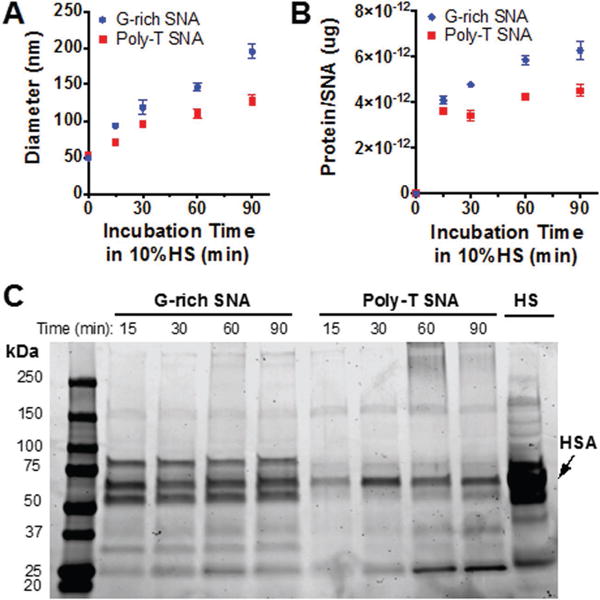
Figure 1.

Characterization of protein-coated SNAs and quantification of protein bound to SNAs. A) The hydrodynamic diameter of G-rich and poly-T SNAs incubated in HS from 15 to 90 min increases. B) Quantitative analysis of the amount of protein bound to G-rich and poly-T SNAs after incubation in HS. C) SDS-PAGE gel of proteins isolated from G-rich and poly-T SNAs after incubation in HS from 15 to 90 min indicates that more proteins, both in number and type, bind to G-rich SNAs than to poly-T SNAs. Note that the heavy band in HS corresponds to human serum albumin (HSA).
