Abstract
Here, we describe a novel method based on intronic MiMIC insertions described in Nagarkar-Jaiswal et al. (2015) to perform conditional gene inactivation in Drosophila. Mosaic analysis in Drosophila cannot be easily performed in post-mitotic cells. We therefore, therefore, developed Flip-Flop, a flippase-dependent in vivo cassette-inversion method that marks wild-type cells with the endogenous EGFP-tagged protein, whereas mutant cells are marked with mCherry upon inversion. We document the ease and usefulness of this strategy in differential tagging of wild-type and mutant cells in mosaics. We use this approach to phenotypically characterize the loss of SNF4Aγ, encoding the γ subunit of the AMP Kinase complex. The Flip-Flop method is efficient and reliable, and permits conditional gene inactivation based on both spatial and temporal cues, in a cell cycle-, and developmental stage-independent fashion, creating a platform for systematic screens of gene function in developing and adult flies with unprecedented detail.
DOI: http://dx.doi.org/10.7554/eLife.26420.001
Research Organism: D. melanogaster
eLife digest
The instructions needed to build and maintain cells in an organism are encoded in their DNA. There are many different cell types, and each type only needs a small portion of the information found in the DNA to do its job. Hence, only some of the instructions, in the form of genes, need to be active or ‘expressed’ in any given cell type.
To understand how a gene works, it is necessary to know in which cell the gene is expressed and where in the cell the gene product – normally a protein – is located. Researchers may study a gene by deleting it, which prevents the protein from being made, or by attaching a new instruction into the gene, which generates a fluorescent tag on the protein to determine where and when it is expressed. Until now, it was not possible to selectively inactivate a gene and simultaneously mark both normal cells containing the protein and mutant cells lacking the protein.
Based on an existing tagging approach, Nagarkar-Jaiswal et al. have now developed a method in which normal and mutant cells of fruit flies are marked differently. A gene of interest is tagged with a fluorescent marker called green fluorescent protein (or GFP). The same gene is then inactivated in some of the cells, which are tagged with a red marker called mCherry. Nagarkar-Jaiswal et al. compared normal and mutant cells, and were able to determine how long it takes before the mutant cells become abnormal.
With this new method, the role of numerous genes in any tissue of adult flies can be reassessed. This will allow to investigate what happens when a protein is removed in specific cells in adult flies. A future goal will be to apply this method to other animals that are more closely related to humans, such as mice, to gain a clearer picture of the role of genes in different cell types and how faulty genes may cause disease.
Introduction
Functional gene annotation requires, among others, the knowledge of phenotypes observed in mutants of the gene of interest, as well as the expression pattern and subcellular localization of the protein. For Drosophila genes whose loss causes early developmental lethality, characterization of gene function in later stages of the animal’s life cycle relies on generating mosaics. Currently, Mosaic Analysis with a Repressible Cell Marker (MARCM) (Lee and Luo, 1999) and CRISPR/Cas9-mediated somatic mutagenesis (Port et al., 2014; Xue et al., 2014) are the two major techniques used to study mutations in mosaics. While MARCM has been very successfully used in mitotically active, developing tissues, the technique has two major limitations. First, the technique relies on mitotic recombination and can therefore not be used in non-dividing cells. Second, along with the mutation under study, other mutations in the chromosome distal to the FRT site also become homozygous in mutant cells, requiring ‘rescue experiments’ of the gene of interest to validate the results (Roegiers et al., 2009). Another strategy is based on CRISPR/Cas9-mediated somatic mutagenesis to generate mosaics (Port et al., 2014; Xue et al., 2014). The limitations of CRISPR/Cas9 are that the identity of the generated lesions for the gene of interest may vary in individual cells in the same animal or tissue. Moreover, the mutant cells are not marked and cannot be distinguished from neighboring wild-type cells.
Here, we describe a new flippase (FLP)-dependent method ‘Flip-Flop’ that offers several advantages over the current techniques for generating mosaics. (1) The method does not rely on cell division and can, therefore, be broadly used for conditional gene inactivation in post-mitotic cells such as neurons. (2) It allows endogenous tagging of proteins with EGFP, which permits multiple applications, and (3) it simultaneously marks mutant cells with mCherry.
Results and discussion
The Flip-Flop construct and strategy
We engineered the ‘Flip-Flop’ cassette for conditional gene inactivation. This cassette contains two modules that are placed in opposite orientation: a protein-trap (PT) module and a gene-trap (GT) module (Figure 1A). The PT module carries a splice acceptor (SA), followed by an in-frame EGFP coding sequence, and a splice donor (SD) (Venken et al., 2011). The GT module similarly contains a SA, but is followed by the T2A peptide sequence, an mCherry coding sequence, stop codons in all three reading frames, and an SV40 polyA signal. The PT and GT modules are placed in opposite orientations and are flanked by inverted pairs of canonical FRT and FRT14 sites, forming a flip-excision switch (FLEx) (Schnütgen et al., 2003; Xue et al., 2014). The entire cassette is nested between two inverted attB sites that facilitate Recombination-Mediated Cassette Exchange (RMCE) between the Flip-Flop cassette and a target Minos-Mediated Integration Cassette (MiMIC) that resides in a coding intron of the gene of interest. When integrated in the MiMIC in the PT orientation, Flip-Flop should result in expression of the endogenous protein with an internal EGFP tag. The internal EGFP tagging does not or subtly disrupt the protein’s function in 77% of the cases (Nagarkar-Jaiswal et al., 2015). The cassette can then be converted from a PT to a GT, in vivo, by inverting the cassette’s orientation through the expression of FLP that acts on the FLEx switch (Figure 1B). Following the switch from the PT to the GT orientation, transcription is precociously terminated by the polyA sequence. When this truncated transcript is translated, the T2A site induces a translational skip (Tang et al., 2009), truncating the native protein and re-initiating translation at the mCherry sequence (Figure 1B). Hence, inversion of the Flip-Flop cassette results in the generation of a truncated protein, which is typically non-functional, and simultaneously marks the cells that are actively transcribing the gene with mCherry. While mCherry’s expression pattern recapitulates the spatiotemporal expression pattern of the recipient gene, it does not reproduce the endogenous subcellular localization of the protein (Figure 1B). In summary, expression of FLP will induce a Flip-Flop and produce mCherry-labeled mutant cells in which the gene is inactivated, whereas the surrounding cells are wild-type and express the EGFP-tagged protein.
Figure 1. Mosaic generation using the Flip-Flop cassette.
(A) The architecture of the Flip-Flop cassette. The cassette consists of two independent modules (PT and GT), that are oriented in opposite orientations. The PT module contains a splice acceptor (SA), followed by an EGFP tag and a splice donor (SD). The GT module contains a SA sequence, followed by the T2A peptide coding sequence (which will induce a translational skip), the mCherry coding region, stop codons in all three coding frames, and an SV40 polyA transcriptional termination signal. Given the opposite orientation of both modules, only one of the SA sequence will be active with respect to the recipient gene. The two modules are nested within a pair of FRT and FRT14 inverted repeats, forming a flippase-responsive FLEx switch. Finally, the entire cassette is flanked by two inverted attB sequences that permit phiC31-mediated RMCE between the Flip-Flop cassette and pre-existing MiMIC elements. A comparison of the FRT and FRT14 sequence is shown below. The FRT14 sequence varies from the canonical FRT sequence at the residues highlighted in red. (B) Schematic showing the inversion of a PT-oriented Flip-Flop cassette, inserted into the coding intron of a hypothetical gene. Upon FLP-expression, the FLEx switch undergoes two recombination events: (1) recombination between the two FRT sites or between the two FRT14 sites leads to cassette inversion that is followed by (2) excision of either the pair of FRT sites or the pair of FRT14 sites, both of which have obtained the same orientation due to the flip. Since the remaining unpaired FRT and FRT14 sites are not able to recombine, the cassette will be locked in the GT orientation. Thus, the initial PT orientation allows the gene to be tracked by EGFP-tagged protein expression in tissues. FLP activity inverts the Flip-Flop cassette in random cells, generating a mosaic tissue consisting of cells that did not undergo the flip and are still expressing the EGFP-tagged protein and cells that inverted the Flip-Flop cassette into the GT orientation, which are marked by mCherry expression. (C) (a) Wing imaginal disc from a effMI05507EGFP-T2A-mCherry/+ third instar larva, expressing Eff-EGFP-Eff (b) Wing imaginal disc from a hsFLP; effMI05507EGFP-T2A-mCherry/+ third instar larva showing hsFLP-induced clones that loose the GFP signal (c) and express mCherry (d) Scale bar = 50 µm. (D) (a) Stage 6 egg chamber obtained from SNF4AyMI09417EGFP-T2A-mCherry/+ females reveals EGFP-SNF4Aγ-EGFP expression in all follicle cells. (b) Stage 6 egg chamber obtained from hsFLP; SNF4AyMI09417EGFP-T2A-mCherry/+ females shows a mosaic tissue with groups of cells that have retained EGFP expression, and others that have inverted the Flip-Flop cassette and can be recognized by loss of EGFP expression (c) and gain of mCherry expression (d), inversion of Flip-Flop cassette is marked with loss of EGFP and expression of mCherry. Scale bar = 10 µm.
DOI: http://dx.doi.org/10.7554/eLife.26420.003

Figure 1—figure supplement 1. Flip-Flop PT insertions in eff and SNF4Aγ generate functional EGFP-tagged proteins.

Figure 1—figure supplement 2. Crossing schemes for FLP-mediated conditional gene inactivation.

Figure 1—figure supplement 3. Inversion of the Flip-Flop PT insertion in Cdep using ey-FLP.

Figure 1—figure supplement 4. Inversion of GT-oriented Flip-Flop insertions.

Figure 1—figure supplement 5. The efficiency of Flip-Flop insertions.

Flip-Flop-mediated mosaics in mitotically active cells
We created PT insertions for nine genes using available MiMIC insertions: effete (eff), Nedd8, SNF4/AMP-activated protein kinase gamma subunit (SNF4Aγ) Chondrocyte-derived ezrin-like domain containing protein (Cdep), Tripartite motif containing 9 (Trim9), Salt-Induced kinase3 (Sik3), Ankyrin2 (Ank2), Circadian trip (Ctrip) and Ecdysone-induced protein 63E (Eip63E). Seven of the nine generated PT insertions complement the lethality associated with loss of the corresponding gene, suggesting that these internally tagged proteins are biologically functional, consistent with previous observations (Nagarkar-Jaiswal et al., 2015; Venken et al., 2011). The PT insertion in eff (Figure 1—figure supplement 1A) introduces the expression of internally tagged Eff (Eff-EGFP-Eff) in the wing discs of effMI05507-EGFP-T2A-mCherry larvae (Figure 1C a). Heat-shock-induced expression of FLP (hsFLP) (Figure 1—figure supplement 2A) causes loss of the EGFP signal and induces mCherry expression in random subsets of cells (Figure 1C b-d). Similarly, the PT insertion in SNF4Aγ (Figure 1—figure supplement 1B a) leads to SNF4Aγ-EGFP-SNF4Aγ expression in adult egg chambers (Figure 1D a). The SNF4Aγ Flip-Flop cassette can be flipped to the GT orientation efficiently, generating large clones of cells expressing mCherry upon heat-shock (Figure 1D b-d). Finally, we tagged Cdep (Figure 1—figure supplement 3A a-b), observed EGFP expression in the eye-antennal discs, and efficiently induced inversions using ey-FLP (Figure 1—figure supplement 3B and Figure 1—figure supplement 2B). Hence, the PT orientation insertions permit gene expression analysis and can effectively be inverted to create mCherry marked mutant cells.
A comparison of the PTs generated using a previous, shorter, RMCE construct (GFSTF; Venken et al., 2011) and the PT of the Flip-Flop cassette did not show any obvious difference in expression pattern or genetic properties based on complementation tests. In summary, if the protein traps are functional with the GFSTF cassette they are also functional with the EGFP-tagged proteins derived from the Flip-Flop.
In addition to the above-described PT lines, we generated GT-lines expressing mCherry for five genes: eff, Cdep, Trim9, Ank2, and Ctrip. Complementation tests with independently derived loss-of-function alleles (or deficiencies) indicate that these GT-alleles are indeed loss-of-function alleles. Note that none of these GT insertions induce an obvious dominant phenotype. We observed efficient conversion of an initial GT insertion to the PT orientation for effMI05507 T2A-mCherry-EGFP, using either the ey-FLP or hsFLP drivers in larval brains. As shown, the use of ey-FLP introduces Eff-EGFP-Eff expression in the eye discs (area within white dotted lines), as well as the area of the brain where eyeless is expressed (demarcated by blue dotted lines) (Figure 1—figure supplement 4A). In contrast to the ey-FLP, smaller clones of randomly positioned wild-type and mutant cells can be generated by stochastic FLP expression when applying heat shocks. Indeed, heat-shock-induced hsFLP expression brought about small patches of EGFP-positive cells in effMI05507 T2A-mCherry-EGFP larval brains (Figure 1—figure supplement 4B). This type of experiment creates wild-type cells in an otherwise mutant animal and should help to assess whether a mutant phenotype can be attenuated or reverted, or not. In addition, these experiments may help identify in which tissue an essential gene is required.
Finally, for Nedd8 and Sik3 we generated PT lines, but these insertions failed to complement corresponding deficiencies, showing that the internal EGFP tag disrupts protein function. Nevertheless, we were able to induce inversions for both genes using ey-FLP, confirming our observation that flipping the Flip-Flop cassette is efficient (Figure 1—figure supplement 4C and Figure 1—figure supplement 5D and E). In summary, both orientations of the Flip-Flop cassette could effectively be flipped.
To examine and compare the efficiency of the Flip-Flop inversions, we tested six genes using the same FLP-source, under identical conditions. For SNF4Aγ, Trim9 and eff, more than 95% of the cells undergo cassette inversion. For Nedd8, cdep, and Sik3, more than 70% cells displayed Flip-Flop inversions (Figure 1—figure supplement 5). Hence, inducing Flip-Flop inversions in eye-antennal discs is highly efficient for all genes tested.
Conditional gene inactivation using Flip-Flop in post-mitotic cells
Next, we tested if Flip-Flop can be used for gene inactivation in post-mitotic cells by using Trim9 as an example. Previously, Song et al. (2011) created an imprecise excision of a P-element (P{GawB}Trim9[NP4638]) inserted in the 5′-regulatory region of Trim9 and reported that animals lacking the first few amino acids of Trim9 are viable and exhibit a droopy wing phenotype (Song et al., 2011). We generated both GT- (Trim9MI12525P T2A-mCherry-EGFP) and PT-oriented (Trim9MI12525EGFP- T2A-mCherry) Flip-Flop insertions in Trim9 (Figure 2—figure supplement 1A a). The GT insertion is homozygous lethal and does not complement a deficiency (Trim9Df), while the PT insertion is viable in trans over Trim9Df (Figure 2—figure supplement 1A b) suggesting that the PT encodes a functional protein. When the PT insertion in Trim9MI12525EGFP- T2A-mCherry/Trim9Df animals was inverted in all cells using a ubiquitously expressed (Actin-GAL) FLP, the animals died as second instar larvae. This, together with the lethality observed in the GT insertion, suggests that a strong loss of Trim9 leads to early developmental lethality.
We then examined the consequences of neuronal loss of Trim9, by inverting the Trim9MI12525EGFP T2A--mCherry PT insertion in larval and adult brains using neuronally expressed FLP (nSyb-GAL4>UAS-FLP) (Figure 1—figure supplement 2C and Figure 2—figure supplement 1B). Prior to the flip, in the PT orientation, Trim9 is expressed in numerous neurons in the larval brain (Figure 2A a-d) and the protein is localised to nuclei and cytoplasm (Figure 2A e-h). These cells do not express mCherry. Following inversion to the GT orientation, we detected mCherry expressing cells in the larval brain (Figure 2A a’-d’). Upon close examination, we observed three different populations of neurons. First, cells that have undergone cassette inversion and are marked with mCherry (Figure 2A e’-h’, indicated by number (1) Second, cells that are EGFP-positive (Trim9-EGFP-Trim9) and did not flip (Figure 2A e’-h’, indicated by number (2) Third, a population of cells that expresses both Trim9-EGFP-Trim9 as well as mCherry (Figure 2A e’-h’, indicated by number (3) Note that Trim9-EGFP-Trim9 levels are lower in these cells. We reason that these cells have undergone cassette inversion and are hence expressing mCherry, but that the Trim9-EGFP-Trim9 that was produced prior to the flip has not been fully degraded. Thus, the population of cells that express only mCherry must have lost most of the tagged Trim9 protein, whereas Trim9-EGFP-Trim9 perdures in a subset of cells that are yellow. Importantly, this allows analysis of protein perdurance. In addition, it permits researchers to only select and analyse those cells that are truly mutant and have lost the majority of the wild-type protein. Neuronal Trim9 inactivation does not affect the eclosion of the animal but leads to the sterility of short-lived animals with droopy wings, corroborating previous observations associated with the loss of Trim9 (Song et al., 2011).
Figure 2. Inactivation of Trim9 in post-mitotic cells using nSyb-GAL4/UAS-FLP.
(A) A third instar larval brain of nSyb-GAL4/+; Trim9MI12525EGFP-T2A-mCherry/Trim9Df, raised at 29°C stained for EGFP (green, a, d and f), mCherry (red, b, d and g) and Elav (blue, c, d and h). In the absence of UAS-FLP, only GFP signal is detected, reflecting the Trim9-EGFP-Trim9 expression pattern. In contrast, mCherry is not expressed. (b, d and g). Magnification of the region indicated by a white square in panel d (e–h). Third instar larval brains of UAS-FLP/nSyb-GAL4; Trim9MI12525EGFP-T2A-mCherry/Trim9Df, expressing FLP under the control of nSyb-GAL4 show cassette inversion that leads to the loss of EGFP and gain of mCherry expression in neurons (a’–h’). Magnification of the region indicated by a white square in panel (d’) shows the existence of three populations of neurons (e’–h’): neurons that express mCherry and have completely lost GFP expression (1), neurons that have not undergone cassette inversion and thus still express GFP but lack mCherry expression (2) and neurons that express both tags, suggesting they have recently undergone cassette flip (as indicated by mCherry expression), and still contain some remaining Trim9-EGFP-Trim9 protein that perdures following the cassette flip, scale bar = 50 µm (a, b, c, d, a’, b’, c’ and d’), scale bar = 5 µm (e, f, g, h, e’, f’, g’ and h’). (B) Adult brain of tubP-GAL80ts; Trim9MI12525EGFP-T2A-mCherry/Trim9Df; UAS-FLP/nSyb-GAL4 animals stained for EGFP (green), mCherry (red) and Elav (blue). The temperature-sensitive GAL80 (GAL80ts), expressed under a tubulin promoter (tubP) was used to prevent nSyb-GAL4 from driving expression of UAS-FLP during development. (a–d) Adult brain of tubP-GAL80ts; Trim9MI12525EGFP-T2A-mCherry/Trim9Df; UAS-FLP/nSyb-GAL4 control animals, raised at 18°C display Trim9-EGFP-Trim9 (green, a and d) and do not show any mCherry expression (red, b and d). (a’–d’) Adult brains of tubP-GAL80ts; Trim9MI12525EGFP-T2A-mCherry/Trim9Df; UAS-FLP/nSyb-GAL4 animals, raised at 18°C until 4 days after eclosion, and then shifted to 29°C to induce FLP-expression, show mCherry-expressing neuronal cells in which the cassette inversion has taken place (red, b’ and d’), scale bar = 50 µm.

Figure 2—figure supplement 1. Inactivation of Trim9 in post-mitotic cells through induction of FLP using nSyb-GAL4/UAS-FLP.

Next, we explored the use of the Flip-Flop cassette in post-mitotic, adult neurons. We expressed GAL80ts (a suppressor of GAL4 at low temperature) to prevent nSyb-GAL4 from inducing flips during development. tubP-GAL80ts; Trim9MI12525EGFP- T2A-mCherry/Trim9Df; UAS-FLP/nSyb-GAL4 animals were raised at 18°C until the fourth day of adulthood and were subsequently shifted to 29°C. Animals that were not shifted to 29°C did not express mCherry in adult brains (Figure 2B a-d). In contrast, those shifted to a higher temperature on the fourth day of adulthood showed loss of Trim9-EGFP-Trim9 expression and gain of mCherry in a large subset of neurons (Figure 2B a’-d’). Interestingly, animals shifted to 29°C do not show droopy wing phenotype, but have a reduced lifespan. This suggests that the droopy wing phenotype observed by Song et al. (2011) is due to the loss of neuronal Trim9 during development, and not because of loss of the gene in adults.
Loss of SNF4Aγ in adults flies leads to severe neurodegeneration
To further explore the use of Flip-Flop in adult flies, we selected a subunit of the AMP-activated protein kinase (AMPK) complex. The AMPK complex is involved in sensing stresses such as a drop in the ratio of ATP/AMP, hypoxia, ischemia, and heat-shock (Hardie et al., 2003). The ATP/AMP ratio is sensed through an allosteric mechanism by the non-catalytic γ subunit of the AMPK complex, which in turn promotes the phosphorylation of the catalytic α subunit enhancing α subunit’s kinase activity (Sanders et al., 2007; Scott et al., 2004). Phosphorylation of AMPK’s targets by the α-subunit activates a signalling cascade that ultimately regulates fatty acid oxidation, autophagy, and mitochondrial biogenesis and boosts the ATP/AMP ratio within the cell (Hardie et al., 2012). Sensing the ATP/AMP ratio by the γ subunit is thus critical for the proper function of the AMPK complex, and together with the other AMPK subunits, the γ subunit is crucial for proper energy homeostasis (Hardie et al., 2003).
In Drosophila, the γ subunit is encoded by SNF4Aγ, with 16 transcriptional isoforms. Of these, 15 should be tagged using MI09417 (Figure 1—figure supplement 1B a). We converted this MiMIC insertion into a T2A-GAL4 (Diao et al., 2015) allele (SNF4AγMI09417T2A>GAL4), and a Flip-Flop insertion in the PT orientation (SNF4AγMI09417EGFP- T2A-mCherry) (Figure 3A and Figure 1—figure supplement 1B a). SNF4AγMI09417T2A>GAL4 truncates the SNF4Aγ protein and simultaneously expresses GAL4 in the spatiotemporal pattern of SNF4Aγ. The SNF4AγMI09417 T2A>GAL4 allele fails to complement the SNF4AγDf and acts as a loss-of-function allele. On the other hand, SNF4AγMI09417EGFP-T2A-mCherry/SNF4AγMI09417 and SNF4AγMI09417EGFP-T2A-mCherry/SNF4AγDf animals are viable, indicating that the Flip-Flop insertion produces a functional SNF4Aγ-EGFP-SNF4Aγ protein (Figure 1—figure supplement 1B b).
Figure 3. Developmental and neuronal functions of SNF4Aγ revealed through broad or tissue-specific inactivation.

(A) Gene structure of SNF4Aγ, displaying one of the transcriptional isoforms and the precise location of MiMIC insertion MI09417 (red triangle) as well as the orientation of the MiMIC cassette (red arrow). The structure of the T2A-GAL4 insertion (SNF4AγMI094177T2>GALl4) and the PT oriented Flip-Flop insertion (SNF4AγMI09417EGFP-T2A-mCherry) are shown below. (B) (a) Control third instar larva (SNF4AγMI09417EGFP-T2A-mCherry/SNF4AγMI09417 T2A>-GALl4; PT) and third instar larva in which SNF4Aγ is inactivated through cassette flip, driven by the T2A-GAL4 insertion in SNF4Aγ on the other chromosome (UAS-FLP;; SNF4AγMI094177EGFP-T2A-mCherry/SNF4AγMI09417T2A>GAL4; GT) (b) Expression of mCherry in larvae shown in (a). Arrowhead indicates auto-fluorescence of gut tissue in control animals (SNF4AγMI04147EGFP-T2A-mCherry/SNF4AγMI09417T2A-GAL4; PT), which differs from the mCherry signal in animals that underwent cassette flip (UAS-FLP;;SNF4AγMI09147EGFP-T2A-mCherry/SNF4AγMI09147 T2A>GAL4, GT). (c) Pupae of control (PT) and experiment genotypes (GT). Loss of SNF4Aγ leads to premature pupariation and death. (C) ey-FLP-mediated cassette inversion in developing eyes leads to electroretinogram (ERG) defects. (Left) ERG trace obtained from control animals (SNF4AγMI09417EGFP-T2A-mCherry/SNF4AγDf) on day 1 and day 30. (Right) ERG trace obtained from experimental animals (ey-FLP; SNF4AγMI09417EGFP-T2A-mCherry/SNF4AγDf) in which ey-FLP-mediated cassette inversion induced loss of SNF4Aγ in >95% of the developing eye (see also Figure 1—figure supplement 5B). (D) Histogram showing relative ERG amplitude (indicated by the red double-headed arrow in (C)), measured on days 1 and 30 of control animals (PT/green) and experimental animals with ey-FLP-mediated SNF4Aγ inactivation (GT/red). (At least eight animals of each genotype were analysed. *** indicates a p-value<0.001 and ** indicates a p-value<0.01 obtained by performing a student T-test). (E) Image displaying adult eyes of control (SNF4AγMI09417EGFP-T2A-mCherry/SNF4AγDf, a–c) and experimental (ey-FLP; SNF4AγMI09417EGFP-T2A-mCherry/SNF4AγDf, a’–c’) animals stained with phalloidin (blue) marking the seven visible photoreceptors arranged within each ommatidium (red dotted circle), SNF4Aγ-EGFP-SNF4Aγ expression (green) and mCherry expression (red). (b, b’, c and c’) mCherry channel (b, b’) and phalloidin staining (c, c’) of the image shown in (a and a’). (a’) eyFLP-driven loss of SNF4Aγ induces mCherry expression (b’) and leads to defects in photoreceptor arrangement and loss of individual rhabdomeres in ommatidia (red dotted circle) (c’ indicated by numbers), whereas control ommatidia consistently contain seven visible rhabdomeres (c), scale bar = 5 µm.
In SNF4AγMI09147 T2A>GAL4 /SNF4AγMI09147EGFP- T2A-mCherry animals, SNF4γ-EGFP-SNF4Aγ is broadly expressed in larvae (data not shown). In the presence of UAS-FLP, the GAL4 from SNF4AγMI09417 T2A>GAL4 will drive FLP expression in cells expressing SNF4Aγ, which will convert the PT insertion into a GT insertion. The GT insertion, while expressing mCherry, leads to the loss of functional protein produced by the SNF4AγMI09147EGFP-T2A-mCherry allele. Hence, UAS-FLP;; SNF4AγMI09417EGFP-T2A-mCherry/SNF4AγMI094177 T2A>GAL4 animals lack expression of both alleles of SNF4Aγ (Figure 1—figure supplement 2D). These animals die as poorly developed pupae and are slim and elongated in the larval stage (Figure 3B b-c). These larvae show a broad expression of mCherry that resembles the EGFP expression pattern from SNF4AγMI09417EGFP- T2A-mCherry allele (Figure 3B b).
Next, we induced Flip-Flop inversion in eyes. The Drosophila eye is a highly organised structure that is composed of about 800 small functional units called ommatidia. Every ommatidium contains eight photoreceptor cells (R1-R7) each with a rhabdomere, the light-sensing organelle. Within each ommatidium, rhabdomeres are arranged in a highly stereotypic fashion (Figure 3E c control panel, indicated by numbers). In ey-FLP;;SNF4AγMI09417EGFP-T2A-mCherry/SNF4AγDf animals, almost all photoreceptors inverted from the PT- to GT- orientation, as revealed by mCherry expression (Figure 3E b’). Inverting the cassette in SNF4Aγ to a GT orientation reduces the amplitude of the electroretinogram (ERG) in 1-day-old flies. These animals did not show a stronger reduction in ERG amplitude when measured at day 30 and hence do not show further degeneration (Figure 3C and D). We also observed a reduction in the number of rhabdomeres as well as defects in photoreceptor organisation (Figure 3E–c’). The loss of SNF4Aγ disrupts energy homeostasis, possibly prevents the photoreceptors from meeting their high-energy demand and leading to a reduction in their activity. Similar defects have been described in alicorn mutant eye clones (SNF4Aα) (Spasić et al., 2008).
It has been previously shown that SNF4Aγ is required for autophagy (Lippai et al., 2008). We, therefore, analysed the role of SNF4Aγ in autophagy in mutant cells generated by Flip-Flop inversion. To this end, we induced Flip-Flop-mediated loss of SNF4Aγ in the adult gut and starved adults for 24 hr by growing them on agar lacking amino acids (aa) (Figure 4A). To analyse the induction of autophagy, we stained adult gut from these animals for p62, a marker that is degraded by autophagy. If SNF4Aγ is required for autophagy, loss of SNF4Aγ should lead to p62 accumulation in mutant cells, as they should not induce autophagy. However, we observed a loss of p62 in mutant cells (mCherry positive) and robust staining of p62 in control cells (EGFP positive, indicated by red arrows) (Figure 4B and Figure 4—figure supplement 1). Interestingly, this parallels the observation by Sahani et al. (2014) in vertebrate cells. These authors observed that following prolonged amino acid starvation, the autophagy marker p62 is restored because of an increase in transcription and translation mediated by the availability of autophagy derived aa. Hence, we propose that loss of SNF4Aγ blocks autophagy, deprives cells of aa during starvation, leading to a loss of p62. Similar data have been documented in Drosophila larvae and mammalian cells (B'chir et al., 2014; Colosetti et al., 2009; Duran et al., 2011; Erdi et al., 2012).
Figure 4. Loss of SNF4Aγ in adults flies leads to autophagic and neurodegenerative phenotypes.
(A) Flow chart describing the experimental outline to induce autophagy in the adult gut (B) Image displaying the adult midgut from amino acid-starved hsFLP; SNF4AγMI09417EGFP-T2A-mCherry/ SNF4AγMI09417 animals, stained for GFP (a, d), mCherry (b, d), p62 (c, d) and DAPI (white) (d). Red arrows indicate control cells expressing SNF4Aγ-EGFP-SNF4Aγ, revealing higher levels of p62. In contrast, mutant cells are mCherry positive and have reduced p62 levels, indicating a defect in autophagy induction, scale bar = 5 µm (C) Haemotoxylin and Eosin staining on brain sections of SNF4AγMI09417EGFP-T2A-mCherry/SNF4Aγ9417 (control) and hsFLP; SNF4AγMI09417EGFP-T2A-mCherry/ SNF4AγMI09417 experimental flies. hsFLP-induced cassette inversion in adult flies causes massive neurodegeneration, evident by the severe structural changes observed in brains of 3- and 10-day-old experimental animals (b and d), whereas age-matched control brains show no sign of neurodegeneration (a and c).

Figure 4—figure supplement 1. P62 expression in hsFLP; SNF4AγMI09417EGFP-T2A-mCherry/ TM3,Sb[1] animals.

Previous studies have described that developmental loss of SNF4Aγ leads to neurodegeneration (Cook et al., 2012; Tschäpe et al., 2002). To further characterise the role of SNF4Aγ in Drosophila neurons, we used a post-mitotic GAL4 driver C155-GAL4, to drive UAS-FLP and obtain GT orientated Flip Flops in all neurons. Such pan-neuronal flip of SNF4AγMI09417EGFP-T2A-mCherry into a non-functional GT leads to severe locomotor defects in adult flies (data not shown). We also examined the role of SNF4Aγ in adults using hsFLP-mediated cassette inversion. Flies of the genotype hsFLP; SNF4AγMI09417EGFP- T2A-mCherry / SNF4AγMI09417 were raised at 18°C and were given a 2-hr heat-shock at 37°C, 3 days after eclosion. Two days after the heat-shock, H and E staining of adult brains revealed severe neurodegeneration. The extent of neuronal loss did not worsen by day 10 (Figure 4C b and d). In addition, these flies typically die 3 to 4 weeks later. Following heat-shock, animals that do not carry hsFLP do not show obvious lesions in the brain (Figure 4C a and c). We conclude that loss of SNF4Aγ leads to neuronal demise in adult flies.
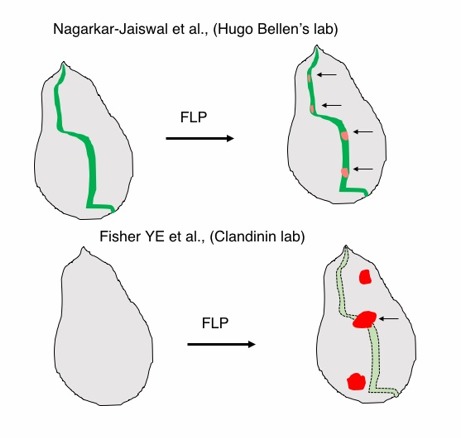
In conclusion, the Flip-Flop strategy allows conditional gene inactivation and generation of mosaics for a side-by-side comparison of mutant and wild-type cells in the same tissue, while simultaneously marking wild-type and mutant cells with different fluorescent markers. By using different sources of FLP, one can control the spatial and temporal pattern of mosaic generation and gene inactivation. Using hsFLP, we show that Flip-Flop can be used to severely inhibit gene function during development, as well as in adults in both mitotically active and post-mitotic cells. Flip-Flop can therefore reliably be used to explore gene functions both during development and in adult flies. Recently, a similar Flippase-based conditional gene inactivation method ‘FlpStop’ was published (Fisher et al., 2017). Both the FlpStop and Flip-Flop strategies employ a similar Flex switch to induce local cassette inversion. However, there are several important differences between the two technologies. (1) FlpStop does not tag the endogenous protein with a fluorescent tag, while Flip-Flop produces an internally EGFP-tagged protein. While this may seem beneficial for genes where an internal tag is deleterious to the protein, we argue that for the majority of the genes the internal EGFP tag is not detrimental (this study; Nagarkar-Jaiswal et al., 2015). In contrast, endogenous tagging is very advantageous as it permits to track the expression and subcellular localization of a protein, allows anti-GFP antibody-mediated immunoprecipitations followed by mass spectroscopy (David-Morrison et al., 2016; Yoon et al., 2017), enables ChIP sequencing (Nègre et al., 2011), and permits mRNA or protein removal with iGFPi (Neumüller et al., 2012) or deGradFP (Caussinus et al., 2011; Nagarkar-Jaiswal et al., 2015; Urban et al., 2014). Finally, the EGFP tag allows us for the first time to track protein perdurance in mutant cells. (2) The second major difference between FlpStop and Flip-Flop relates to how mutant cells are marked. In FlpStop, tdTomato is expressed under the control of the UAS/GAL4 system. Hence, cells that have undergone inversion will express tdTomato, irrespective of the expression pattern of the gene. In contrast, Flip-Flop will label cells with mCherry only if they express the gene of interest. In summary, the ability to track the loss of the protein of interest in mutant cells concomitant with loss of the EGFP signal while simultaneously marking the mutant cells with mCherry from the same regulatory elements distinguishes Flip-Flop from all other mosaic analyses methods.
We would like to note that Flip-Flop insertions can be generated based on existing MiMIC insertions (Nagarkar-Jaiswal et al., 2015) as well as MiMIC-like elements introduced by CRISPR/Cas9 (Zhang et al., 2014) and can be extended to Drosophila cell culture system using RMCE (Manivannan et al., 2015). We, therefore, believe that the use of Flip-Flop will permit functional annotation of numerous genes in unprecedented detail.
Materials and methods
Plasmid construction
Flip-Flop constructs were generated using the following steps: ‘attB-FRT14-FRT-SA-(GGS)4-PhaseX-EGFP-(GGS)4-SD-{SA-3xSTOP-SV40pA}reverse orientation-FRT14-FRT-attB’ for all three reading frames were synthesised in pUC57 (Genewiz). The T2A-mCherry fragments with appropriate coding frame were amplified using PCR and cloned as AgeI/HindIII fragment in pUC57-“attB-FRT14-FRT-SA-(GGS)4-PhaseX-EGFP-(GGS)4-SD-{SA-3xSTOP-SV40pA} reverse orientation-FRT14-FRT-attB to create pFlip-Flop-P0, pFlip-Flop-P1 and pFlip-Flop-P2.
Generation of Flip-Flop fly lines via RMCE
RMCE was performed as described in Nagarkar-Jaiswal et al., 2015.
Mosaic analysis
Mosaics were generated in larval imaginal discs and brain tissue using FLP expressed under the control of eyeless promoter (ey-FLP) or using GAL4 drivers (C155-GAL4 or nSyb-GAL4) to drive the expression of UAS-FLP. Corresponding crosses (Figure 1—figure supplement 3) were raised at 25°C. For experiments where hsFLP was used to generate mosaics, embryos from corresponding crosses (Figure 1—figure supplement 3) were collected for 24–30 hr. These embryos were given a heat-shock in a water bath at 37°C for one hr. Animals were raised at 25°C until the third larval instar stage before analysis. For adult mosaics, appropriate fly crosses (Figure 1—figure supplement 2) were set up at 18°C. Three-day-old adult flies were heat shocked at 37°C in an air incubator for 2 hr. For ovaries (Figure 1—figure supplement 3c), females were dissected 4 days after eclosion. For adult brains (Figure 4B), adults were recovered at 25°C and dissected on days 3 or 10.
Immunostaining
Larval brain, imaginal discs, and adult brain staining were performed as described in Nagarkar-Jaiswal et al., 2015, adult ovary staining was performed as described in Urban et al. (2014). Adult eye staining was performed as described in Jaiswal et al. (2015).
Antibodies
Primary antibodies: chicken anti-GFP 1:500 (Abcam, ab13970; RRID:AB_300798), rabbit anti-DsRed 1:500 (Clontech, 632496; RRID:AB_10013483), rabbit anti p62 1:2000 (David-Morrison et al., 2016) and rat anti-Elav 1:500 (DSHB, 7E8A10) (O'Neill et al., 1994). Secondary antibodies: Alexa 488 (RRID:AB_142924; Invitrogen, Life Technologies, Grand Island, NY), Cy5 (RRID:AB_2338072 and RRID:AB_2338393) and Cy3 (RRID:AB_2338059) conjugated secondary antibodies (Jackson ImmunoResearch, West Grove, PA) were used at 1:500. Phalloidin conjugated with Alexa 647 (Invitrogen) was used at 1:500.
Electroretinogram (ERG)
Recordings were performed as described in Nagarkar-Jaiswal et al. (2015).
Adult brain histology
Adult fly heads were fixed in 8% glutaraldehyde (EM grade) and embedded in paraffin. Sections (10 µm) were prepared by a microtome (Leica) and stained with Hematoxylin and Eosin as described in Chouhan et al., 2016. At least three animals were examined for each genotype.
Acknowledgements
We thank Yuchun He for microinjections. We thank Nele Haelterman, Oguz Kanca, David Li-Kroeger and Shinya Yamamoto for discussion and comments on the manuscript. This research was supported by NIGMS R01GM067858, whereas Confocal microscopy was supported by NICHD U54 HD083092 to the Baylor College of Medicine Intellectual and Developmental Disabilities Research Center. Stocks obtained from the Bloomington Drosophila Stock Center (NIH P40OD018537) were used in this study. HJB is an Investigator of the Howard Hughes Medical Institute.
Funding Statement
The funders had no role in study design, data collection and interpretation, or the decision to submit the work for publication.
Funding Information
This paper was supported by the following grants:
Howard Hughes Medical Institute to Sonal Nagarkar-Jaiswal, Hugo J Bellen.
National Institute of Neurological Disorders and Stroke NINDS U54 NS093793 to Sathiya N Manivannan.
Eunice Kennedy Shriver National Institute of Child Health and Human Development NICHD U54 HD083092 to Zhongyuan Zuo.
Robert A. and Renee E. Belfer Family Foundation to Zhongyuan Zuo.
National Institute of General Medical Sciences R01GM067858 to Hugo J Bellen.
Additional information
Competing interests
HJB: Reviewing editor, eLife.
The other authors declare that no competing interests exist.
Author contributions
SN-J, Conceptualization, Data curation, Formal analysis, Validation, Investigation, Methodology, Writing—original draft, Writing—review and editing.
SNM, Data curation, Formal analysis, Validation, Investigation, Methodology, Writing—original draft, Writing—review and editing.
ZZ, Data curation, Methodology.
HJB, Conceptualization, Formal analysis, Supervision, Funding acquisition, Writing—original draft, Project administration, Writing—review and editing.
References
- B'chir W, Chaveroux C, Carraro V, Averous J, Maurin AC, Jousse C, Muranishi Y, Parry L, Fafournoux P, Bruhat A. Dual role for CHOP in the crosstalk between autophagy and apoptosis to determine cell fate in response to amino acid deprivation. Cellular Signalling. 2014;26:1385–1391. doi: 10.1016/j.cellsig.2014.03.009. [DOI] [PubMed] [Google Scholar]
- Caussinus E, Kanca O, Affolter M. Fluorescent fusion protein knockout mediated by anti-GFP nanobody. Nature Structural & Molecular Biology. 2011;19:117–121. doi: 10.1038/nsmb.2180. [DOI] [PubMed] [Google Scholar]
- Chouhan AK, Guo C, Hsieh YC, Ye H, Senturk M, Zuo Z, Li Y, Chatterjee S, Botas J, Jackson GR, Bellen HJ, Shulman JM. Uncoupling neuronal death and dysfunction in Drosophila models of neurodegenerative disease. Acta Neuropathologica Communications. 2016;4:62. doi: 10.1186/s40478-016-0333-4. [DOI] [PMC free article] [PubMed] [Google Scholar]
- Colosetti P, Puissant A, Robert G, Luciano F, Jacquel A, Gounon P, Cassuto JP, Auberger P. Autophagy is an important event for megakaryocytic differentiation of the chronic myelogenous leukemia K562 cell line. Autophagy. 2009;5:1092–1098. doi: 10.4161/auto.5.8.9889. [DOI] [PubMed] [Google Scholar]
- Cook M, Mani P, Wentzell JS, Kretzschmar D. Increased RhoA prenylation in the loechrig (loe) mutant leads to progressive neurodegeneration. PLoS One. 2012;7:e44440. doi: 10.1371/journal.pone.0044440. [DOI] [PMC free article] [PubMed] [Google Scholar]
- David-Morrison G, Xu Z, Rui YN, Charng WL, Jaiswal M, Yamamoto S, Xiong B, Zhang K, Sandoval H, Duraine L, Zuo Z, Zhang S, Bellen HJ. WAC regulates mTOR activity by acting as an adaptor for the TTT and Pontin/Reptin Complexes. Developmental Cell. 2016;36:139–151. doi: 10.1016/j.devcel.2015.12.019. [DOI] [PMC free article] [PubMed] [Google Scholar]
- Diao F, Ironfield H, Luan H, Diao F, Shropshire WC, Ewer J, Marr E, Potter CJ, Landgraf M, White BH. Plug-and-play genetic access to Drosophila cell types using exchangeable exon cassettes. Cell Reports. 2015;10:1410–1421. doi: 10.1016/j.celrep.2015.01.059. [DOI] [PMC free article] [PubMed] [Google Scholar]
- Duran A, Amanchy R, Linares JF, Joshi J, Abu-Baker S, Porollo A, Hansen M, Moscat J, Diaz-Meco MT. p62 is a key regulator of nutrient sensing in the mTORC1 pathway. Molecular Cell. 2011;44:134–146. doi: 10.1016/j.molcel.2011.06.038. [DOI] [PMC free article] [PubMed] [Google Scholar]
- Erdi B, Nagy P, Zvara A, Varga A, Pircs K, Ménesi D, Puskás LG, Juhász G. Loss of the starvation-induced gene Rack1 leads to glycogen deficiency and impaired autophagic responses in Drosophila. Autophagy. 2012;8:1124–1135. doi: 10.4161/auto.20069. [DOI] [PMC free article] [PubMed] [Google Scholar]
- Fisher YE, Yang HH, Isaacman-Beck J, Xie M, Gohl DM, Clandinin TR. FlpStop, a tool for conditional gene control in Drosophila. eLife. 2017;6:e22279. doi: 10.7554/eLife.22279. [DOI] [PMC free article] [PubMed] [Google Scholar]
- Hardie DG, Ross FA, Hawley SA. AMPK: a nutrient and energy sensor that maintains energy homeostasis. Nature Reviews Molecular Cell Biology. 2012;13:251–262. doi: 10.1038/nrm3311. [DOI] [PMC free article] [PubMed] [Google Scholar]
- Hardie DG, Scott JW, Pan DA, Hudson ER. Management of cellular energy by the AMP-activated protein kinase system. FEBS Letters. 2003;546:113–120. doi: 10.1016/S0014-5793(03)00560-X. [DOI] [PubMed] [Google Scholar]
- Jaiswal M, Haelterman NA, Sandoval H, Xiong B, Donti T, Kalsotra A, Yamamoto S, Cooper TA, Graham BH, Bellen HJ. Impaired mitochondrial energy production causes Light-Induced photoreceptor Degeneration Independent of oxidative stress. PLOS Biology. 2015;13:e1002197. doi: 10.1371/journal.pbio.1002197. [DOI] [PMC free article] [PubMed] [Google Scholar]
- Lee T, Luo L. Mosaic analysis with a repressible cell marker for studies of gene function in neuronal morphogenesis. Neuron. 1999;22:451–461. doi: 10.1016/S0896-6273(00)80701-1. [DOI] [PubMed] [Google Scholar]
- Lippai M, Csikós G, Maróy P, Lukácsovich T, Juhász G, Sass M. SNF4Agamma, the Drosophila AMPK gamma subunit is required for regulation of developmental and stress-induced autophagy. Autophagy. 2008;4:476–486. doi: 10.4161/auto.5719. [DOI] [PubMed] [Google Scholar]
- Manivannan SN, Jacobsen TL, Lyon P, Selvaraj B, Halpin P, Simcox A. Targeted integration of Single-Copy Transgenes in Drosophila Melanogaster Tissue-Culture cells using Recombination-Mediated Cassette Exchange. Genetics. 2015;201:1319–1328. doi: 10.1534/genetics.115.181230. [DOI] [PMC free article] [PubMed] [Google Scholar]
- Nagarkar-Jaiswal S, Lee PT, Campbell ME, Chen K, Anguiano-Zarate S, Gutierrez MC, Busby T, Lin WW, He Y, Schulze KL, Booth BW, Evans-Holm M, Venken KJ, Levis RW, Spradling AC, Hoskins RA, Bellen HJ. A library of MiMICs allows tagging of genes and reversible, spatial and temporal knockdown of proteins in Drosophila. eLife. 2015;4:05338. doi: 10.7554/eLife.05338. [DOI] [PMC free article] [PubMed] [Google Scholar]
- Nègre N, Brown CD, Ma L, Bristow CA, Miller SW, Wagner U, Kheradpour P, Eaton ML, Loriaux P, Sealfon R, Li Z, Ishii H, Spokony RF, Chen J, Hwang L, Cheng C, Auburn RP, Davis MB, Domanus M, Shah PK, Morrison CA, Zieba J, Suchy S, Senderowicz L, Victorsen A, Bild NA, Grundstad AJ, Hanley D, MacAlpine DM, Mannervik M, Venken K, Bellen H, White R, Gerstein M, Russell S, Grossman RL, Ren B, Posakony JW, Kellis M, White KP. A cis-regulatory map of the Drosophila genome. Nature. 2011;471:527–531. doi: 10.1038/nature09990. [DOI] [PMC free article] [PubMed] [Google Scholar]
- Neumüller RA, Wirtz-Peitz F, Lee S, Kwon Y, Buckner M, Hoskins RA, Venken KJ, Bellen HJ, Mohr SE, Perrimon N. Stringent analysis of gene function and protein-protein interactions using fluorescently tagged genes. Genetics. 2012;190:931–940. doi: 10.1534/genetics.111.136465. [DOI] [PMC free article] [PubMed] [Google Scholar]
- O'Neill EM, Rebay I, Tjian R, Rubin GM. The activities of two Ets-related transcription factors required for Drosophila eye development are modulated by the Ras/MAPK pathway. Cell. 1994;78:137–147. doi: 10.1016/0092-8674(94)90580-0. [DOI] [PubMed] [Google Scholar]
- Port F, Chen HM, Lee T, Bullock SL. Optimized CRISPR/Cas tools for efficient germline and somatic genome engineering in Drosophila. PNAS. 2014;111:E2967–E2976. doi: 10.1073/pnas.1405500111. [DOI] [PMC free article] [PubMed] [Google Scholar]
- Roegiers F, Kavaler J, Tolwinski N, Chou YT, Duan H, Bejarano F, Zitserman D, Lai EC. Frequent unanticipated alleles of lethal giant larvae in Drosophila second chromosome stocks. Genetics. 2009;182:407–410. doi: 10.1534/genetics.109.101808. [DOI] [PMC free article] [PubMed] [Google Scholar]
- Sahani MH, Itakura E, Mizushima N. Expression of the autophagy substrate SQSTM1/p62 is restored during prolonged starvation depending on transcriptional upregulation and autophagy-derived amino acids. Autophagy. 2014;10:431–441. doi: 10.4161/auto.27344. [DOI] [PMC free article] [PubMed] [Google Scholar]
- Sanders MJ, Grondin PO, Hegarty BD, Snowden MA, Carling D. Investigating the mechanism for AMP activation of the AMP-activated protein kinase cascade. Biochemical Journal. 2007;403:139–148. doi: 10.1042/BJ20061520. [DOI] [PMC free article] [PubMed] [Google Scholar]
- Schnütgen F, Doerflinger N, Calléja C, Wendling O, Chambon P, Ghyselinck NB. A directional strategy for monitoring Cre-mediated recombination at the cellular level in the mouse. Nature Biotechnology. 2003;21:562–565. doi: 10.1038/nbt811. [DOI] [PubMed] [Google Scholar]
- Scott JW, Hawley SA, Green KA, Anis M, Stewart G, Scullion GA, Norman DG, Hardie DG. CBS domains form energy-sensing modules whose binding of adenosine ligands is disrupted by disease mutations. Journal of Clinical Investigation. 2004;113:274–284. doi: 10.1172/JCI19874. [DOI] [PMC free article] [PubMed] [Google Scholar]
- Song S, Ge Q, Wang J, Chen H, Tang S, Bi J, Li X, Xie Q, Huang X. TRIM-9 functions in the UNC-6/UNC-40 pathway to regulate ventral guidance. Journal of Genetics and Genomics. 2011;38:1–11. doi: 10.1016/j.jcg.2010.12.004. [DOI] [PubMed] [Google Scholar]
- Spasić MR, Callaerts P, Norga KK. Drosophila alicorn is a neuronal maintenance factor protecting against activity-induced retinal degeneration. Journal of Neuroscience. 2008;28:6419–6429. doi: 10.1523/JNEUROSCI.1646-08.2008. [DOI] [PMC free article] [PubMed] [Google Scholar]
- Tang W, Ehrlich I, Wolff SB, Michalski AM, Wölfl S, Hasan MT, Lüthi A, Sprengel R. Faithful expression of multiple proteins via 2A-peptide self-processing: a versatile and reliable method for manipulating brain circuits. Journal of Neuroscience. 2009;29:8621–8629. doi: 10.1523/JNEUROSCI.0359-09.2009. [DOI] [PMC free article] [PubMed] [Google Scholar]
- Tschäpe JA, Hammerschmied C, Mühlig-Versen M, Athenstaedt K, Daum G, Kretzschmar D. The neurodegeneration mutant löchrig interferes with cholesterol homeostasis and appl processing. The EMBO Journal. 2002;21:6367–6376. doi: 10.1093/emboj/cdf636. [DOI] [PMC free article] [PubMed] [Google Scholar]
- Urban E, Nagarkar-Jaiswal S, Lehner CF, Heidmann SK. The cohesin subunit Rad21 is required for synaptonemal complex maintenance, but not sister chromatid cohesion, during Drosophila female meiosis. PLoS Genetics. 2014;10:e1004540. doi: 10.1371/journal.pgen.1004540. [DOI] [PMC free article] [PubMed] [Google Scholar]
- Venken KJ, Schulze KL, Haelterman NA, Pan H, He Y, Evans-Holm M, Carlson JW, Levis RW, Spradling AC, Hoskins RA, Bellen HJ. MiMIC: a highly versatile transposon insertion resource for engineering Drosophila Melanogaster genes. Nature Methods. 2011;8:737–743. doi: 10.1038/nmeth.1662. [DOI] [PMC free article] [PubMed] [Google Scholar]
- Xue M, Atallah BV, Scanziani M. Equalizing excitation-inhibition ratios across visual cortical neurons. Nature. 2014;511:596–600. doi: 10.1038/nature13321. [DOI] [PMC free article] [PubMed] [Google Scholar]
- Xue Z, Wu M, Wen K, Ren M, Long L, Zhang X, Gao G. CRISPR/Cas9 mediates efficient conditional mutagenesis in Drosophila. G3&#58; Genes|Genomes|Genetics. 2014;4:2167–2173. doi: 10.1534/g3.114.014159. [DOI] [PMC free article] [PubMed] [Google Scholar]
- Yoon WH, Sandoval H, Nagarkar-Jaiswal S, Jaiswal M, Yamamoto S, Haelterman NA, Putluri N, Putluri V, Sreekumar A, Tos T, Aksoy A, Donti T, Graham BH, Ohno M, Nishi E, Hunter J, Muzny DM, Carmichael J, Shen J, Arboleda VA, Nelson SF, Wangler MF, Karaca E, Lupski JR, Bellen HJ. Loss of Nardilysin, a mitochondrial Co-chaperone for α-Ketoglutarate dehydrogenase, promotes mTORC1 activation and Neurodegeneration. Neuron. 2017;93:115–131. doi: 10.1016/j.neuron.2016.11.038. [DOI] [PMC free article] [PubMed] [Google Scholar]
- Zhang X, Koolhaas WH, Schnorrer F. A versatile two-step CRISPR- and RMCE-based strategy for efficient genome engineering in Drosophila. G3; Genes|Genomes|Genetics. 2014;4:2409–2418. doi: 10.1534/g3.114.013979. [DOI] [PMC free article] [PubMed] [Google Scholar]