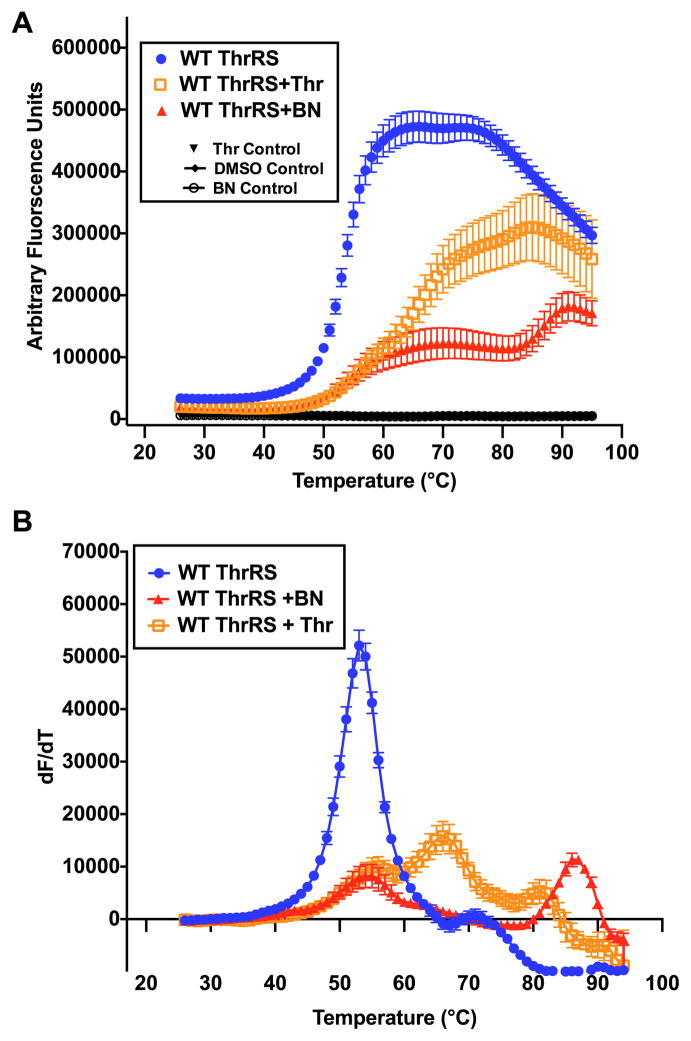
Fig. 6.
Evaluation of threonine and borrelidin binding by ThrRS (A) ThrRS (blue circles) fluorescence thermal melting data as a function of temperature shown with threonine binding (empty orange squares) and BN binding (filled red triangles) (B) Fluorescence data converted to first derivative plot. (For interpretation of the references to colour in this figure legend, the reader is referred to the web version of this article.)

