Abstract
We present an automated dielectrophoretic assisted cell sorting (DACS) device for dielectric characterization and isolation of neural cells. Dielectrophoretic (DEP) principles are often used to develop cell sorting techniques. Here we report the first statistically significant neuronal sorting using DACS to enrich neurons from a heterogeneous population of mouse derived neural stem/progenitor cells (NSPCs) and neurons. We also study the dielectric dispersions within a heterogeneous cell population using a Monte-Carlo (MC) simulation. This simulation model explains the trapping behavior of populations as a function of frequency and predicts sorting efficiencies. The platform consists of a DEP electrode array with three multiplexed trapping regions that can be independently activated at different frequencies. A novel microfluidic manifold enables cell sorting by trapping and collecting cells at discrete frequency bands rather than single frequencies. The device is used to first determine the percentage of cells trapped at these frequency bands. With this characterization and the MC simulation we choose the optimal parameters for neuronal sorting. Cell sorting experiments presented achieve a 1.4-fold neuronal enrichment as predicted by our model.
1 Introduction
In biology it is fundamental to be able to isolate different types of cells from a heterogeneous mixture to enable cell studies. An example where the need for cell sorting is apparent is neural stem cell research and technologies such as transplantation therapies1. Transplantation of unsorted and undifferentiated cells into injury sites might lead to uncontrolled outcomes such as astrogenic differentiation where neurogenic differentiation is needed or vice versa, or it might lead to tumor formation2. As a result these therapies require the isolation of a particular cell type from their more differentiated progeny.
The design of optimal sorting techniques requires the ability to discern differences in the targeted cells using a specific physiological traits. Traditional methods for cell sorting, such as fluorescence-activated cell sorting (FACS), are based on the existence of unique cell surface markers and the existence of labels that specifically bind to them. Unlike other stem cell fields, in neural stem cell research there is currently a limited amount of unique surface markers making cell sorting a challenging task3. The use of these cells in therapeutics also requires minimizing the number of processing steps and therefore label free separations are preferred.
A physiological trait potentially useful for cell sorting is the polarizability of the cell. In the presence of an electric field gradient, frequency dependent DEP forces arise due to the polarizability differences between a cell and the surrounding medium4. The use of this phenomena and the electrophysiological differences between cell types have previously been used for cell sorting using different strategies. These are often termed DEP-activated cell sorters (DACS)5,6. DACS takes advantage of the intrinsic electrophysiology of distinct cell types which manifest as differences in the polarizability of each of the cell components, i.e. cell membrane, cytoplasm and nuclei. DEP can therefore be utilized for sorting as a label free alternative that avoids the use of specific markers7–9.
Several groups have shown that differences in the DEP response are sufficient for cell separation by means of trapping10–12 or continuous flow deflection13–17. The use of DEP techniques for the particular case of stem cell separation has also been previously reported15,18 and discussed in a recent review19. Among these, our group has shown that mouse neural stem/progenitor cells (NSPCs) and their progeny are different in their DEP trapping efficiency20 and thus have the potential to be sorted or enriched by DEP. None of these, however, have shown successful separation of NSPCs from their differentiated progeny.
The electrical properties of the cells are frequency dependent and therefore the effective use of DEP for sorting relies on the knowledge of the dielectric spectra of each cell type. That is, knowing what the dielectric differences between cell types are, where in the frequency spectrum these are more apparent and whether they are sufficient for specific isolation of targeted cells. Indeed, previous studies have characterized the spectral DEP response of different cell types21–24. These measure the spectral response either as a population average or at a single cell level. Assuming all cells of a certain type are identical, one would expect to be able to separate populations with different averaged properties. In any real population, however, there is a heterogeneity in the dielectric properties of the cells. The extent to which distributions from two different populations overlap will therefore determine how efficient DACS can be.
Here we present an automated DACS device for the systematic characterization and isolation of cell subpopulations. The platform was used to achieve the first statistically significant neuronal enrichment from a mixture of mouse derived neural stem/progenitor cells (NSPCs) and neurons using DEP methods. The system is conceived as a tool to characterize and sort heterogeneous cell populations rather than analyze cells at the single cell level. We also present a study of the dispersion of the cell properties by means of a Monte Carlo (MC) simulation. This model explains the trapping behavior of heterogeneous populations across the frequency spectra. By using a novel multi-well approach we collect cells that trap at discrete frequency bands rather than single frequencies. With this and the MC simulation we can characterize the percentage of cells trapped at different frequencies and choose an appropriate frequency band for neuronal sorting. Once cell trapping characteristics are determined, neuronal enrichment of up to 1.4 fold is reported for the selected frequency band.
2 Materials and Methods
2.1 Device Fabrication
The microfluidic device was fabricated in poly(dimethyl) siloxane (PDMS) using common soft lithography techniques and bonded to a glass substrate patterned with metal electrodes. Photomasks used for contact photolithography steps were printed at 20000 dpi. Using electron-beam deposition a layer of 300 Å of titanium followed by a layer of 1000 Å of gold were deposited on a glass slide. A 5 μm sacrificial layer of positive photoresist (Shipley 1827, Shipley Co.) was spin-coated at 3500 rpm for 30 seconds and cured for 5 min at 95°C. An electrode pattern was exposed to UV light (0.24 J/cm2) and developed (MF319 developer, Shipley Co.). Electrodes were etched by dipping the glass slide in Au etchant (Potassium Iodide (KI) 1:4:4012/KI/H2O) for 45 seconds followed by a 10 second dip in Ti etchant (2% hydrofluoric acid (HF)).
The direction of flow was controlled with on chip pneumatically actuated valves25. Two layers of PDMS with molded features were used, one with patterned microfluidic channels and one with pneumatic actuation channels. Positive photoresist (AZ 4620, Clariant Inc.) was spin-coated twice at 1000 rpm for one minute to achieve a 25 μm layer on a 3 inch Si wafer. The photoresist was cured for 20 mins at 95 °C. The fluidic channel pattern was exposed using UV light (1.44 J/cm2) and developed (AZ400K developer, Clariant Inc.). The resulting mold was heated to 120° C for 45 min until the photoresist reflowed to achieve a semicircular profile for the channels.
A SU82050 mold was patterned with the actuation channels following the procedure provided by the manufacturer (Microchem). Both molds were exposed to (Tridecafluoro-1,1,2,2-tetrahydrooctyl) Trichlorosilane (Gelest, Inc) for 30 mins. A mixture of 20:1 PDMS (RTV 615 A & B, GE) was spin-coated at 1000 rpm for a minute to a total thickness of 100 μm on the wafer with the fluidic channels. A 5 mm thick mixture of 5:1 PDMS was poured onto the mold with the actuation features. Both wafers were degassed in vacuum for 30 mins and cured at 80°C for 60 mins. The actuation layer was pealed and aligned on top of the channels and both layers were left at 120°C for 24h for final bonding. The resulting device was pealed and inlets were punched. The PDMS and glass substrate with Ti-Au electrodes were plasma treated and permanently bonded to the PDMS structure.
2.2 Experimental Setup
The microfluidic device (figure 1) consists of three multiplexed DEP trapping regions along a main channel. Each of the three trapping regions has a set of independently addressable castellated electrodes. The main interdigitated stems of the electrodes are 50 μm wide and are 150 μm apart. Each stem has square protrusions of 50×50 μm spaced out so that an angle of 45° is formed from corner to corner (see figure 1 in ESI†). Each region is intersected by a dedicated perpendicular cell collection channel leading to three separate wells. An AC signal with an amplitude of 8 Vpp is applied to each set of electrodes at different frequencies with a function generator (33220A, Agilent Technologies). Each intersection can be isolated by closing surrounding pneumatic valves. An external source of air pressure at 10 psi is used as the pneumatic source and it is controlled via a pair of valves (LHDA0523112H Solenoid valve, The LEE Company) which are opened and closed through a DAQ interface (USB6008, National Instruments).
Fig. 1.
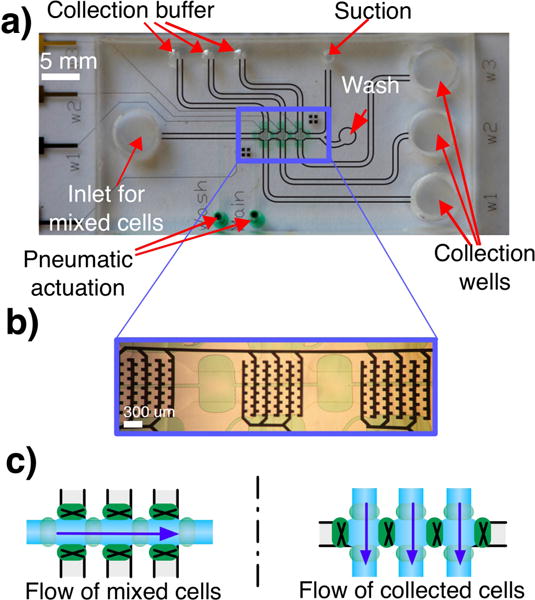
(a) PDMS-glass microfluidic device for DEP trapping. (b) Inset: The device has three trapping sites with castellated electrodes. Each site can be independently addressed. (c) The initial mixture of cells flows through all three trapping sites. The collection is done with three perpendicular flows after isolating each trapping zone by closing adjacent pneumatic valves (green).
Before each experiment the device was sterilized by flowing 70% ethanol through the channels followed by a wash with sterile ultra-pure water. To prevent cell adhesion to the device walls, a solution of 5% BSA was flowed for 5 min followed by a DEP buffer wash. Accessible chambers (one inlet and three outlets) of 5mm in diameter enabled loading and retrieval of cells using conventional methods such as pipetting. 50–80 μl of cells were initially loaded on the inlets and pulled from the waste outlet with a syringe pump (Pump 11 Pico Plus, Harvard Apparatus). Collection of the cells was done by flowing fresh DEP buffer through the collection channels. A washing step was performed with DEP buffer to eliminate non-trapped cells on the regions prior to collection. A Lab-VIEW program with a graphical user interface controlled the syringe pumps through a RS232 interface whereas the pneumatic valves and the function generators were controlled via a USB interface. The platform can be fully configured through the GUI allowing the setup of trapping cycle durations, washing and collection times, flow rates, and frequencies applied to each trapping chamber.
Videos of the trapping cycles were taken with a commercial camera at 60 frames per second (EOS Rebel T2i, Canon). These videos were used to determine the percentage of cells trapped at different frequencies and at different times. The total number of cells entering the trapping region during an experiment were manually counted in these videos. At the end of the video the number of cells trapped were also quantified. The percentage of cells trapped was calculated as the quotient of cells trapped over total number of cells entering the trapping region.
2.3 Cell Preparation
Mouse fetal-derived neural stem/progenitor cells (NSPCs) were isolated from cerebral cortical regions of wild-type CD1 mice at embryonic day 12.5 (E12.5) as described earlier20. NSPCs were grown as neurospheres in Dulbeccos modified Eagles medium, B27, N2, 1 mM sodium pyruvate, 2 mM glutamine, 1 mM N-acetylcysteine (Sigma-Aldrich, St. Louis, MO), 20 ng/ml epidermal growth factor (BD Biosciences, Bedford, MA), 10 ng/ml fibroblast growth factor (BD Biosciences, Bedford, MA), and 2 μg/ml heparin (Sigma-Aldrich, St. Louis, MO).
Neurons were derived from the same set of E12.5 mouse cortices as NSPCs using conditions described previously20. Briefly, the isolated cells were plated at 50,000 cells/ml on coverslips coated with Matrigel (BD Biosciences, Bedford, MA) in Eagle’s minimal essential medium, 9 g/ml insulin (Sigma-Aldrich, St. Louis, MO), 180 g/ml transferrin (Sigma-Aldrich, St. Louis, MO), 9 g/ml cell-culture tested BSA (Gibco, Rockville, MD), 29 g/ml putrescine (Sigma-Aldrich, St. Louis, MO), 23 ng/ml selenium (Sigma-Aldrich, St. Louis, MO), 18 ng/ml T3 (Calbiochem, San Diego, CA), 8.2 ng/ml hydrocortisone (Sigma-Aldrich, St. Louis, MO), 12 ng/ml progesterone (Sigma-Aldrich, St. Louis, MO), 10 ng/ml NGF (BD Biosciences, Bedford, MA), 2% horse serum, 5% FBS, and 1% penicillin/streptomycin. Neurons were cultured for 3–5 days prior to sorting.
For sorting experiments a 1:1 mixture of NSPCs and Neurons with a concentration of 106 cells/ml was used. NSPCs were dissociated using NeuroCult dissociation buffer (Stem Cell Technologies, Vancouver, British Columbia, Canada) and resuspended in DEP buffer [8.5 % sucrose [wt/vol], 0.3 % glucose [wt/vol], and adjust the conductivity to 110 μS/cm using RPMI1640] to form a single cell suspension. Neurons were dissociated using 0.05% trypsin-EDTA, neutralized with DMEM with 10% FBS, and resuspended into DEP buffer.
To determine the sorting efficiency, sorted samples were grown on laminin coated coverslips for 24 hours to allow neurite outgrowth prior to fixing the sample. Immunocyto-chemistry was used as previously described20 and used with the following antibodies: anti-MAP2 (microtubule-associated protein 2) (HM2, Sigma) monoclonal. The secondary antibodies were donkey anti-mouse Alexa-555, all 1:100 (Molecular Probes/Invitrogen, Carlsbad, CA). A nuclei count was perfomed using Hoechst staining. Percentages of neurons were calculated from several images of randomly selected fields for each sorted sample. Each sample contained an average of at least 800 cells.
3 Results and Discussion
3.1 Theory
Cells flowing through a gradient of an alternating electric field in a low conductivity medium experience a combination of hydrodynamic forces and DEP forces. The time average DEP force is given by4
| (1) |
where, is the rms value of the applied electric field, we assume a spherical cell of radius r, and KCM (ω) is the Clausius-Mossotti (CM) factor. The CM factor can be determined by calculating the cellular effective permittivity given by the single shell model26–28. In this model the cell membrane and cytoplasm have a given geometry, permittivity and conductivity. In terms of the membrane these can be quantified as a capacitance per unit area, or specific capacitance Cmem, and a conductance per unit area, or specific conductance Gmem.
Trapping a cell in a configuration of planar interdigitated electrodes as used here requires the CM factor to be positive so the cell can experience a downward force. The frequencies at which the CM factor changes in sign are commonly known as crossover frequencies . At low frequencies in a low conductivity medium, viable mammalian cells transition from negative to positive CM values. This crossover frequency can be expressed as a function of the Cmem, Gmem, r, and medium conductivity (σm) as27,29
| (2) |
which, assuming a negligible membrane conductance, is usually approximated by
| (3) |
The crossover frequency and Cmem are often given as way to characterize the dielectric properties of cell populations in the absence of flow. In the presence of flow it is possible to define a threshold frequency defined as the frequency at which the DEP force and the hydrodynamic force are balanced and the cell remains trapped.
The hydrodynamic force experienced by a spherical particle is given by the Stokes drag force.
| (4) |
where ν is the fluid viscosity and is the relative speed between the cell and the fluid. The relative speed will in turn depend on the cell’s vertical position in the channel. Under a constant flow rate Q in a channel of width w and height h, the velocity presents a parabolic profile. Given these forces it is possible to define a threshold a for the CM factor above which a cell remains trapped to the electrodes.
| (5) |
The threshold α depends on the flow rate of the medium and the position of the cell since both and are a function of . From the definition of this trapping threshold it is possible to define a threshold frequency as
| (6) |
if we assume the conductance of the cell membrane is negligible, we can write
| (7) |
Note that for Q = 0, α = 0 and equations 6 and 7 result in equations 2 and 3. Using equation 7 and given a cell with specific geometry and membrane properties we can determine its threshold frequency. For a heterogeneous population of cells, each cell will have different size and dielectric properties. Due to this dispersion the percentage of cells that trap up to a given frequency (trapping curve, TC) is expected to progressively increase. Different cell populations have different dispersions resulting in different TCs. This constitutes the basic principle that enables cell sorting by means of DEP trapping.
If the distributions of the cell properties are known, we can determine the number of cells that start to trap at a given frequency. By generating a set of cells with different cell radii and membrane properties, it is possible to run a Monte-Carlo (MC) simulation and calculate the probability density function of having a cell with a certain threshold frequency. The corresponding cumulative distribution function will be the TC of the simulated population.
Using an analytic expression30 for the electric field in interdigitated electrodes it is possible to calculate the value of a for each cell and therefore the value of for different cells. Considering a flow rate of 2 μl/min in a channel of width 500 μm and height 40 μm, we calculated the threshold frequencies for mouse NSPCs at embryonic day 12.5 (E12.5). The size of a heterogeneous population of NSPCs was observed to be normally distributed with an average radius of 5.8μm and standard deviation of 1.2μm. The average Cmem of the population was observed to be 8.85μF/cm2. This average capacitance was measured using a DEP-Well system as described in detail by Hoettges et al.31. Assuming that all cells in each population had a Cmem equal to the reported average value, we calculated the threshold frequency of 20000 cells with random sizes following the measured distribution. The resulting TC was steeper than the one obtained empirically which indicates that a distribution of cell size alone is not enough to account for the observed TC (figure 2).
Fig. 2.
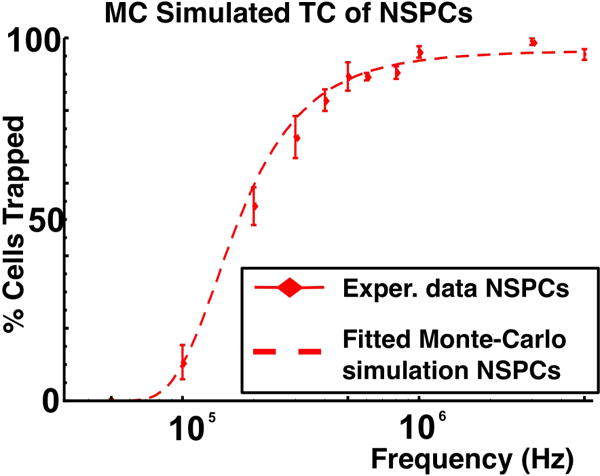
Experimental trapping curve (data points) for straight interdigitated electrodes and fitted Monte-Carlo simulation (dotted lines) for mouse NSPCs at embryonic day 12.5. The fitted curve is calculated as the cumulative distribution function of the threshold frequency distribution.
In order to introduce more sources of heterogeneity to the simulated population, the TC resulting from the MC simulation was considered to be a function of the cell size and Cmem averages and their corresponding standard deviations (figure 3). This function was then fitted to the experimental results as seen in figure 2. This indicates that both a distribution in cell size and Cmem are needed to explain the observed TC.
Fig. 3.
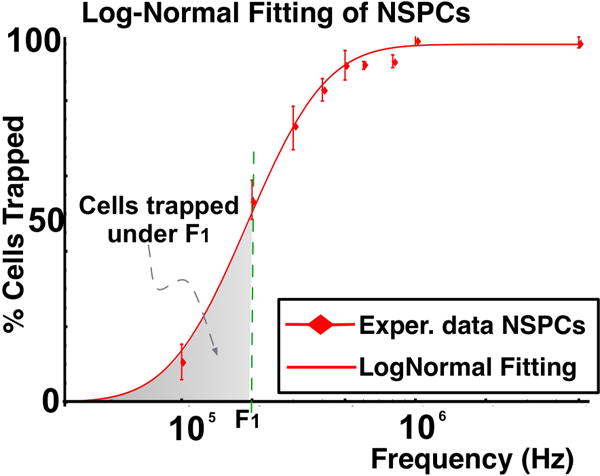
Log-Normal distribution fitting of experimental data for mouse NSPCs at embryonic day 12.5. The mode and skewness of the distribution can be used to quantify the dielectric behavior and heterogeneity of a population
The resulting distribution of threshold frequencies does not follow a normal distribution. Indeed, equation 7 is a non-linear function of random variables (r and Cmem). We can therefore approximate the resulting distribution to be log-normal32
| (8) |
where in this case x = f/(1Hz). The cumulative distribution function (CDF) of this distribution corresponds to the TC and can be written as
| (9) |
Fitting this CDF to the TCs obtained in experiments it was possible to determine values of μ = 12.22 and σ = 0.71 for a population of NSPCs (see figure 3). The resulting log-normal distribution can be characterized by two values, the mode and the skewness of the distribution. The mode is the most probable effective crossover frequency and can be taken as an analogous to the commonly used crossover frequency.
3.2 Cell Separation with DACS
The DACS platform consists of an array of three multiplexed trapping sites independently addressable. The platform is fully automated and cells can be easily loaded and recovered (for an example of the device operation see the electronic supplementary information video†).
Since the TCs are monotonically increasing in the frequency ranges under study, it is possible to assume that trapping cells at a given frequency F1 will trap all cells that would have trapped at any frequency f ≤ F1 (see figure 3). Taking advantage of this the platform can perform three types of experiments to systematically characterize or separate populations of cells into different frequency bands. The device can be used as either a low-pass trap or a band-pass trap. In the low-pass trap configuration all three regions are set at the same trapping frequency F1 (see figure 4a). After a certain trapping time, collection of the cells is done by turning off the DEP force. This results in the collection of cells that trap at frequencies f ≤ F1.
Fig. 4.
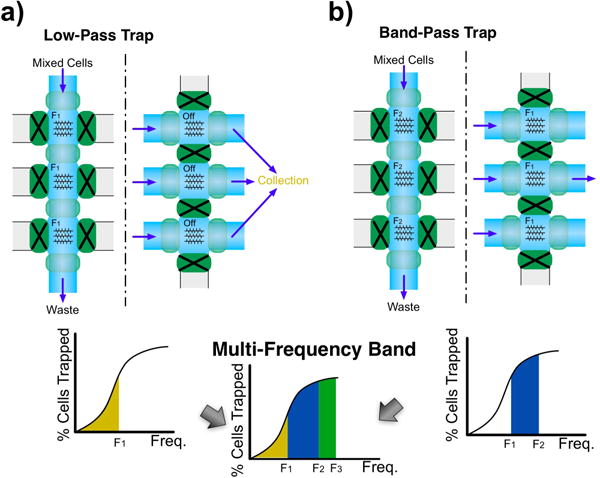
a) Low-pass trap configuration. The trapping frequency is set at F1 in all trapping sites and collection is done with DEP field off. b) Band-pass trap configuration. Trapping at F2 and collecting cells while DEP frequency F1 is on yields cells that would trap between these frequencies. A multi-frequency band pass configuration of increasing frequencies F1, F2 and F3 can be conceived as a combination of a) and b)
For the band-pass trap configuration the three regions are also set at a target frequency F2. After washing away all nonspecific cells all valves are closed to isolate all three chambers. The DEP force is then turned off for 5 seconds to allow depolarization of the cells and it is then turned on at frequency F1. Collection is then done while maintaining F1 on, resulting in the collection of cells that trap at frequencies F2 ≥ f > F1 (see figure 4b). A third type of experiment can be conceived as a combination of the previous two and allows for multi-frequency band operation where initially each trap is set at sequentially increasing frequencies F1, F2 and F3 where F3 > F2 > F1. After nonspecific cells are washed away, valves are closed to isolate all chambers and AC fields are turned off for cell depolarization. Before cell retrieval the second and third traps are activated using frequencies F1 and F2. This results in the collection of cells that trap at f ≤ F1 in outlet 1, F1 < f ≤ F2 in outlet 2 and F2 < f ≤ F3 in the last outlet.
When trying to use differences in the TC of two populations for sorting, it is important to consider that during a trapping cycle, cells are being trapped and therefore they change the DEP force distribution experienced by the subsequent cells. These changes vary the trapping conditions throughout the duration of a trapping cycle. Since this is an automated platform it is important to determine the optimal timing conditions for each type of experiment.
The sorting process consists of repeating a cycle of three steps; cell trapping, washing and cell collection. Both the washing and collection steps depend only on the geometry of the channels and the volume of liquid that needs to be displaced to complete the operation. In all experiments this time is similar and is considered a constant overhead for the trapping cycle. The number of cycles and the duration of each trapping step however needs to be chosen based on required sorted cell quantity, throughput and overall experiment duration.
The optimal duration of the cell trapping step, however, depends on the saturation of each trapping site and the mentioned evolution of the trapping curves for each targeted cell type. Figure 5 shows how these aspects evolve for NSPCs for a continued trapping event of two minutes. Figure 5a shows the cumulative number of trapped NSPCs on a single trap for different frequencies and figure 5b shows how the percentage of trapped cells declines over time. It is important to note that the saturation of the traps depends on the initial cell density and flow rate. All experiments were done using a similar density of approximately 106 cells per ml and therefore no cell density dependance was considered in this characterization. From these results we can conclude that at this cell density the number of trapped cells increases during the entire two minute interval but no saturation is reached since the number of cells trapped continue to increase. The percentage of cells trapped however does decrease with time and this effect is more noticeable for higher frequencies. In order to avoid a decreased percentage of trapped cells we chose trapping steps of 30–40 seconds.
Fig. 5.
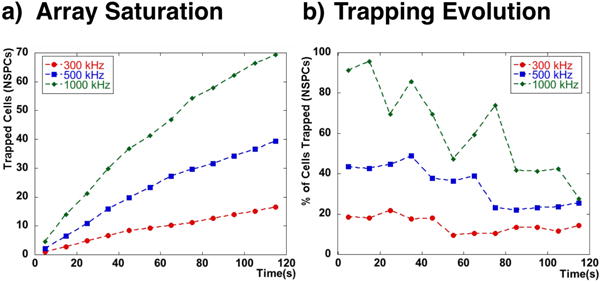
a) The number of trapped NSPCs over time in a trapping site grows asymptotically towards a maximum number of trapped cells. b) The percentage of NSPCs trapped declines over time due to the filling of the trapping sites.
We designed the DACS device with castellated interdigitated electrodes. This configuration is preferred to straight electrodes since in the band-pass trap configuration DEP forces parallel to the flow must be similar in both perpendicular directions of the initial and collection flows. It is therefore desirable to have a force distribution with some degree of symmetry (see figure 1 in ESI†). In this configuration cells trap along the edges of the protrusions in the castellated electrodes.
Figure 6 shows two sequences where cells are trapped in a low-pass trap configuration (6a) and a band-pass trap configuration (6b). The first sequence shows cells being trapped at frequency F1 with a horizontal flow. When the perpendicular collection flow is activated the DEP force is off and all cells are collected. On the second sequence however cells are initially trapped at F2, which also traps cells that would trap at f ≤ F1 (false color green in 6b). When the perpendicular collection flow is activated only those cells that trap at F1 < f ≤ F2 (non colored cells in 6b) flow to the collection wells while cells that trap at F1 (false color green in 6b) remain in the trapping zone.
Fig. 6.
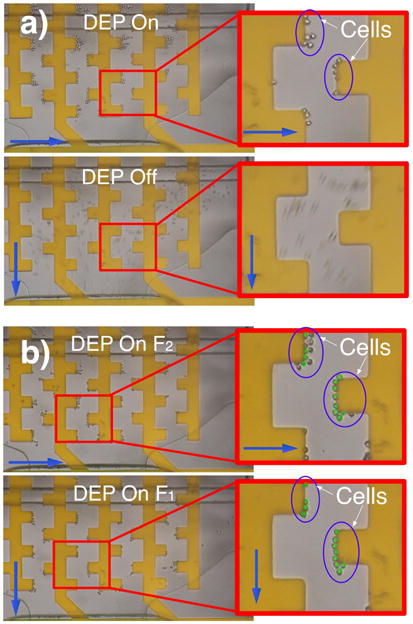
(a) Sequence showing low pass experiment. Cells are trapped at F1 and the DEP force is off when collection is activated. (b) Sequence showing a band pass experiment. Cells are first trapped at F2 trapping also cells that would trap at F1 (false color green). During collection DEP at F1 is active allowing only cells that trap between F1 and F2 to be collected (only false color green cells remain).
3.3 Band Selection and Sorting
Using a low-pass configuration it was possible to get the TC of both neurons and NSPCs in a castellated configuration (see figure 7a). The difference in the TC for both cell types is clear with a shift towards higher frequencies for neurons. This indicated that sorting of these two populations by cell trapping with DEP is possible. These TCs were fitted to a log-normal distribution as discussed before. From the resulting fit it was possible to derive fitted distributions of threshold frequencies for both populations (see figure 7b). These curves were used to estimate the enrichment and fraction of cells recovered by calculating the area under the curves for different frequency bands.
Fig. 7.
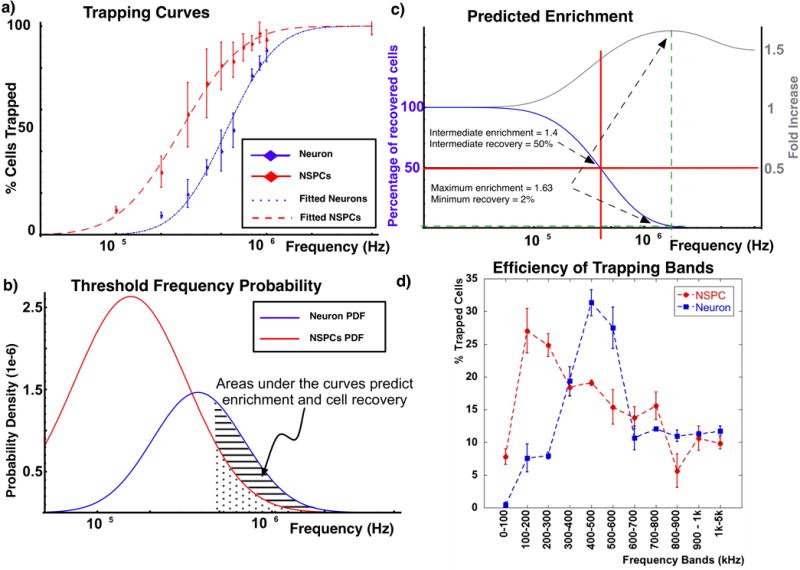
a) Trapping curves of neurons and NSPCs increase with the applied frequency, reaching maximum values at frequencies above 1 MHz. Both TCs can be fitted to a log-normal distribution. b) The probability density function (PDF) of the threshold frequency can be derived from the fitted trapping curves. c) Integrating under the areas of both PDFs it is possible to estimate the number of cells collected and the resulting enrichment. d) Trapping neurons and NSPCs at discrete frequency bands shows that there is an optimal frequency band where the number of captured cells is maximized, in this case the 100–200kHz band. Neurons however show a maximum for the frequency band of 400–500kHz.
For a band with an upper frequency of 5 MHz we calculated the different enrichments and recovery efficiencies as a function of the lower frequency. Figure 7c is a plot of both equations and shows that maximum enrichment of 1.63 fold increase is achieved if a frequency band of 1.73–5 MHz is used. The cell recovery in this case would be of only 2% which would yield a low number of cells for further processing and experiments. A frequency band such a 400 kHz-5 MHz achieves a compromise between number of recovered cells and theoretical enrichment. In particular theoretically it would allow an enrichment of 1.4-fold with 50% cell recovery.
Using the platform in a band-pass trap configuration for each cell type separately it was possible to see if different frequency bands showed trapping percentages in accordance with the curves in figure 7b. Figure 7d shows the results using NSPCs and neurons and bands 100 kHz wide from 0 to 1 MHz and a final high frequency band from 1 MHz to 5 MHz. We can see that the percentage of cells collected for each frequency band increases with frequency to a maximum to decay later at higher frequencies. This is consistent with the distribution curves seen in figure 7b since the maximum of those distributions fall within the maxima obtained for each frequency band.
These results for the TC of NSPCs and neurons suggest that neurons have a higher trapping efficiency at high frequencies. In the band-pass trap configuration this is reflected as a maximum trapping of NSPCs located around the band of 100–200 kHz while for neurons the maximum is around the 400–500 kHz band. These two maximums and the predicted enrichments from the fitted distributions suggest that it is possible to use the platform in a multi-band-pass trap for sorting a mixed population of NSPCs and neurons where a band trapping at 400 kHz-5 MHz would preferentially trap neurons and a trap at 200 kHz or lower would preferentially trap NSPCs.
A 1:1 mixture of NSPCs and neurons was used for sorting purposes using frequency bands of 0–150 kHz in the first trap and 400–5000 kHz in a subsequent trap. A third frequency band of 0–5000 kHz was used independently as a positive control where all cells were expected to trap. With this configuration the first site trapped preferentially NSPCs allowing for a population with lower NSPC concentration to move onto the next site where neurons will preferentially trap.
Figure 8 shows the fold increase in percentage of neurons with respect to the initial mixed population. There is a significant difference (p<0.05) in both the lower and higher frequency bands with respect to the initial mixture (see ESI for detailed cell counts†). As expected, no significant difference was observed between the control at 0–5000 kHz and the original mixed population. In particular a ≈0.6 decrease was seen for the band of 0–150 kHz and a ≈1.4 fold increase in the number of neurons was observed for the band of 400–5000 kHz which matches the predicted values of our model.
Fig. 8.
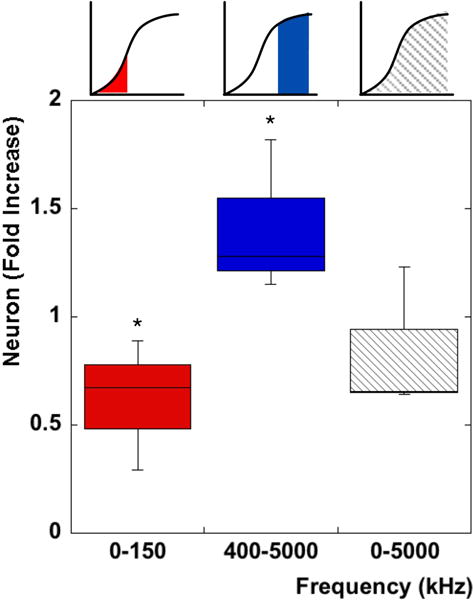
Fold increase of Neurons compared to the initial mixed population for different frequency bands. A significant increase (p<0.05) in Neurons is observed in the higher frequency band while a significant decrease is observed at the lower frequency band. A low pass band at 5 MHz does not show any significant difference from the initial mixture as expected.
4 Conclusions
We show the ability of an automated DACS system to characterize and sort heterogeneous cell populations. In particular the platform can be used to discretize the frequency spectra by trapping as a low-pass trap or a band-pass trap or a combined multi-band-pass trap for cell sorting.
Monte Carlo simulations of the DEP trapping of heterogeneous populations showed that the shape of the observed TC is due to the statistical distributions of cell size and membrane capacitance. We were able to simulate a heterogeneous population of cells with normally distributed sizes as well as membrane capacitances. The combination of these normally distributed variables was used to define a lognormal distribution of threshold frequencies. This distribution was fitted to experimental TCs from NSPCs and neurons. The resulting fitted distributions were used to determine expected enrichment and cell recovery for a given frequency band.
The ability of the platform to trap cells in discrete frequency bands in conjunction with the model allowed us to choose a frequency band of 400 kHz - 5 MHz for neuronal sorting. With this band we were able to achieve the predicted 1.4-fold enrichment of neurons. Even though the platform and model was demonstrated for a particular set of cells, following the same procedure it would be possible to determine the TC of other cell types to quantify their heterogeneity, predict enrichment efficiencies and choose optimal frequencies for DEP sorting in similar DACS systems.
Supplementary Material
Acknowledgments
This work was supported in part by CIRM-Novel Tools and Technologies (RT1-01074), 2009–2011, the CIRM training grant II (TG2-01152) and by Grant Number UL1 RR031985 from the National Center for Research Resources (NCRR), a component of the National Institutes of Health (NIH) and the NIH Roadmap for Medical Research. We would also like to thank Amanda Dickson for her help with dissections of the CD1 mice.
Footnotes
Electronic Supplementary Information (ESI) available: [details of any supplementary information available should be included here]. See DOI: 10.1039/b000000x/
References
- 1.Gage F. Science. 2000;287:1433. doi: 10.1126/science.287.5457.1433. [DOI] [PubMed] [Google Scholar]
- 2.Amariglio N, Hirshberg A, Scheithauer BW, Cohen Y, Loewenthal R, Trakhtenbrot L, Paz N, Koren-Michowitz M, Waldman D, Leider-Trejo L, Toren A, Constantini S, Rechavi G. PLoS Medicine. 2009;6:0221–0231. doi: 10.1371/journal.pmed.1000029. [DOI] [PMC free article] [PubMed] [Google Scholar]
- 3.Reekmans K, Praet J, Daans J, Reumers V, Pauwels P, Linden A, Berneman ZN, Ponsaerts P. Stem Cell Reviews and Reports. 2011;7:1–17. doi: 10.1007/s12015-011-9266-2. [DOI] [PubMed] [Google Scholar]
- 4.Voldman J. Annual Review of Biomedical Engineering. 2006;8:425–454. doi: 10.1146/annurev.bioeng.8.061505.095739. [DOI] [PubMed] [Google Scholar]
- 5.Hu X, Bessette PH, Qian J, Meinhart CD, Daugherty PS, Soh HT. Proceedings Of The National Academy Of Sciences Of The United States Of America. 2005;102:15757–15761. doi: 10.1073/pnas.0507719102. [DOI] [PMC free article] [PubMed] [Google Scholar]
- 6.Khoshmanesh K, Zhang C, Tovar-Lopez FJ, Nahavandi S, Baratchi S, Mitchell A, Kalantar-Zadeh K. Microfluidics and Nanofluidics. 2010;9:411–426. [Google Scholar]
- 7.An J, Lee J, Lee SH, Park J, Kim B. Analytical And Bioanalytical Chemistry. 2009;394:801–809. doi: 10.1007/s00216-009-2743-7. [DOI] [PubMed] [Google Scholar]
- 8.Kim U, Qian J, Kenrick SA, Daugherty PS, Soh HT. Analytical Chemistry. 2008;80:8656–8661. doi: 10.1021/ac8015938. [DOI] [PMC free article] [PubMed] [Google Scholar]
- 9.Markx GH, Pethig R. Biotechnology and bioengineering. 1995;45:337–343. doi: 10.1002/bit.260450408. [DOI] [PubMed] [Google Scholar]
- 10.Pethig R, Bressler V, Carswell-Crumpton C, Chen Y, Foster-Haje L, Garcia-Ojeda M, Lee R, Lock G, Talary M, Tate K. Electrophoresis. 2002;23:2057–2063. doi: 10.1002/1522-2683(200207)23:13<2057::AID-ELPS2057>3.0.CO;2-X. [DOI] [PubMed] [Google Scholar]
- 11.Prasad S, Zhang X, Yang M, Ni Y, Parpura V, Ozkan C, Ozkan M. Journal of neuroscience methods. 2004;135:79–88. doi: 10.1016/j.jneumeth.2003.12.007. [DOI] [PubMed] [Google Scholar]
- 12.Thomas RS, Morgan H, Green NG. Lab On A Chip. 2009;9:1534–1540. doi: 10.1039/b819267g. [DOI] [PubMed] [Google Scholar]
- 13.Wang L, Lu J, Marchenko S, Monuki E, Flanagan L, Lee A. Electrophoresis. 2009;30:782–791. doi: 10.1002/elps.200800637. [DOI] [PubMed] [Google Scholar]
- 14.Valero A, Braschler T, Renaud P. Lab On A Chip. 2010;10:2216. doi: 10.1039/c003982a. [DOI] [PubMed] [Google Scholar]
- 15.Vykoukal J, Vykoukal D, Freyberg S, Alt E, Gascoyne P. Lab On A Chip. 2008;8:1386. doi: 10.1039/b717043b. [DOI] [PMC free article] [PubMed] [Google Scholar]
- 16.Braschler T, Demierre N, Nascimento E, Silva T, Oliva AG, Reanaud P. Lab On A Chip. 2008;8:280. doi: 10.1039/b710303d. [DOI] [PubMed] [Google Scholar]
- 17.Vahey MD, Voldman J. Analytical Chemistry. 2008;80:3135–3143. doi: 10.1021/ac7020568. [DOI] [PubMed] [Google Scholar]
- 18.Talary MS, Mills KI, Hoy T, Burnett AK, Pethig R. Medical & Biological Engineering & Computing. 1995;33:235–237. doi: 10.1007/BF02523050. [DOI] [PubMed] [Google Scholar]
- 19.Pethig R, Menachery A, Pells S, de Sousa P. Journal of Biomedicine and Biotechnology. 2010;2010:1–7. doi: 10.1155/2010/182581. [DOI] [PMC free article] [PubMed] [Google Scholar]
- 20.Flanagan LA, Lu J, Wang L, Marchenko S, Jeon N, Lee AP, Monuki E. Stem Cells. 2008;26:656–665. doi: 10.1634/stemcells.2007-0810. [DOI] [PubMed] [Google Scholar]
- 21.Broche L, Labeed F, Hughes M. Physics in medicine and biology. 2005;50:2267–2274. doi: 10.1088/0031-9155/50/10/006. [DOI] [PubMed] [Google Scholar]
- 22.Goater A, Pethig R. Parasitology. 1999;117:177–189. doi: 10.1017/s0031182099004114. [DOI] [PubMed] [Google Scholar]
- 23.Foster K, Sauer F. Biophysical journal. 1992;63:180–190. doi: 10.1016/S0006-3495(92)81588-6. [DOI] [PMC free article] [PubMed] [Google Scholar]
- 24.Jones T, Washizu M. Journal of electrostatics. 1996;37:121–134. [Google Scholar]
- 25.Unger M, Chou H, Thorsen T, Scherer A, Quake SR. Science. 2000;288:113. doi: 10.1126/science.288.5463.113. [DOI] [PubMed] [Google Scholar]
- 26.Irimajiri A, Hanai T, Inouye A. Journal of theoretical biology. 1979;78:251–269. doi: 10.1016/0022-5193(79)90268-6. [DOI] [PubMed] [Google Scholar]
- 27.Gimsa J, Marszalek P, Loewe U, Tsong TY. Biophysical journal. 1991;60:749–760. doi: 10.1016/S0006-3495(91)82109-9. [DOI] [PMC free article] [PubMed] [Google Scholar]
- 28.Huang Y, Holzel R, Pethig R, Wang XB. Physics in medicine and biology. 1992;37:1499–1517. doi: 10.1088/0031-9155/37/7/003. [DOI] [PubMed] [Google Scholar]
- 29.Pethig R, Jakubek LM, Sanger RH, Heart E, Corson ED, Smith PJS. IEE Proceedings - Nanobiotechnology. 2005;152:189. doi: 10.1049/ip-nbt:20050040. [DOI] [PubMed] [Google Scholar]
- 30.Morgan H, Izquierdo A, Bakewell D, Green N, Ramos A. Journal of Physics D: Applied Physics. 2001;34:1553–1561. [Google Scholar]
- 31.Hoettges KF, Hübner Y, Broche LM, Ogin SL, Kass GEN, Hughes MP. Analytical Chemistry. 2008;80:2063–2068. doi: 10.1021/ac702083g. [DOI] [PubMed] [Google Scholar]
- 32.Limpert E, Stahel W, Abbt M. Bioscience. 2001;51:341–352. [Google Scholar]
Associated Data
This section collects any data citations, data availability statements, or supplementary materials included in this article.


