

Abstract
Prolificacy is a desirable trait for genetic improvement of sheep flocks, since it holds the potential to improve productivity. Animals carrying single-nucleotide polymorphisms (SNPs) in genes associated with this trait can be identified and employed to increase prolificacy in flocks. In this study, we report a diagnostic method based on quantitative PCR and high-resolution melting curves to detect different SNPs in the prolificacy-associated gene growth differentiation factor 9 (GDF9). The diagnostic method was validated using artificial sequences representing known SNPs in GDF9, then applied to a real flock comprising four breeds and admixed animals (n = 306). Five different SNPs were identified in this flock, as was a low or null frequency of occurrence of SNPs positively associated with prolificacy. This indicates a need to implement a breeding strategy for recovering or reintroducing such SNPs. Our method provides a genotyping strategy for identifying individuals with SNPs of interest for prolificacy, which will help producers plan a breeding strategy for this trait. This method can be adapted and expanded for the diagnosis of other traits of interest.
Electronic supplementary material
The online version of this article (doi:10.1007/s13205-017-0837-z) contains supplementary material, which is available to authorized users.
Keywords: Genotyping, Genomic DNA, Animal breeding, Fertility
Introduction
Flock management is integral to the economic sustainability of sheep production. The main characteristics that have the most effect on offspring number and success are maternal ability, fertility, and prolificacy (Abdoli et al. 2016). For the latter two, various investigators have reported positive molecular markers (Davis 2005; Kolosov et al. 2015). Given that these characteristics have low heritability in the field, due to underestimation of animal genetics (Veerkamp and Beerda 2007; Pan et al. 2015; Abdoli et al. 2016), the development of diagnostic protocols for the early detection of desirables genotypes may allow the implementation of planned breeding strategies and lead to increases of multiple births and production rates (McNatty et al. 2004; Kumar et al. 2006; Moghadaszadeh et al. 2015).
Three fecundity genes have been identified in the sheep, namely, bone morphogenetic protein receptor type 1B (BMPR1B; or activin-like kinase 6, ALK6) known as FecB on chromosome 6, bone morphogenetic protein 15 (BMP15) known as FecX on chromosome X, and growth differentiation factor 9 (GDF9) known as FecG on chromosome 5 (Abdoli et al. 2013, 2016). These genes produce proteins participating in processes related to ovulation rate and offspring number (Pramod et al. 2013; Moghadaszadeh et al. 2015).
Single-nucleotide polymorphisms (SNPs) on GDF9 have been associated with improved prolificacy in a number of breeds (Hanrahan et al. 2004; Chu et al. 2011; Paz et al. 2014). Although it is unclear how the amino acid changes coded in these SNPs influence the function of GDF9, they can be used to identify the individuals with most genetic potential for prolificacy (Palmer et al. 2006; Mullen and Hanrahan 2014).
Various molecular techniques have been used to detect SNPs, with the most often reported based on polymerase chain reaction (PCR) followed by digestion with restriction enzymes, electrophoretic separation (RFLP) and confirmation by sequencing (Hanrahan et al. 2004; Polley et al. 2010; Khodabakhshzadeh et al. 2016). However, these procedures are time-consuming, require three different sequential processes, and can be costly for large flock diagnostics.
Recently, the development of DNA-intercalating chemicals, such as SYBR-green and EVA-green, has led to the extensive development of different quantitative PCR (qPCR)-based techniques (Schmittgen and Livak 2008). In the area of diagnostics, the use of high-resolution melting curves (HRM) after qPCR has proved successful for a quick and cost-effective detection of SNPs on human, animal, and plant research (Vossen et al. 2009; Yao-Jing et al. 2011; Meistertzheim et al. 2012; Simko 2016). Briefly, these HRM curves are acquired when short DNA amplicons (<90 bp) obtained with primers flanking the SNPs of interest are heated in small but constant temperature intervals until they are denatured, at which point the intercalating chemical is released, sending less fluorescent signal to a detector and plotting this decrease against the temperature increase (Reed et al. 2007). Amplicons from different individuals with sequence changes of even only one base will release the intercalating chemicals at a different temperature, allowing its detection, comparison with synthetic controls and assignment to a genetic group (Vossen et al. 2009). Most modern qPCR machines have such short and finely controlled temperature-ramping features (0.01–0.2 °C, named, therefore, high resolution) and software to perform HRM genotyping (Simko 2016).
Given the importance of gene polymorphism determination in farm animals breeding (Javanmard et al. 2008; Mohammadi et al. 2009; Mohammadabadi et al. 2010; Ruzina et al. 2010; Shamsalddini et al. 2016), the aim of study was to report the design, validation, and implementation of a qPCR-HRM protocol to perform large-scale diagnostic (>260 individuals) of SNPs and allele variants for GDF9 in Mexican sheep flocks to offer a quick and high-throughput tool that detects elite animals for future breeding programs.
Materials and methods
Design and qPCR-HRM test of control and primer oligonucleotide sequences
The sequence for sheep GDF9 was downloaded from the National Center for Biotechnology Information (NCBI; Accession No. AF078545.2) and used to design for each SNP, two 80-bp single-strand synthetic DNA molecule, one incorporating the base change of the SNP (positive synthetic) and the other, the wild-type (WT) sequence (negative synthetic). DNA oligonucleotides flanking the SNP were designed to amplify by qPCR (labeled FS and RS; Supplemental Table 1, Supplemental Fig. 1). Primer parameters (40–60% GC, 20–25 b in length, and 58–60 °C Tm, amplicon <100 pb) and dimer–dimer exclusion were calculated with OligoCalc (http://biotools.nubic.northwestern.edu/OligoCalc.html; Kibbe 2007). The synthetic sequence labeled PSG simulated a positive homozygous, NSS1 simulated a WT homozygous, and an equimolar mixture of both simulated a heterozygous. All DNA molecules were synthesized by Macrogen (Seoul, Korea). The selected SNPs (Supplemental Fig. 1) were G1 (260, G/A, R87H), G4 (721, G/A, E241K), G6 (994, G/A, V332I), and G7 (1111, G/A, V371M).
A Piko Real 96 thermocycler (Thermo Scientific) was employed to perform qPCR-HRM, following a program of 95 °C for 15 s, 60 °C for 30 s, and 72 °C 30 s, for 40 cycles, followed by an HRM analysis with ramping by 0.2 °C from 65 to 95 °C. Two different pre-dyed master mixes were compared, EVA-Green containing Luminaris Color HRM Master Mix (Thermo Scientific K1031BID) and SYBR-Green Maxima qPCR Master Mix 2X (Thermo Scientific, K0252). Both master mixes were used following the manufacturers’ instructions. Synthetic SNP sequences were tested using duplicates in an operational range from 10 µM to log dilutions up to 1:100,000 (efficiency = 100%) to determine that 1:10,000 amplified at the same cycle threshold as sheep genomic DNA (gDNA). To detect allelic differences, triplicate synthetic controls were analyzed by qPCR-HRM, and normalized melting curves (NMC) and differential curves (DC) were obtained using the HRM Tool included in the integrated software (Piko 2.1).
Animals and DNA extraction
Blood samples were obtained from 306 sheep (18–36 months) at a facility located in the Papaloapan River Basin (Oaxaca, México). Katahdin (n = 163), Dorper (n = 36), Black belly (n = 17), Pelibuey (n = 35) breeds, and admixed individuals (n = 55) were registered according to phenotypic characteristics of each breed (Supplemental Fig. 2). Jugular puncture was used to extract blood into 10 ml Vacutainer tubes with EDTA; these were stored at −20 °C prior to DNA extraction. DNA was purified using a Vivantis GF-1 kit following manufacturer instructions (Vivantis, GF-BD-050) and samples were stored at −20 °C.
qPCR-HRM testing of sheep samples
Sample gDNA concentration was quantified using a Nanodrop 2000 spectrophotometer (Thermo Scientific), normalized to 12 ng/µl and used for qPCR in a final concentration of 60 pg/µl. Only Maxima SYBR-Green qPCR Master Mix 2X was used at this step, since no differences with EVA-Green were detected (see “Results and discussion”). qPCR-HRM of the GDF9 gene was performed and analyzed as for synthetic samples described above.
DNA sequencing
Sheep samples diagnosed for all SNPs in GDF9 (n = 16) were selected and directly sequenced using 8 ng/µl gDNA with the sequencing oligonucleotides that amplify 708 and 799 bp for GDF9 exon 1 and exon 2, respectively (labeled GDF91 or GDF92; Supplemental Table 1). Sequencing was performed by the Instituto de Biotecnología Universidad Nacional Autónoma de México (Cuernavaca, México; http://www.ibt.unam.mx/sintesis/secuenciacion.html) and analyzed using Chromas 2.1 (Technelysium Pty Ltd).
Hardy–Weinberg statistical analysis
The genotype of each animal (as determined by HRM) was used to calculate allelic and genotypic frequencies with the Hardy–Weinberg equation (Falconer and Mackay 1996):
where p 2 is the number of individuals homozygous for SNP n, 2pq is the predicted frequency for heterozygous, and q 2 is the number of individuals homozygous for SNP m.
Results and discussion
qPCR-HRM using controls sequences
The two different intercalating dyes EVA- and SYBR-green, as provided by the two separate master mixes, were used to differentiate SNPs on the synthesized GDF9 gene by qPCR-HRM. We observed that qPCR-HRM could clearly differentiate both G1 A/A and G/G SNPs with 99.5% confidence with both intercalating dyes using NMC and more clearly using DC (Fig. 1). For A/G, EVA-Green produced a smoother curve than SYBR-Green; however, both were distinguishable from the homozygous signals with 98% confidence (Fig. 1a, b). Synthetic control molecules for G4, G6, and G7 SNPs showed a similar trend and allowed the identification of all possible homozygous and heterozygous states. Therefore, in subsequent analysis, we employed only SYBR-Green mix.
Fig. 1.

qPCR-HRM analysis for G1 single-nucleotide polymorphism (SNP) using synthetic controls and two different intercalating dyes. Normalized melting curves (NMC, left) and differential curves (DC, right) are shown using intercalating dye. a SYBR-Green or b EVA-Green. Colors correspond to a different SNP as indicated. Two independent experimental replicates are presented. RFU relative fluorescence units
Sheep flock diagnostic for GDF9 SNPs by qPCR-HRM
Eight SNPs have been reported for GDF9, namely, G1-G8 (Supplemental Fig. 1; Hanrahan et al. 2004). In this work, we analyzed G1, G4, G6, and G7, since they are non-synonymous mutations, and G1 has been reported to have an additive effect on litter size in heterozygous sheeps (Paz et al. 2015). The diagnostic of G4, G6, and G7 can be used to estimate allele diversity.
When gDNA samples were analyzed and compared in parallel to synthetic controls, the only SNP identified for G1 was G/G (n = 270; Fig. 2a), and this was further confirmed by sequencing (Fig. 2e). This SNP is considered wild type for prolificacy, while A/A and A/G are considered prolificacy indicators (Moradband et al. 2011; Barzegari et al. 2010). G1 mutation occurs at amino acid residue 87 in exon 1, and changes from arginine to histidine. This mutation was reported in Garole sheep, which is one of the most prolific breeds in India (Polley et al. 2010). The mutation is also reported in Chilean sheep breeds, as an SNP that may be used as a molecular marker for prolificacy, with an additive effect on litter size in heterozygous animals (Paz et al. 2015). Given the importance of G1 SNP, the first conclusion of applying this diagnostic methodology for this flock of Mexican sheeps is that is necessary to implement a strategy to introduce A alleles in all breeds to increase prolificacy. In other studies, it has been observed that G1 SNP is more diverse, ranging from 10 to 40% of heterozygous individuals (A/G) in Salskaya and Romanov breeds (Kolosov et al. 2015), and 6–50% in Chilean Chilota and admixed sheeps (Paz et al. 2014, 2015).
Fig. 2.
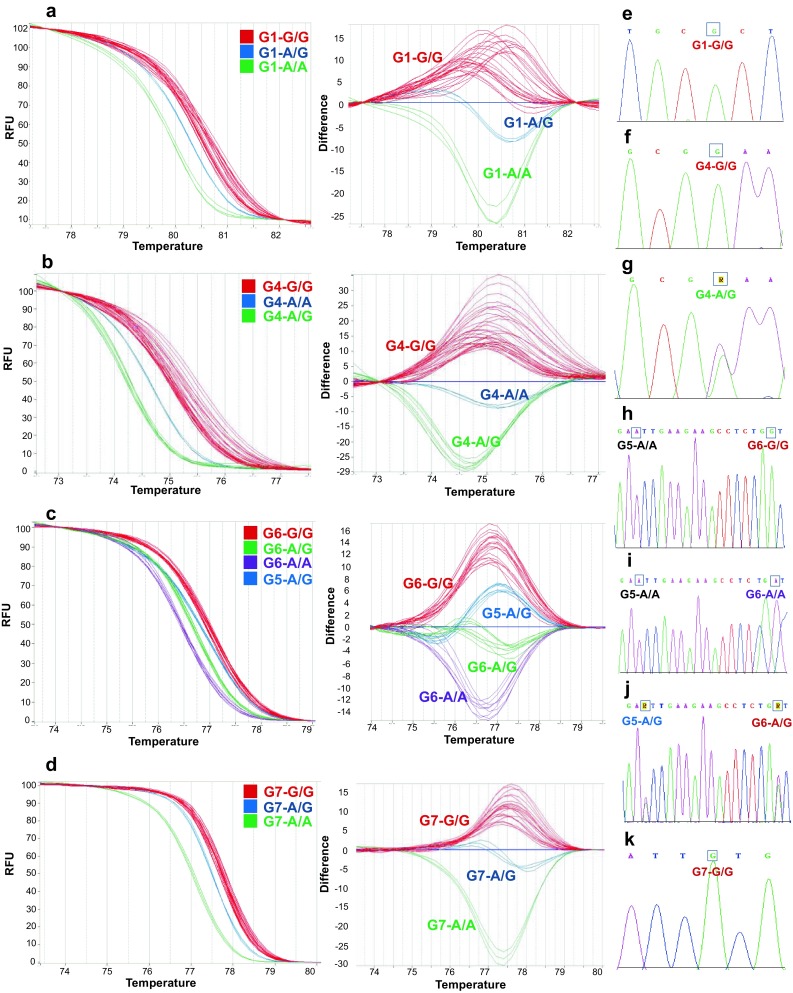
Genotyping of sheep GDF9 single-nucleotide polymorphisms (SNPs) by qPCR-HRM and validation by sequencing. a–d Normalized melting curves and differential curves produced using SYBR-Green. Colors correspond to different SNPs as indicated in the legend. Two independent experimental replicates are presented for controls, and for sheep gDNA, all analyzed in the same plate. e–k Electropherograms of gDNA results sequencing from representative individuals to validate the indicated SNP
In the case of SNP G4 (n = 226), both G/G (70%) and A/G (30%) were identified (Fig. 2b) and confirmed (Fig. 2f, homozygous; Fig. 2g, heterozygous). SNP G4 substitutes a glutamate residue for lysine, but since it is located next to a furin processing site, it is expected not to affect the mature protein (Hanrahan et al. 2004).
For SNP G6 (n = 293), all three possible combinations were detected (Fig. 2d) and confirmed (Fig. 2h, i) in abundance of 10, 77, and 13% for A/A, G/G, and A/G, respectively. SNP G6 is a neutral polymorphism for prolificacy (Hanrahan et al. 2004).
During the analysis of SNP G6, a fourth variant in A/G heterozygous was found through HRM analysis (Fig. 2c). After sequencing, we found that it was the product of neutral SNP G5, 15 bp downstream of G6. Although SNP G5 is not useful for animal breeding, its detection through qPCR-HRM indicates that this method can be designed to simultaneously detect two closely located SNPs.
For SNP G7, only the G/G genotype was detected (n = 293). Both A/A and G/G have wild-type fertility, with heterozygosity leading to increased ovulation rate (Mullen and Hanrahan 2014). Therefore, this specific flock necessitates a strategy for obtaining heterozygous individuals, as with G1.
When these data were separated by breed and analyzed using a Hardy–Weinberg model, SNP G4 was found in all breeds to be in equilibrium, indicating the absence of selective pressure (Table 1). Conversely, SNP G6 was found to be in equilibrium only in Pelibuey sheep, indicating selective pressure for this SNP (Table 1).
Table 1.
Genotypic and allelic frequencies (p 2 + 2pq + q 2) of gDNA sheep samples for GDF9 SNPs G4 and G6
| Katahdin | Pelibuey | Dorper | Black belly | Admixed | ||||||||||||||||
|---|---|---|---|---|---|---|---|---|---|---|---|---|---|---|---|---|---|---|---|---|
| AA | AG | GG | Tot | AA | AG | GG | Tot | AA | AG | GG | Tot | AA | AG | GG | Tot | AA | AG | GG | Tot | |
| SNP G4 | ||||||||||||||||||||
| Observed individuals | 0 | 33 | 61 | 94 | 0 | 13 | 21 | 34 | 0 | 9 | 28 | 37 | 0 | 1 | 16 | 17 | 0 | 11 | 33 | 44 |
| Observed genotypic frequency | 0 | 0.35 | 0.64a | 1 | 0 | 0.38 | 0.61a | 1 | 0 | 0.243 | 0.756a | 1 | 0 | 0.06 | 0.94a | 1 | 0 | 0.25 | 0.75a | 1 |
| Expected genotypic frequency | 0.03 | 0.28 | 0.68 | 1 | 0.03 | 0.30 | 0.65 | 1 | 0.01 | 0.213 | 0.771 | 1 | 0.00 | 0.05 | 0.94 | 1 | 0.015 | 0.21 | 0.76 | 1 |
| Expected individuals | 2.9 | 27.2 | 63.9 | 94 | 1.24 | 10.5 | 22.2 | 34 | 0.54 | 7.9 | 28.5 | 37 | 0.01 | 0.97 | 16.0 | 17 | 0.68 | 9.6 | 33.6 | 44 |
| Allelic frequency | A | G | A | G | A | G | A | G | A | G | ||||||||||
| 0.18 | 0.82b | 0.2 | 0.8b | 0.12 | 0.88b | 0.03 | 0.97b | 0.125 | 0.875b | |||||||||||
| SNP G6 | ||||||||||||||||||||
| Observed individuals | 23 | 31 | 96 | 150 | 3 | 7 | 25 | 35 | 2 | 1 | 33 | 36 | 0 | 0 | 17 | 17 | 0 | 0 | 55 | 55 |
| Observed genotypic frequency | 0.15 | 0.20 | 0.64a | 1 | 0.08 | 0.2 | 0.71a | 1 | 0.05 | 0.02 | 0.91a | 1 | 0 | 0 | 1a | 1 | 0 | 0 | 1a | 1 |
| Expected genotypic frequency | 0.07 | 0.38 | 0.55 | 1 | 0.03 | 0.30 | 0.66 | 1 | 0.005 | 0.13 | 0.87 | 1 | 0 | 0 | 1 | 1 | 0 | 0 | 1 | 1 |
| Expected individuals | 9.8 | 57.2 | 82.8 | 150 | 1.20 | 10.5 | 23.2 | 35 | 0.18 | 4.65 | 31.2 | 36 | 0 | 0 | 17 | 17 | 0 | 0 | 55 | 55 |
| Allelic frequency | A | G | A | G | A | G | A | G | A | G | ||||||||||
| 0.26 | 0.74b | 0.18 | 0.81b | 0.07 | 0.93b | 0 | 1b | 0 | 1b | |||||||||||
aPredominant genotype
bPredominante allele
We compared the methodologies of our previous work using RFLPs for the detection of bovine k-casein (Cortés López et al. 2012) with qPCR-HRM for the diagnostics of sheep GDF9 SNPs. We found that although qPCR-HRM requires almost twice as much investment in a qPCR machine, once this is obtained, qPCR-HRM is four times more economically efficient when sample processing capacity and analysis time is incorporated (Supplemental Table 2). The main reason is that qPCR is a closed-tube assay that allows real-time data observation and needs no further processing with electrophoresis and gel imaging (Vossen et al. 2009).
Allelic distribution
Individual SNP identification can be complemented with allelic classification for each individual. Since G1 and G7 were not polymorphic, only G4 and G6 were included (Fig. 3). This allows the classification of individuals according to their genetic identity and may be used for planning strategies for conserving diversity and for identifying unique individuals of interest for breeding.
Fig. 3.

Allelic combinations of GDF9 SNP G4 and G6 on individuals of different sheep breeds
In Katahdin individuals, it was observed that SNP G4 G/G and G6 G/G were predominant (43%), followed by A/G–G/G (17%), G/G–A/G (12%), A/G–A/G (11%), G/G–A/A (11%), and A/G–A/A (6%; Table 1). At the population level, the predominant allelic combination was G/G–G/G (61%), also considered the wild-type allele for sheep (Hanrahan et al. 2004). This explains the comparatively low frequency of observed prolificacy.
Future directions
GDF9 has SNPs that lead to synonymous amino acidic changes (G2, G3, and G5) that should not affect protein sequence; however, it has been suggested that the change in the DNA sequence may lead to alterations in tRNA usage and mRNA transcription, splicing, transportation, and translation (Abdoli et al. 2016). Therefore, the use of qPCR-HRM genotyping can be combined in the future with reverse transcription qPCR to measure mRNA expression and obtain information at both levels of the flow of genetic information.
The phenotypic outcome of an allele depends on other allele expression and mutations, and this may explain the variability of SNPs effect on prolificacy in different breeds (Abdoli et al. 2016). The HRM genotypic strategy here reported may be used as a high-throughput tool to increase the individuals included in genetic studies aimed to correlate prolificacy determinants in different breeds, monitor gene introgression, and elite animal selection (Mullen and Hanrahan 2014). In addition, it can be concomitantly implemented with other diagnostic methods for BMP15 and BMPR1B (Yao-Jing et al. 2011; Mullen et al. 2013).
In addition to the SNPs here used, GDF9 G8 has also been reported to be important in prolificacy in heterozygous animals, and in some breeds, homozygous individuals may be sterile (Hanrahan et al. 2004). Using SNPs with strong influence on prolificacy, such as G8, may not be optimal in animal breeding, because it leads to low weight and the need of hand rearing (Mullen and Hanrahan 2014; Abdoli et al. 2016). Following the methodology here reported, a strategy can be further designed for the selection of individuals with such heterozygous state in G8 and control of its segregation.
Finally, HRM curves can also be applied for sheep genotyping intended to trace the source of mutations in specialized sheep breeds and examine the genetic distances between breeds and interbreeding outcomes, as reported in Belclare and Cambridge sheeps for FecXG (BMP15) and FecGH (G8, GDF9) alleles (Mullen et al. 2013).
Conclusions
GDF9 has been thoroughly studied in relation to its influence on prolificacy traits. This made it a suitable candidate to design, test, and implement a diagnostic tool for large flock characterization. Using qPCR-HRM, we were able to detect all variants of five SNPs in GDF9, and create an allelic frequency report to be used for developing a breeding strategy. The data analysis indicated that the genetic diversity of the Mexican sheep flocks analyzed is low and poorly enriched in SNPs positively associated with prolificacy, most likely because of the lack of breeding programs using modern genetic methodologies. This method proved to be efficient and cost-effective when compared to the traditional methodologies such as RFLP. In the future, it can be easily scalable for larger studies aimed at conserving genetic diversity of flocks and identifying elite individuals. If combined with trans-generational studies of prolificacy and fertility, it will allow the monitoring of modern breeding strategies.
Electronic supplementary material
Below is the link to the electronic supplementary material.
Supplementary material 1 (DOCX 21169 kb)
Acknowledgements
This research was supported by Consejo Nacional de Ciencia y Tecnología de México—Secretaría de Economía (FINOVA-192172 to JAZ) and Consejo Nacional de Ciencia y Tecnología de México—Secretaría de Educación Pública (Ciencia Básica 152642 to JMPC).
Authors’ contributions
All the experiments were performed by RAEC with technical assistance of LUEG. GG provided molecular biology expertise and reviewed reports and associated thesis. VMMV provided flock management expertise. JMPC provided reagents, equipment, and software access. JAZ conceived and designed the experiments, and led the data analysis and manuscript preparation with assistance from JMPC and RAEC.
Compliance with ethical standards
Conflict of interest
The authors declare that they have no conflict of interest.
Footnotes
Electronic supplementary material
The online version of this article (doi:10.1007/s13205-017-0837-z) contains supplementary material, which is available to authorized users.
References
- Abdoli R, Zamani P, Deljou A, Rezvan H. Association of BMPR-1B and GDF9 genes polymorphisms and secondary protein structure changes with reproduction traits in Mehraban ewes. Gene. 2013;524:296–303. doi: 10.1016/j.gene.2013.03.133. [DOI] [PubMed] [Google Scholar]
- Abdoli RP, Zamani SZ, Mirhoseini N, Ghavi HZ, Nadri S. A review on prolificacy genes in sheep. Reprod Domest Anim. 2016;51:631–637. doi: 10.1111/rda.12733. [DOI] [PubMed] [Google Scholar]
- Barzegari A, Atashpaz S, Ghabili K, Nemati Z, Rustaei M, Azarbaijani R. Polymorphisms in GDF9 and BMP15 associated with fertility and ovulation rate in Moghani and Ghezel sheep in Iran. Reprod Domest Anim. 2010;45:666–669. doi: 10.1111/j.1439-0531.2008.01327.x. [DOI] [PubMed] [Google Scholar]
- Chu MX, Yang J, Feng T, Cao GL, Fang L, Di R, Huang DW, Tang QQ, Ma YH, Li K, Li N. GDF9 as a candidate gene for prolificacy of Small Tail Han sheep. Mol Biol Rep. 2011;38:5199–5204. doi: 10.1007/s11033-010-0670-5. [DOI] [PubMed] [Google Scholar]
- Cortés López NG, Del Moral S, Luna-Palomera C, Rueda Barrientos JA, Meza-Herrera CA, Abad-Zavaleta J. Allelic and genotypic frequency of the kappa casein gene in double purpose cattle. Trop Subtrop Agroecosyst. 2012;15:47–55. [Google Scholar]
- Davis GH. Major genes affecting ovulation rate in sheep. Genet Sel Evol. 2005;37:S11. doi: 10.1186/1297-9686-37-S1-S11. [DOI] [PMC free article] [PubMed] [Google Scholar]
- Falconer DS, Mackay TFC. Introduction to quantitative genetics. Essex: Pearson; 1996. [Google Scholar]
- Hanrahan JP, Gregan SM, Mulsant P, Mullen M, Davis GH, Powell R, Galloway SM. Mutations in the genes for oocyte-derived growth factors GDF9 and BMP15 are associated with both increased ovulation rate and sterility in Cambridge and Belclare sheep (Ovis aries) Biol Reprod. 2004;70:900–909. doi: 10.1095/biolreprod.103.023093. [DOI] [PubMed] [Google Scholar]
- Javanmard A, Mohammadabadi MR, Zarrigabayi GE, Gharahedaghi AA, Nassiry MR, Javadmansh A, Asadzadeh N. Polymorphism within the intron region of the bovine leptin gene in Iranian Sarabi cattle (Iranian Bos taurus) Russ J Genet. 2008;44:495–497. doi: 10.1134/S1022795408040169. [DOI] [PubMed] [Google Scholar]
- Khodabakhshzadeh R, Mohammadabadi MR, Esmailizadeh A, Moradi H, Bordbar F, Ansari S. Identification of point mutations in exon 2 of GDF9 gene in Kermani sheep. Polish J Vet Sci. 2016;19:281–289. doi: 10.1515/pjvs-2016-0035. [DOI] [PubMed] [Google Scholar]
- Kibbe WA. OligoCalc: an online oligonucleotide properties calculator. Nucleic Acid Res. 2007;35:w43–W46. doi: 10.1093/nar/gkm234. [DOI] [PMC free article] [PubMed] [Google Scholar]
- Kolosov AY, Getmantseva LV, Shirockova NV, Klimenko A, Bakoev SY, Usatov AV, Leonova MA. Polymorphism of the GDF9 gene in Russian sheep breeds. J Cytol Histol. 2015;6:1. [Google Scholar]
- Kumar S, Kolte AP, Mishra AK, Arora AL, Singh VK. Identification of the FecB mutation in Garole × Malpura sheep and its effect on litter size. Small Rumin Res. 2006;64:305–310. doi: 10.1016/j.smallrumres.2005.04.030. [DOI] [Google Scholar]
- McNatty KP, Moore LG, Hudson NL, Quirke LD, Lawrence SB, Reader K, Ritvos O. The oocyte and its role in regulating ovulation rate: a new paradigm in reproductive biology. Reproduction. 2004;128:379–386. doi: 10.1530/rep.1.00280. [DOI] [PubMed] [Google Scholar]
- Meistertzheim AL, Calves I, Artigaud S, Friedman CS, Paillard C, Laroche J, Ferec F. High resolution melting analysis for fast and cheap polymorphism screening of marine populations. Protoc Exch. 2012 [Google Scholar]
- Moghadaszadeh M, Mohammadabadi MR, Koshkoieh AE. Association of exon 2 of BMP15 gene with the litter size in the Raini Cashmere goat. Genet 3rd Millenn. 2015;13:4062–4067. [Google Scholar]
- Mohammadabadi MR, Nikbakhti M, Mirzaee HR, Shandi A, Saghi DA, Romanov MN, Moiseyeva IG. Genetic variability in three native Iranian chicken populations of the Khorasan province based on microsatellite markers. Russ J Genet. 2010;46:505–509. doi: 10.1134/S1022795410040198. [DOI] [PubMed] [Google Scholar]
- Mohammadi A, Nassiry MR, Mosafer J, Mohammadabadi MR, Sulimova GE. Distribution of BoLA-DRB3 allelic frequencies and identification of a new allele in the Iranian cattle breed Sistani (Bos indicus) Russ J Genet. 2009;45:198–202. doi: 10.1134/S1022795409020100. [DOI] [PubMed] [Google Scholar]
- Moradband F, Rahimi G, Gholizadeh M. Association of polymorphisms in fecundity genes of GDF9, BMP15 and BMP15-1B with litter size in Iranian Baluchi sheep. Asian–Australas J Anim Sci. 2011;24:1179–1183. [Google Scholar]
- Mullen MP, Hanrahan JP. Direct evidence on the contribution of a missense mutation in GDF9 to variation in ovulation rate of Finnsheep. PLoS ONE. 2014;9:e95251. doi: 10.1371/journal.pone.0095251. [DOI] [PMC free article] [PubMed] [Google Scholar]
- Mullen MP, Hanrahan JP, Howard DJ, Powell R. Investigation of prolific sheep from UK and Ireland for evidence on origin of the mutations in BMP15 (FecXG, FecXB) and GDF9 (FecGH) in Belclare and Cambridge sheep. PLoS ONE. 2013;8:e53172. doi: 10.1371/journal.pone.0053172. [DOI] [PMC free article] [PubMed] [Google Scholar]
- Palmer JS, Zhao ZZ, Hoekstra C, Hayward NK, Webb PM, Whiteman DC, Montgomery GW. Novel variants in growth differentiation factor 8 in mothers of dizygotic twins. J Clin Endocrinol Metab. 2006;91:4713–4716. doi: 10.1210/jc.2006-0970. [DOI] [PubMed] [Google Scholar]
- Pan ZY, Di R, Tang QQ, Jin HH, Chu MX, Huang DW, Yao YX. Tissue-specific mRNA expression profiles of GDF9, BMP15, and BMPR1B genes in prolific and non-prolific goat breeds. Czech J Anim Sci. 2015;60:452–458. doi: 10.17221/8525-CJAS. [DOI] [Google Scholar]
- Paz E, Quiñones J, Bravo S, Rodero E, Gonzalez A, Sepúlveda N. Identificación de los polimorfismos G1 y G8 del gen GDF9 en ovinos criollos Araucanos. Arch Med Vet. 2014;46:327–331. doi: 10.4067/S0301-732X2014000200020. [DOI] [Google Scholar]
- Paz E, Quiñones J, Bravo S, Montaldo HH, Sepúlveda N. Genotyping of BMPR1B, BMP15 and GDF9 genes in Chilean sheep breeds and association with prolificacy. Anim Genet. 2015;46:98–99. doi: 10.1111/age.12254. [DOI] [PubMed] [Google Scholar]
- Polley S, De S, Brahma B, Mukherjee A, Vinesh PV, Batabyal S, Goswami SL. Polymorphism of BMPR1B, BMP15 and GDF9 fecundity genes in prolific Garole sheep. Trop Anim Health Prod. 2010;42:985–993. doi: 10.1007/s11250-009-9518-1. [DOI] [PubMed] [Google Scholar]
- Pramod RK, Sharma SK, Kumar R, Rajan A. Genetics of ovulation rate in farm animals. Vet World. 2013;6:833–838. doi: 10.14202/vetworld.2013.833-838. [DOI] [Google Scholar]
- Reed GH, Kent JO, Wittwer CT. High-resolution DNA melting analysis for simple and efficient molecular diagnostics. Pharmacogenomics. 2007;8:597–608. doi: 10.2217/14622416.8.6.597. [DOI] [PubMed] [Google Scholar]
- Ruzina MN, Shtyfurko TA, Mohammadabadi MR, Gendzhieva OB, Tsedev T, Sulimova GE. Polymorphism of the BoLA-DRB3 gene in the Mongolian, Kalmyk, and Yakut cattle breeds. Russ J Genet. 2010;46:456–463. doi: 10.1134/S1022795410040113. [DOI] [PubMed] [Google Scholar]
- Schmittgen TD, Livak KJ. Analyzing real-time PCR data by the comparative CT method. Nat Protoc. 2008;3:1101–1108. doi: 10.1038/nprot.2008.73. [DOI] [PubMed] [Google Scholar]
- Shamsalddini S, Mohammadabadi MR, Esmailizadeh AK. Polymorphism of the prolactin gene and its effect on fiber traits in goat. Russ J Genet. 2016;52:405–408. doi: 10.1134/S1022795416040098. [DOI] [PubMed] [Google Scholar]
- Simko I. High-resolution DNA melting analysis in plant research. Trends Plant Sci. 2016;21:528–537. doi: 10.1016/j.tplants.2016.01.004. [DOI] [PubMed] [Google Scholar]
- Veerkamp RF, Beerda B. Genetics and genomics to improve fertility in high producing dairy cows. Theriogenology. 2007;68S:S266–S273. doi: 10.1016/j.theriogenology.2007.04.034. [DOI] [PubMed] [Google Scholar]
- Vossen RH, Aten E, Roos A, den Dunnen JT. High-resolution melting analysis (HRMA): more than just sequence variant screening. Hum Mutat. 2009;30:860–866. doi: 10.1002/humu.21019. [DOI] [PubMed] [Google Scholar]
- Yao-Jing Y, Bo-Hui Y, Xia L, Jian-Bin L, Shuo J, Jian G, Xiao-Ping S, Chun-E N, Rui-Lin F. Simultaneous identification of FecB and FecX G mutations in Chinese sheep using high resolution melting analysis. J Appl Anim Res. 2011;39:164–168. doi: 10.1080/09712119.2011.565554. [DOI] [Google Scholar]
Associated Data
This section collects any data citations, data availability statements, or supplementary materials included in this article.
Supplementary Materials
Supplementary material 1 (DOCX 21169 kb)