

Abstract
Epidemiological studies indicate that patients suffering from Alzheimer’s disease have a lower risk of developing lung cancer, and suggest a higher risk of developing glioblastoma. Here we explore the molecular scenarios that might underlie direct and inverse co-morbidities between these diseases. Transcriptomic meta-analyses reveal significant numbers of genes with inverse patterns of expression in Alzheimer’s disease and lung cancer, and with similar patterns of expression in Alzheimer’s disease and glioblastoma. These observations support the existence of molecular substrates that could at least partially account for these direct and inverse co-morbidity relationships. A functional analysis of the sets of deregulated genes points to the immune system, up-regulated in both Alzheimer’s disease and glioblastoma, as a potential link between these two diseases. Mitochondrial metabolism is regulated oppositely in Alzheimer’s disease and lung cancer, indicating that it may be involved in the inverse co-morbidity between these diseases. Finally, oxidative phosphorylation is a good candidate to play a dual role by decreasing or increasing the risk of lung cancer and glioblastoma in Alzheimer’s disease.
Introduction
Alzheimer’s disease (AD) is a leading global healthcare burden1 and, while over one hundred drugs have been developed to treat this disease, only a dozen have been approved for AD treatment in the past 20 years. Unfortunately, none of these halt the disease’s progression2. Lung cancer (LC) is the leading cause of cancer-related mortality, with nearly 1.4 million deaths every year3. Malignant glioblastomas (GBM) are the most common primary brain tumors in adults and, despite recent therapeutic advances, the life expectancy of patients with GBM continues to be less than 2 years4. Thus, these three diseases are considered among the most challenging public health conditions worldwide, emphasizing the need for innovative approaches to deal with them.
Insight into the connections between diseases offer new opportunities to better understand their pathogeneses5, 6. Direct co-morbidities are common for many diseases, representing a higher-than-expected joint occurrence of medical conditions in individuals. For example, a direct co-morbidity between AD and brain tumors is currently suspected7–9. By contrast, inverse co-morbidities are defined as a lower-than-expected probability of a specific disease in individuals diagnosed with another medical condition. For instance, AD is associated with a lower risk of various cancers, including LC9, 10.
Various factors have been proposed to be involved in direct and inverse co-morbidities, such as the environment, lifestyle or drug treatments11, and we hypothesize that genetic and molecular factors could also play a role in these relationships. We recently studied a set of Central Nervous System (CNS) disorders and cancers known to display patterns of inverse co-morbidity. Thanks to transcriptomic meta-analyses, we were able to identify a molecular signature of deregulated genes in opposite directions in these diseases12. Here we aim to challenge the molecular bases of inverse and of direct co-morbidities, and the role of the affected tissues in these associations. As such, we conducted a systematic meta-analysis of transcriptomic gene expression data in AD, GBM and LC, comparing the deregulated genes in each disease to each other. Brain and lung control samples were used to detect basal tissue-associated gene expression in order to rule out confounding data. Accordingly, we identified a significant number of genes that were deregulated in opposite directions in AD and LC, inverse expression that was associated to the proteasome, protein folding and mitochondrial processes. We propose that such deregulation could represent a molecular substrate for the inverse co-morbidity observed between these 2 diseases. By contrast, we found a significant number of genes that were deregulated in the same direction in AD and GBM. This deregulation affected the immune system and the potential establishment of a chronic inflammatory state, suggesting that these changes are associated with direct co-morbidity between AD and GBM.
Results
Gene expression variations associated to the tissues of origin
To take into account any variations in gene expression associated to the diseased tissues when comparing AD and GBM with LC, we first compared control brain and lung samples (see Methods). A Principal Component Analysis revealed distinct basal expression of genes in the control brain and lung samples, with 66% of the variability explained by the origin of the tissue (Supplementary Fig. S1). An enrichment analysis showed that genes up-regulated in the control lung samples relative to the brain tissue are significantly enriched in immune system-related processes (e.g., “defense response”, “cytokine-cytokine receptor interaction”, “immune response”, “inflammatory response”: Supplementary Table S1). Conversely, the genes up-regulated in the control brains relative to the lung tissue are enriched in brain-related processes, such as “synaptic transmission”, “neurotransmitter release”, “neuron differentiation” and “glucose metabolism” (Supplementary Table S2). All the processes differentially expressed in lung and brain tissues will be further used in our analyses in order to distinguish tissue-associated variations from true changes in gene expression associated to the disease.
Molecular relationships between Alzheimer’s disease and lung cancer
We conducted transcriptomic meta-analyses and identified “significantly Differentially Expressed Genes” (sDEGs) in AD, GBM and LC (see Methods, Supplementary Table S3). We first focused on the molecular relationships between AD and LC, two diseases that display inverse co-morbidity according to epidemiological data9, 10. As such, we compared the up- and down-regulated sDEGs in these 2 diseases, finding significant overlaps (FDR ≤ 0.05) between sDEGs deregulated in opposite directions in AD and LC (i.e., AD+/LC− or AD−/LC+: Fig. 1a), confirming previous observations12. These results persisted when more stringent FDR cut-offs were established for the detection of sDEGs (FDR ≤ 0.05, 5 × 10⁻⁴ and 5 × 10⁻⁶: Fig. 1a), as well as with an alternative meta-analysis approach (Methods and Supplementary Fig. S2).
Figure 1.
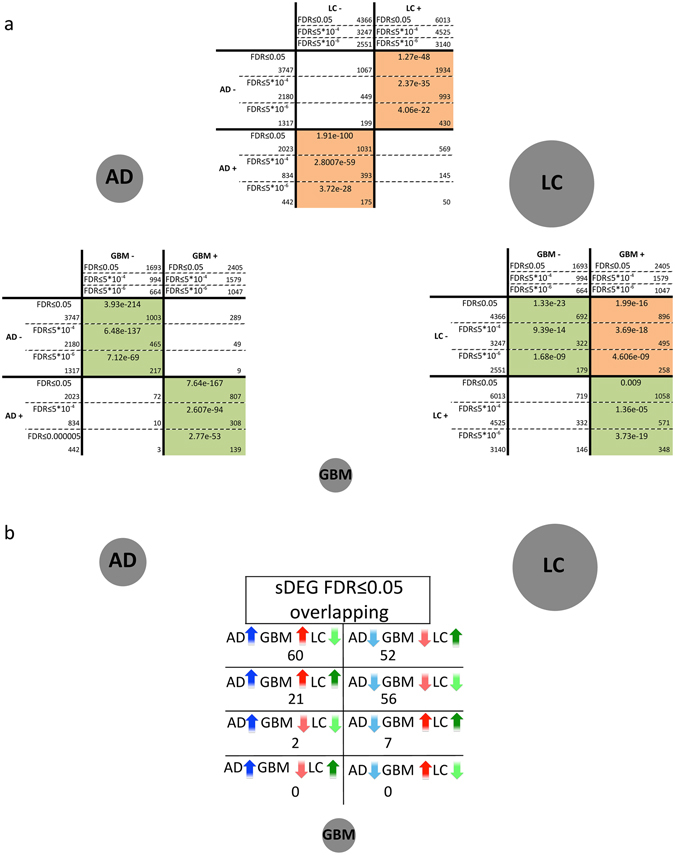
Overlaps between significantly differentially expressed genes (sDEGs) in Alzheimer’s disease (AD), lung cancer (LC) and glioblastoma (GBM). The grey circles represent each of the diseases studied and their size is proportional to the total number of sDEGs identified for each disease with a FDR ≤ 0.05. (a) Pairwise comparisons of sDEGs identified as significantly up- and down-regulated with 3 different FDR cut-offs (FDR ≤ 0.05, 5 × 10⁻⁴ & 5 × 10⁻⁶) after gene expression meta-analyses for AD, LC and GBM. Orange and green cells indicate significant overlaps between the genes significantly differentially expressed (sDEGs) in the same and opposite direction, respectively (Fisher’s exact test, FDR ≤ 0.05). White cells correspond to non-significant overlaps (FDR > 0.05). The number of sDEGs in each disease and in the pairwise overlaps are indicated in their corresponding cell. (b) Numbers of overlapping sDEGs identified jointly in the 3 diseases.
We conducted gene set enrichment analyses independently for each disease13, and we found 395 biological processes and pathways significantly deregulated in either AD and/or LC (Supplementary Table S4). Of these, 92 were common to both diseases, including 21 processes up-regulated in AD and down-regulated in LC (AD+/LC−), and 71 processes down-regulated in AD and up-regulated in LC (AD−/LC+: Fig. 2, Table 1). These common processes annotate a total of 31% (315/1031) of the AD+/LC− sDEGs and 29% (553/1934) of the AD−/LC+ sDEGs (Supplementary Table S5). No processes were deregulated in the same direction in AD and LC at the threshold selected (FDR ≤ 0.05).
Figure 2.
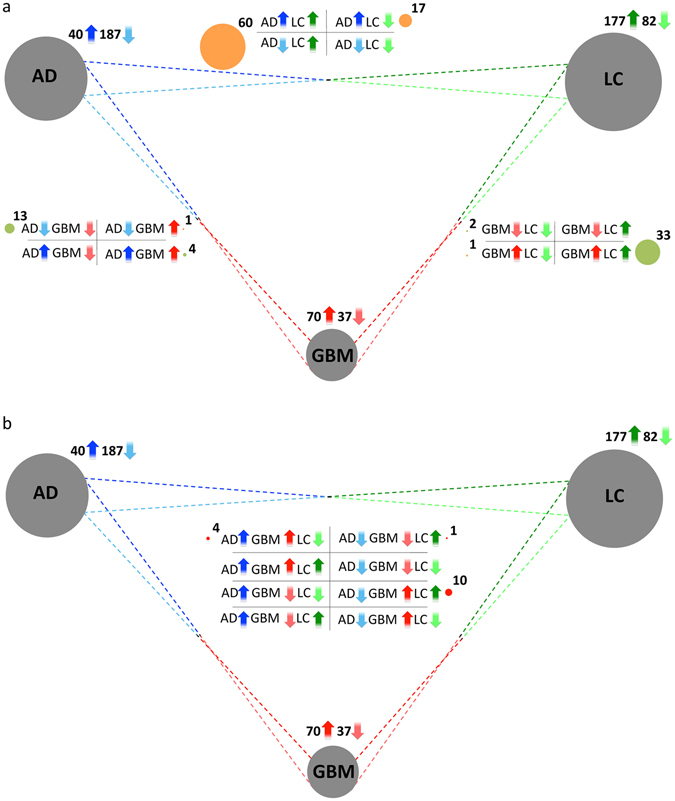
Overlaps between processes and pathways significantly enriched in Alzheimer’s disease (AD), lung cancer (LC) and glioblastoma (GBM). Grey circles represent each of the diseases studied, and their size is proportional to the total number of processes/pathways up- or down-regulated in each case. (a) Number of Biological Processes, and KEGG and Reactome pathways significantly up- and down-regulated (FDR ≤ 0.05) in at least two of the three diseases. Dark and light arrows represent pathways up- and down-regulated, respectively. The Processes/Pathways deregulated in two diseases are located in between their corresponding grey circles, and correspond to the 4 possible combinations: up or down in both diseases, up in one disease and down in the other, and vice versa. Green circles denote the number of pathways deregulated in the same direction in two diseases, while the orange circles denote numbers of pathways deregulated in opposite directions in two diseases. (b) The Pathways/Processes significantly enriched in all 3 diseases.
Table 1.
Overlap between the processes and pathways significantly enriched in Alzheimer’s disease (AD), glioblastoma (GBM) and lung cancer (LC). Biological Processes, KEGG and Reactome pathways significantly up- and down-regulated (FDR £ 0.05) in pairwise and three-way comparisons are identified through the GSEA approach. The Pathways/Processes also significantly down-regulated in brain vs. lung control samples, and those which then correspond to tissue-related expression variation are indicated with asterisks, while those significantly up-regulated in brain vs. lung control samples are indicated by circles.
| AD+/GBM+ | AD−/LC+ | GBM+/LC+ |
|---|---|---|
| ECM receptor interaction | Alanine aspartate and glutamate metabolism° | Activation of the pre replicative complex |
| Interferon alpha beta signaling | Aminoacyl tRNA biosynthesis | Base excision repair |
| Response to virus | APC C CDH1 mediated degradation of CDC20 and other APC C CDH1 targeted proteins in late mitosis early G1 | Cell cycle phase |
| RIG I MDA5 mediated induction of IFN alpha beta pathways | Cell cycle | |
| APC CDC20 mediated degradation of NEK2A | Deposition of new CENPA containing nucleosomes at the centromere | |
| Asparagine N linked glycosylation | ||
| Assembly of the pre replicative complex | DNA integrity checkpoint | |
| AD−/GBM− | Autodegradation of CDH1 by CDH1 APC C | DNA metabolic process |
| Cardiac muscle contraction | Autodegradation of the E3 ubiquitin ligase COP1 | DNA repair |
| DARPP 32 events | Biosynthesis of the n glycan precursor dolichol lipid linked oligosaccharide LLO and transfer to a nascent protein* | DNA replication |
| G alpha z signaling events | DNA strand elongation | |
| GABA synthesis release reuptake and degradation | CDK mediated phosphorylation and removal of CDC6 | Double strand break repair |
| Generation of neurons | Citrate cycle TCA cycle | Extracellular matrix organization* |
| Neuron differentiation | Cross presentation of soluble exogenous antigens endosomes | G1 S specific transcription |
| Neuronal system | Cyclin e associated events during G1 S transition | G2 M checkpoints |
| Neurotransmitter receptor binding and downstream transmission in the post-synaptic cell | Cytosolic tRNA aminoacylation | Global genomic NER GG NER |
| Destabilization of mRNA by auf1 HNRNP D0 | Homologous recombination repair of replication independent double strand breaks | |
| Neurotransmitter release cycle | Double strand break repair | |
| Potassium channels | ER phagosome pathway | Homologous recombination |
| Synaptic transmission | Formation of RNA pol II elongation complex | M phase of mitotic cell cycle |
| Transmission across chemical synapses | Formation of the HIV1 early elongation complex | M phase |
| Transmission of nerve impulse | Formation of transcription coupled NER TC NER repair complex | Meiosis I |
| Gluconeogenesis° | Meiosis | |
| Glutathione metabolism | Metabolism of nucleotides | |
| AD−/GBM+ | HIV infection | Mitosis |
| Nucleotide excision repair | HIV life cycle | Mitotic cell cycle checkpoint |
| Interactions of VPR with host cellular proteins | Mitotic cell cycle | |
| Late phase of HIV life cycle | NEP NS2 interacts with the cellular export machinery | |
| AD+/LC− | M G1 transition | p53 signaling pathway |
| Allograft rejection* | Metabolism of amino acids and derivatives | Regulation of cell cycle |
| Cell adhesion molecules CAMS | Metabolism of non coding RNA | Regulation of glucokinase by glucokinase regulatory protein |
| Cellular defense response* | Metabolism of proteins | Regulation of mitosis |
| Chemokine receptors bind chemokines* | MHC class II antigen presentation | Response to DNA damage stimulus |
| Complement and coagulation cascades* | Mitochondrial protein import | Response to endogenous stimulus |
| Complement cascade* | Mitochondrion organization and biogenesis | Transport of ribonucleoproteins into the host nucleus |
| Cytokine cytokine receptor interaction* | mRNA capping | |
| Defense response* | mRNA processing | |
| Graft versus host disease* | mRNA splicing minor pathway | GBM−/LC− |
| Hematopoietic cell lineage* | N glycan biosynthesis | Effects of PIP2 hydrolysis |
| Immune response* | Nucleobasenucleoside and nucleotide metabolic process | Phospholipase C mediated cascade° |
| Immune system process* | Nucleotide excision repair | |
| Immunoregulatory interactions between a lymphoid and a non lymphoid cell* | p53 dependent G1 DNA damage response | |
| p53 independent G1 S DNA damage checkpoint | GBM+/LC− | |
| Inflammatory response* | Processing of capped intron containing pre mRNA | Response to wounding* |
| Interferon gamma signaling* | Proteasome | |
| Leishmania infection* | Protein folding | |
| NOD like receptor signaling pathway* | Pyruvate metabolism and citric acid TCA cycle | AD−/GBM+/LC+ |
| Recruitment of mitotic centrosome proteins and complexes | Activation of ATR in response to replication stress | |
| Respiratory electron transport ATP synthesis by chemiosmotic coupling and heat production by uncoupling proteins | Cell cycle checkpoints | |
| AD+/GBM+/LC− | Cell cycle mitotic | |
| Cell surface interactions at the vascular wall* | Respiratory electron transport | DNA replication |
| Innate immune system* | RNA pol II pre transcription events | G1 S transition |
| Response to other organism* | RNA pol II transcription pre initiation and promoter opening | Mitotic G1 G1 S phases |
| Viral myocarditis* | RNA pol II transcription | Mitotic M M G1 phases |
| RNA polymerase | S phase | |
| RNA processing | Synthesis of DNA | |
| AD−/GBM−/LC+ | SCF beta TRCP mediated degradation of EMI1 | DNA repair |
| Oxidative phosphorylation | SCFSKP2 mediated degradation of p27 p21 | |
| TCA cycle and respiratory electron transport | ||
| Transcription coupled NER TC NER | ||
| tRNA aminoacylation | ||
| VIF mediated degradation of APOBEC3G |
The processes in which the genes up-regulated in AD and down-regulated in LC are enriched include immune and inflammatory responses (Table 1). These functions are also expressed differentially between control brain and lung samples, and the enrichment is probably due to the tissue of origin of the diseases (Supplementary Table S1). This was confirmed by extracting information regarding tissue-specific gene expression from GTEx14 and by conducting a gene enrichment analysis15 on AD+/LC− lung-specific genes (Supplementary Table S6). Similarly, the processes down-regulated in AD and up-regulated in LC included processes related to synaptic transmission (Table 1), that were also expressed differentially between control brain and lung samples (Supplementary Table S2). As described previously, these results were confirmed with an enrichment analysis on AD−/LC+ brain-specific genes (Supplementary Table S6).
Nevertheless, other processes associated with either AD−/LC+ or AD+/LC− are unlikely to be related with the tissue of origin. These include processes related to mitochondrial activity, such as “proteasome”, “protein folding”, “glutathione metabolism”, “TCA cycle and respiratory electron transport” and “oxidative phosphorylation” (Table 1). The deregulation of these processes in opposite directions in AD and LC could be implicated in the inverse co-morbidity observed between these diseases at the epidemiological level.
Given the enrichment observed in mitochondrial-related processes, we assessed whether the gene expression signatures associated to both diseases might be related to inhibition of the electron transport chain (ETC). With this in mind, we collected a set of inhibitors of the respiratory chain from the LINCS library (http://www.lincscloud.org), and we used a drug-set enrichment approach to compare the expression signature induced by these drugs to the expression signature of both AD and LC. This approach reveals that the changes in gene expression associated to inhibitors of the respiratory chain are similar to the changes in gene expression associated with AD in patients, but they are not significantly different to those observed in LC (FDR ≤ 0.05).
Overall, using different datasets and meta-analysis approaches these results confirm our previous results from a comparison of CNS disorders (AD, Parkinson’s disease and schizophrenia) and three types of cancer (LC, prostate and colorectal)12.
Molecular relationships between Alzheimer’s disease and glioblastoma
We applied the same methodology to analyze the molecular relationships between AD and GBM. The epidemiological data concerning the association between these diseases point to a direct co-morbidity relationship7–9. This tendency to a higher risk of developing brain tumors in AD patients is also described in HuDiNe, reporting a relative risk value of 2.94616. We conducted 6 independent meta-analyses using control samples from 5 different regions of post-mortem brains, and one set of epileptic pre-mortem brains (Methods, Supplementary Fig. S3). We found that sDEGs in GBM varied depending on the brain samples used as controls, as described elsewhere17–19, and in the 6 meta-analyses, only 35% and 26% of the sDEGs were consistently up- and down-regulated, respectively (Supplementary Fig. S4). We considered the genes that were consistently deregulated in all 6 GBM meta-analyses as GBM sDEGs (see the sDEGs and their corresponding FDR in Supplementary Table S3).
By contrast to the AD−LC molecular relationships, we found significant overlaps between the sDEGs deregulated in the same direction in AD and GBM (AD+/GBM+ and AD−/GBM−: Fig. 1a). The results were also consistent for the selection of sDEGs with more stringent FDR cut-offs (FDR ≤ 0.05, 5 × 10⁻⁴ and 5 × 10⁻⁶), and with an alternative meta-analysis approach (Supplementary Fig. S2). Since the incidence of seizures in GBM patients is between 25–50% at onset and 20–30% during the course of the disease20, we verified the significance of the overlaps between AD and GBM using control healthy and epilepsy samples separately for GBM. Irrespective of the samples used as controls (healthy or epilepsy), we obtained significant overlaps between the sDEGs in the same direction in AD and GBM (Supplementary Table S7).
Functional enrichment analyses revealed 301 processes significantly enriched in either AD or GBM, of which 8 are AD+/GBM+, 14 AD−/GBM− and 11 AD−/GBM+. We found that AD+/GBM+ processes were related to the immune system (Table 1). As AD and GBM develop in the same organ, these processes could potentially be molecular substrates of a direct co-morbidity between both diseases at an epidemiological level. Additionally, 10 AD−/GBM− processes denote potentially common neuronal features, such as “synaptic transmission” and “generation of neurons”. Finally, 10 of the 11 processes deregulated in opposite directions (AD−/GBM+) were also associated to LC, as will be discussed in the global comparison of the 3 diseases.
Molecular relationships between glioblastoma and lung cancer
Finally, we studied the molecular relationships between GBM and LC. To our knowledge, no epidemiological data are available to determine the co-morbidity between these two cancers, although lung cancers often produce brain metastases21, 22. We discovered significant overlaps between the sDEGs deregulated in the same direction in both diseases (GBM−/LC− and GBM+/LC+), as well as in those up-regulated in GBM and down-regulated in LC (GBM+/LC−: Fig. 1a).
Among the 70 processes up-regulated in GBM and the 177 processes up-regulated in LC, 43 are up-regulated in both conditions (GBM+/LC+: Table 1 and Fig. 2). Most of these functions are related to the cell cycle, for instance “mitosis” or “DNA repair”. Conversely, only two of the 37 and 82 processes down-regulated in GBM and LC, respectively, are down-regulated in both diseases (GBM−/LC−). As expected from the comparisons between control lung and brain samples, the 5 processes deregulated in opposite directions between the two cancer types (GBM+/LC−) are related to the immune system, and they correspond to variations in tissue-related gene expression (Table 1 and Supplementary Table S1).
Global comparison of the three diseases
We finally searched for sDEGs and processes that are deregulated jointly in the three diseases, and that therefore might potentially play a dual role in protecting against LC development and promote GBM development in AD patients. With the more restrictive lists of sDEGs (FDR ≤ 5 × 10⁻⁶: Fig. 1b), 112 of the 198 genes significantly deregulated in the three diseases had a similar pattern of deregulation in AD and GBM, and the opposite pattern in LC, with 60 AD+/GBM+/LC− sDEGs and 52 AD−/GBM−/LC+ sDEGs (Table 2 and Fig. 1b). Similar results were obtained with the lists of sDEGs with a FDR ≤ 0.05 (Supplementary Fig. S5). A comparison of the pathways and processes enriched in AD, GBM and/or LC revealed “oxidative phosphorylation” to be down-regulated in AD and GBM, and up-regulated in LC, pointing to potential metabolic differences between these two types of tumor (Table 1). Additionally, 10 of the 11 processes down-regulated in AD and up-regulated in GBM were also up-regulated in LC. Among these processes, the large majority were related to the cell cycle, a central activity in tumorigenesis (Table 1).
Table 2.
Significantly differentially expressed genes (FDR ≤ 5 × 10⁻⁶) as: AD+/GBM+/LC−, AD−/GBM−/LC+, AD+/GBM−/LC−, AD−/GBM+/LC+, AD−/GBM−/LC− and AD+/GBM+/LC+.
| AD+/GBM+/LC− | AD−/GBM−/LC+ | AD−/GBM−/LC− | AD+/GBM+/LC+ | |||
|---|---|---|---|---|---|---|
| NFKBIA | EMP3 | PFN2 | KCNK1 | B3GNT1 | CX3CL1 | SPP1 |
| CEBPD | EMP1 | ENO2 | NMNAT2 | OLFM1 | NTRK3 | DDIT4 |
| S100A10 | TRIP10 | STMN2 | DOCK3 | RTN3 | RND1 | PLOD3 |
| CDKN1A | TNFAIP3 | UCHL1 | GABBR2 | TCEAL2 | PLK2 | UNG |
| CSDA | GIMAP4 | SCG5 | LRRC20 | MOAP1 | PPL | PPP1R14BP3 |
| PXDC1 | MYO1F | WASF1 | SEMA4F | TSPAN7 | HLF | GTF2IRD1 |
| BCL6 | CD163 | INA | UNC13A | RTN1 | TMEM246 | TIMP1 |
| ID3 | IL10RA | TUBA4A | PORCN | PEBP1 | PRKCB | CHI3L1 |
| FCGRT | S100A4 | PGBD5 | DLG3 | PRKCZ | CD200 | INHBB |
| HLA-DMB | DOCK6 | SULT4A1 | NELL1 | MAST3 | RP11-287D1.3 | ABCB7 |
| ANXA2P2 | CTSS | SCAMP5 | FBXO41 | GPRASP1 | BCAS3 | RHBDF2 |
| TSPO | SOCS3 | RAB15 | RFPL1-AS1 | NDRG4 | PTK2B | CDKN2C |
| MYD88 | CCR1 | HPRT1 | HOOK1 | NDN | REPS2 | PLP2 |
| VSIG4 | TRAF3IP2 | NDUFS2 | CGREF1 | NCALD | ELMO1 | SLC35F2 |
| VEZF1 | HERC5 | KIF3C | ACTL6B | SNRPN | PEG3 | BACE2 |
| PIEZO1 | TCF7L1 | EEF1A2 | RP11-18A3.4 | NRN1 | PIP5K1B | FAM60A |
| ARHGDIB | ZNF516 | CKMT1B | TTC9 | REEP1 | SHANK2 | PPIC |
| CFLAR | LCAT | FNDC4 | CNTNAP2 | BEX4 | SMARCA2 | ZNF217 |
| MSX1 | TGFB1I1 | CDK5 | CABYR | LDB2 | C2CD2L | TP53 |
| LAMB2 | FAM129A | STX1A | RAB3B | MICU1 | EPB41L3 | CASP6 |
| SRGN | PLBD1 | LAMP5 | RGS7 | CCK | TMEM35 | KCNE4 |
| TRIM22 | GBP1P1 | SEZ6L2 | RP11-430B1.2 | NAP1L2 | KCNAB1 | AD−/GBM+/LC+ |
| DDR2 | SP100 | GOT1 | SYNDIG1 | SNCA | CLCN4 | SNRPEP4 |
| C3AR1 | ANG | CDH18 | TMEM59L | GABARAPL1 | CHRM3 | SEC61G |
| RAB20 | ECM2 | OGDHL | ATP13A2 | MEF2C | HAS1 | AIMP2 |
| ITGA5 | CD58 | SH3BP1 | SPINT2 | APBB1 | HSPB3 | FTSJ2 |
| STAB1 | FLI1 | AD+/GBM−/LC− | RUNX1T1 | CRY2 | METTL1 | |
| ARHGEF40 | C5AR1 | RAPGEF3 | CYFIP2 | TYRP1 | RP11-77H9.2 | |
| SLC7A7 | LYZ | SLC6A12 | WDHD1 | |||
| CD44 | MSR1 | |||||
We applied text-mining and information extraction methods specifically to these 112 sDEGs, and the same pattern of deregulation was observed in AD and GBM in PubMed abstracts associated with these diseases, and the opposite in LC. Among the most cited genes in papers related to the three diseases we found CDKN1A, NFKBIA, MYD88 and CD44, which were up-regulated in AD and GBM, and down-regulated in LC (Supplementary Fig. S6). For instance, CD44 is involved in cell-cell interactions, as well as cell adhesion and migration, and it is down-regulated in LC, potentially favoring escape from tumoricidal effector cells23. By contrast, CD44, which may favor migration, is expressed weakly in normal brain tissues and overexpressed in GBM, with even greater intensity in high-grade glioblastoma than in low-grade astrocytomas24. In AD patients, CD44 appears to be up-regulated in blood vessel-associated astrocytes25 and in lymphocytes, perhaps playing a role in the immune response in affected tissues26. Hence, CD44 appears to be clearly associated to the three diseases and it is a good candidate to play a role in their co-morbidity.
On the other hand, UCHL1, ENO2 and CDK5 are among the most cited sDEGs with an AD−/GBM−/LC+ pattern (Supplementary Fig. S7). UCHL1 is a gene encoding a thiol protease that is specifically expressed in neurons, and it has been strongly associated with a poor prognosis when overexpressed in LC as it seems to promote metastasis by abrogating HIF-1α ubiquitination27. By contrast, this gene is down-regulated in GBM brains28, increasing NF-κB activity by activating IKK29, and in AD mouse brains where its up-regulation improves memory deficits30.
Through text-mining and information extraction, we were able to confirm that some of the most significant sDEGs were among the most cited ones in each of the disease-specific abstracts for all three diseases. These genes could be good candidates to study the molecular mechanisms shared between these three diseases.
Discussion
Alzheimer’s disease, glioblastoma and lung cancer have been widely analyzed at the transcriptome level, although studying each condition separately. Thus, to our knowledge we present here the first joint analysis of these three diseases at the transcriptome level.
Molecular substrates for the inverse co-morbidity between Alzheimer’s disease and lung cancer
We identified 92 processes that were deregulated in both AD and LC, none displaying a pattern of deregulation in the same direction. If we increase the threshold of significance from 0.05 to 0.1, only three pathways appear to be down-regulated in both AD and LC, and none were up-regulated in both diseases.
Many processes linked to down-regulated genes in AD and up-regulated genes in LC are related to or have been described to influence mitochondrial activity, such as “proteasome”, “protein folding”, “oxidative phosphorylation” and “glutathione metabolism”. Based on these results and previous publications, we propose the following scenario (see Fig. 3a). First, proteasome inhibition could promote mitochondrial dysfunction in AD31, 32, dampening oxidative phosphorylation and TCA cycle rates33, 34, while increasing the generation of mitochondrial Reactive Oxygen Species (ROS)30, 31. Oxidative phosphorylation is required for A549 lung adenocarcinoma cell line growth and thus, it might decrease tumor growth capacity in AD patients32. The increase in ROS is one of the first observable changes in AD brains, preceding even Aß plaque deposition and neurofibrillary tangle formation35, and it might be facilitated by diminished levels of glutathione36. Indeed, glutathione has potentially a major influence on chemoresistance in LC and a decrease in glutathione would make LC more sensitive to chemotherapy37. Additionally, mitochondrial ROS generation drives the activation of redox-sensitive transcription factors like FOXO, and these in turn induce cell cycle arrest in the G1 phase by repressing CDK4 activity38–41. In our analyses, FOXO is AD+/LC− and it might play a role in the inverse co-morbidity between both diseases.
Figure 3.
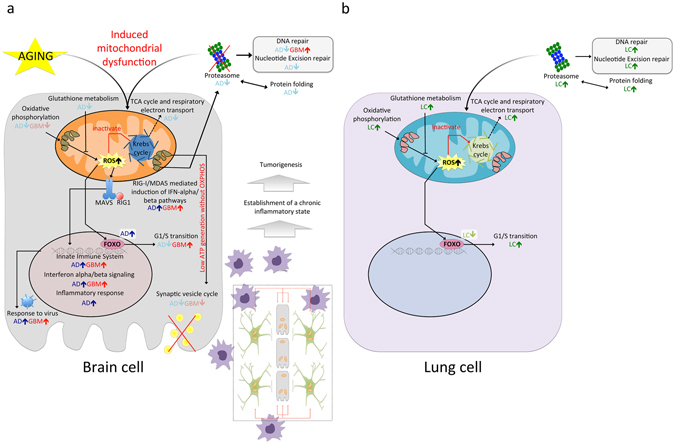
Potential scenario of the molecular pathways driving inverse and direct co-morbidities between AD and LC, and AD and GBM, respectively. (a) Potential molecular processes involved in the direct co-morbidity between AD and GBM. Proteasome inhibition could drive mitochondrial dysfunction, dampening oxidative phosphorylation and the TCA cycle. ROS are generated as a consequence of decreased rates of oxidative phosphorylation and glutathione levels. ROS generation activates the innate immune system, driving tumorigenesis by establishing a chronic inflammatory state through autocrine and paracrine loops. Synaptic transmission is decreased due to low levels of mitochondrial energy generation. (b) Potential molecular processes involved in the inverse co-morbidity between AD and LC. In this case, proteasome activity is enhanced, accompanied by increased levels of oxidative phosphorylation, TCA cycle and glutathione. As a consequence, lower levels of ROS are generated and so, redox sensitive transcription factors like FOXO are not activated, favoring the G1/S phase transition.
Finally, DNA repair is hindered as a consequence of the down-regulation of the proteasome42, which could make LC more sensitive to radiotherapy43 and at the same time, enhance mitochondrial dysfunction as a consequence of the DNA-damage caused by ROS44. Furthermore, proteasome and protein folding inhibition has been seen to attenuate cell migration and to increase cell death in non-small cell lung cancer cell lines45. Together, these distinct mechanisms are candidates to reduce the incidence of LC in patients with AD. The proposed chain of events that follow mitochondrial dysfunction as indicated above has also been described in the SK-N-MC neuroblastoma cell line when treated with the insecticide rotenone. This compound mediates NADH:ubiquinone oxidoreductase inhibition46, as confirmed by drug enrichment analysis using LINCS, and we found that the changes in gene expression produced in AD were similar to those observed when treating cells with such electron transport chain inhibitors.
Molecular substrates for direct co-morbidity of Alzheimer’s disease and glioblastoma
There is little epidemiological data on the co-morbidity relationships between AD and brain tumors7–9. However, current evidence seems to point to the existence of direct co-morbidities between brain tumors and CNS diseases16, 47, 48. Additionally, a mouse model of AD displays high sensitivity to brain tumors49. We propose here that the significant number of genes deregulated in the same direction in both diseases could be an additional argument in favor of direct co-morbidity between AD and GBM. Interestingly, 10 of the 71 genes mutated in GBM50 are found in the overlap between sDEGs in AD and GBM (Supplementary Table S8).
Given the complexity of these diseases, it is obvious that these initial results will require additional confirmation with larger and better datasets. For example, the white matter control samples available in public databases (6 control samples in GSE35864) are insufficient to pair with the GBM cases, and grey matter controls were used as –admittedly imperfect- surrogates. As such, deregulation of similar sets of genes in both brain diseases might be due to different processes as a consequence of different cellular composition, with grey matter characterized by the presence of neuronal bodies and astrocytes, and white matter characterized by the predominance of axons and oligodendrocytes.
Comparing the sDEGs in AD and GBM, we found “oxidative phosphorylation”, “synaptic transmission” and “neurotransmitter release cycle” to be down-regulated in both diseases (AD−/GBM−), and “innate immune system”, “Rig-1 MDA-5-mediated induction of IFN alpha beta” and “interferon alpha beta signaling” to be up-regulated (AD+/GBM+: Table 1). The down-regulation of oxidative phosphorylation in cancer is usually accompanied by an increase in the rate of aerobic glycolysis, a process termed the Warburg effect51. Our finding that oxidative phosphorylation is down-regulated in both AD and GBM is supported by two independent studies proposing the use of methylene blue to treat both AD52 and GBM53 as it increases oxidative phosphorylation. As a consequence of the diminished oxidative phosphorylation, less mitochondrial energy is generated and synaptic transmission fails54. Finally, we propose that persistent activation of the immune system by different routes – including activation through Aß’s interaction with pattern recognition receptors55 and interferon alpha beta signaling – leads to the establishment of a local chronic inflammatory state. Such a state was previously proposed to be potentially related to bacterial56 or viral infection57, increasing the risk of developing brain tumors in AD patients at the epidemiological level8, 9 (Fig. 3b). This hypothesis is supported by associations between local chronic inflammation and cancer described previously in various tissues (e.g., chronic asthma and lung cancer or chronic pancreatitis and pancreatic cancer)58. In support of the hypothesis that inflammation promotes tumor growth, M2 macrophage polarization markers CD163 and MSR1 favor tumor development59, and they were found to be up-regulated in both AD and GBM.
Finally, the joint analysis of AD, GBM and LC, allowed us to propose potential molecular substrates of the direct and inverse co-morbidities between these diseases. These results could help to suggest drug repurposing and drug combination strategies in the future. Initial relevant examples could include combinations of proteasome and chaperone inhibitors, anti-oxidants and oxidative phosphorylation or TCA cycle inhibitors for LC treatment.
Materials and Methods
Comparison of control Brain and Lung samples
The LIMMA package was used to identify gene expression variations60 in control brain and lung samples, merging all the samples from the HG U133 Plus 2 microarray platform and using fRMA61 for data normalization. We applied a Principal Component Analysis to normalized expression data to evaluate the variability explained by the tissue’s origin. Gene Set Enrichment Analysis (GSEA)13 was applied to the pre-ranked list of genes based on z-scores to identify enriched pathways/processes. In addition, brain and lung specific genes were extracted from GTEx14, selecting the genes with a RPKM value of 1 or higher as those expressed in a given tissue. The genes expressed in the brain and lung were compared to each other. Those found to be expressed only on the brain were selected as brain-specific genes, while those found to be expressed only on the lung were selected as lung-specific genes. Enrichment analysis were conducted using gProfileR15 on brain and lung specific genes present in AD+/LC− and AD−/LC+ sDEGs using Gene Ontology Biological Processes62, KEGG63 and Reactome64 pathways.
Microarray gene expression data
Raw data on gene expression (CEL files) were downloaded from the Gene Expression Omnibus (GEO, GSE* files http://www.ncbi.nlm.nih.gov/geo), ArrayExpress (EMTAB* files https://www.ebi.ac.uk/arrayexpress/) and The Cancer Genome Atlas (TCGA; https://tcga-data.nci.nih.gov/tcga/) for AD, GBM and LC (Supplementary Table S9). Studies undertaken on HT HG U133A, HG U133A, and HG U133Plus2 Affymetrix microarray platforms were selected to allow the frozen Robust Multiarray Analysis (fRMA) normalization method to be used and to reduce inter-platform differences65.
Study design and meta-analyses
Gene expression data preprocessing and meta-analysis
Following steps defined previously66, disease-specific meta-analyses were conducted to increase the statistical significance and to minimize the noise intrinsic to gene expression measurements. Microarray datasets were normalized using fRMA61 from the R Affy package67. When multiple probes matched the same gene symbol, probes presenting the greatest inter-quartile range were selected. Only genes present in all the selected platforms were considered (using the MetaDE.match and MetaDE.merge functions of the MetaDE package68).
The P-values and effects sizes (ES) were calculated for every gene associated with each disease using the ind.analysis and ind.cal.ES functions of the MetaDE package68, respectively. Inter-study heterogeneity was evaluated calculating Q-statistic for every gene (assumed to follow a Chi-squared distribution under the hypothesis of homogeneity), representing quantile-quantile plots of observed vs. expected distributions. The Random Effects Model was applied to combine ES due to the existence of inter-study variability based on quantile-quantile plots (Supplementary Fig. S8). In addition, we conducted an alternative meta-analysis to double-check our results. Left- & right-tailed p-values were combined separately to identify down- and up-regulated genes using the maxP_OC function of the MetaDE package68 (Supplementary Fig. S2).
Particular case of GBM
Healthy brain samples are not available for obvious ethical reasons. To overcome this problem, we used five sets of healthy post-mortem control samples from different brain regions (anterior cingulate cortex, dorsolateral prefrontal cortex, post-central gyrus, entorhinal cortex and occipital lobe) and one set of epileptic brain biopsies as controls. One meta-analysis was performed with each of the 5 control sets (Supplementary Fig. S3). For the TCGA study, carried out on the HT HG U133A platform, epileptic samples were the only control samples available.
The sDEGs for GBM were selected restrictively as those deregulated in the same direction in all GBM meta-analyses. The small percentage of genes consistently expressed differentially in GBM (35% up-regulated and 26% down-regulated) may be explained by differences in gene expression profiles due to the delay between death and the time of tissue freezing, as described previously17–19, or by differences between brain regions, as indicated by Khaitovich69, who proposed that these variations were driven by distinct neuron-oligodendrocyte ratios70.
Overlap analysis between sDEGs
Following an earlier strategy12, overlaps between pairs of diseases (AD/GBM, AD/LC and GBM/LC) were assessed by one-tailed Fisher’s exact tests on lists of sDEGs with three different FDR thresholds (FDR ≤ 0.05, 5 × 10⁻⁴ and 5 × 10⁻⁶), followed by the Bonferroni test to correct for multiple comparisons, and establishing the background number of genes as 14,538 (corresponding to the number of genes studied in the smallest platform, HT HG U133A). In the case of GBM, the intersection of the sDEGs found when using the different sets of control samples was selected.
Functional enrichment analysis
A GSEA13 was performed separately on the ranked list of gene expression data for each disease (based on the z-scores obtained by the meta-analysis), and using annotations from Gene Ontology Biological Processes62, KEGG63 and Reactome64 pathways. Pathways and processes with a FDR ≤ 0.05 were considered significant. The pathways deregulated in more than 1 disease were selected for further analyses. We use the syntax “up-regulated pathways” and “down-regulated pathways” in the manuscript to refer to the pathways associated to up- and down-regulated genes according to the GSEA13 analyses. In addition, gProfileR15 was used to conduct gene set enrichment analysis when working on sets of sDEGs rather than the ranked list of differentially expressed genes.
L1000 LINCS analysis
The 250 genes most strongly up- and down-regulated in AD and LC were used as gene expression signatures of the diseases, and compared against the LINCS L1000 library (http://www.lincscloud.org/), as performed previously71. The LINCS L1000 library is a large catalogue of gene expression signatures in cancer cell lines induced by drug treatment or gene knockdown. All signatures from all the cell lines were considered for the analysis. The Compute Connectivity on the Cloud (C3) environment was used to obtain the similarities between the AD and LC gene expression signatures with those of the drugs in L1000. The Weighted Connectivity Score13 was used as a similarity measure.
Drug-set Enrichment Analysis
The drug enrichment analysis was carried out by applying the GSEA algorithm13 but using a ranked list of drugs and drug-sets instead of genes and gene sets. As in the classical GSEA, this approach reveals if a given group of drugs, a drug set, is preferentially located in one the extremes of a ranked list of drugs. In this case, the drugs were ranked according to the similarity of their L1000 gene expression with respect to the AD or LC gene expression signatures. A search of rotenone-like ETC inhibitors in the L1000 LINCS collection gave 30 different perturbagens, corresponding to 21 different drugs. We used the drug set enrichment approach to study if the drugs with similar or opposite signatures to those of AD and LC were enriched by this type of compound.
Text mining analysis
Abstracts of papers in PubMed (http://www.ncbi.nlm.nih.gov/pubmed) associated to AD, GBM and LC were analyzed (disease-specific queries on Supplementary Information) looking for any of the genes mentioned in relation to each of these diseases. Then, the AD+/GBM+/LC− and AD−/GBM−/LC+ sDEGs (FDR ≤ 5 × 10⁻⁶) located over the third-quartile of genes mentioned in the abstracts of the three diseases were selected as the most relevant genes common to the three diseases.
Electronic supplementary material
Acknowledgements
This work was funded by the Spanish Ministry of Economics and Competitiveness (grant No’s BIO2012-40205 and BFU2015-71241-R) and it was carried out in the framework of the Platform for Biomolecular and Bioinformatics Resource (PT 13/0001/0030 of the ISCIII), which is funded through the European Regional Development Fund (ERDF). RT-S acknowledges funding from the Generalitat Valenciana (PROMETEOII/2015/021) and the national grant PI14/00894 from the Spanish “Plan Nacional de I + D + I 2013-2016,” co-funded by the “ISCIII-Subdirección General de Evaluación y el Fondo Europeo de Desarrollo Regional (FEDER).
Author Contributions
J.S., J.L., K.I., R.T.-S. and A.V. conceived the study; J.S., H.T. and M.K. analyzed the data; J.S., A.B. and A.V. drafted the manuscript. All the authors reviewed and provided feedback on the final draft of the manuscript.
Competing Interests
The authors declare that they have no competing interests.
Footnotes
Electronic supplementary material
Supplementary information accompanies this paper at doi:10.1038/s41598-017-04400-6
Publisher's note: Springer Nature remains neutral with regard to jurisdictional claims in published maps and institutional affiliations.
Contributor Information
Anaïs Baudot, Email: anais.baudot@univ-amu.fr.
Alfonso Valencia, Email: valencia@cnio.es.
References
- 1.Catalá-López F, Gènova-Maleras R, Vieta E, Tabarés-Seisdedos R. The increasing burden of mental and neurological disorders. Eur. Neuropsychopharmacol. 2013;23:1337–9. doi: 10.1016/j.euroneuro.2013.04.001. [DOI] [PubMed] [Google Scholar]
- 2.Underwood E. NEUROSCIENCE. Alzheimer’s amyloid theory gets modest boost. Science. 2015;349:464. doi: 10.1126/science.349.6247.464. [DOI] [PubMed] [Google Scholar]
- 3.Ramalingam, S. S., Owonikoko, T. K. & Khuri, F. R. Lung cancer: New biological insights and recent therapeutic advances. CA. Cancer J. Clin. 61, 91–112. [DOI] [PubMed]
- 4.Woehrer A, Bauchet L, Barnholtz-Sloan JS. Glioblastoma survival: has it improved? Evidence from population-based studies. Curr. Opin. Neurol. 2014;27:666–74. doi: 10.1097/WCO.0000000000000144. [DOI] [PubMed] [Google Scholar]
- 5.Tabarés-Seisdedos R, Rubenstein JL. Inverse cancer comorbidity: a serendipitous opportunity to gain insight into CNS disorders. Nat. Rev. Neurosci. 2013;14:293–304. doi: 10.1038/nrn3464. [DOI] [PubMed] [Google Scholar]
- 6.Tabarés-Seisdedos R, et al. No paradox, no progress: inverse cancer comorbidity in people with other complex diseases. Lancet. Oncol. 2011;12:604–8. doi: 10.1016/S1470-2045(11)70041-9. [DOI] [PubMed] [Google Scholar]
- 7.Lehrer S. Glioblastoma and dementia may share a common cause. Med. Hypotheses. 2010;75:67–68. doi: 10.1016/j.mehy.2010.01.031. [DOI] [PubMed] [Google Scholar]
- 8.Driver JA, et al. Inverse association between cancer and Alzheimer’s disease: results from the Framingham Heart Study. BMJ. 2012;344:e1442. doi: 10.1136/bmj.e1442. [DOI] [PMC free article] [PubMed] [Google Scholar]
- 9.Musicco M, et al. Inverse occurrence of cancer and Alzheimer disease: a population-based incidence study. Neurology. 2013;81:322–8. doi: 10.1212/WNL.0b013e31829c5ec1. [DOI] [PubMed] [Google Scholar]
- 10.Ou S-M, et al. Does Alzheimer’s disease protect against cancers? A nationwide population-based study. Neuroepidemiology. 2013;40:42–9. doi: 10.1159/000341411. [DOI] [PubMed] [Google Scholar]
- 11.Tabarés-Seisdedos, R. & Baudot, A. Editorial: Direct and Inverse Comorbidities Between Complex Disorders. Front. Physiol7 (2016). [DOI] [PMC free article] [PubMed]
- 12.Ibáñez K, Boullosa C, Tabarés-Seisdedos R, Baudot A, Valencia A. Molecular evidence for the inverse comorbidity between central nervous system disorders and cancers detected by transcriptomic meta-analyses. PLoS Genet. 2014;10:e1004173. doi: 10.1371/journal.pgen.1004173. [DOI] [PMC free article] [PubMed] [Google Scholar]
- 13.Subramanian A, et al. Gene set enrichment analysis: a knowledge-based approach for interpreting genome-wide expression profiles. Proc. Natl. Acad. Sci. USA. 2005;102:15545–50. doi: 10.1073/pnas.0506580102. [DOI] [PMC free article] [PubMed] [Google Scholar]
- 14.Lonsdale J, et al. The Genotype-Tissue Expression (GTEx) project. Nat. Genet. 2013;45:580–585. doi: 10.1038/ng.2653. [DOI] [PMC free article] [PubMed] [Google Scholar]
- 15.Reimand J, Kull M, Peterson H, Hansen J, Vilo J. g:Profiler–a web-based toolset for functional profiling of gene lists from large-scale experiments. Nucleic Acids Res. 2007;35:W193–200. doi: 10.1093/nar/gkm226. [DOI] [PMC free article] [PubMed] [Google Scholar]
- 16.Hidalgo CA, Blumm N, Barabási A-L, Christakis NA. A Dynamic Network Approach for the Study of Human Phenotypes. PLoS Comput. Biol. 2009;5:e1000353. doi: 10.1371/journal.pcbi.1000353. [DOI] [PMC free article] [PubMed] [Google Scholar]
- 17.Bahn S, et al. Gene expression profiling in the post-mortem human brain–no cause for dismay. J. Chem. Neuroanat. 2001;22:79–94. doi: 10.1016/S0891-0618(01)00099-0. [DOI] [PubMed] [Google Scholar]
- 18.Li JZ, et al. Systematic changes in gene expression in postmortem human brains associated with tissue pH and terminal medical conditions. Hum. Mol. Genet. 2004;13:609–16. doi: 10.1093/hmg/ddh065. [DOI] [PubMed] [Google Scholar]
- 19.Tomita H, et al. Effect of agonal and postmortem factors on gene expression profile: quality control in microarray analyses of postmortem human brain. Biol. Psychiatry. 2004;55:346–352. doi: 10.1016/j.biopsych.2003.10.013. [DOI] [PMC free article] [PubMed] [Google Scholar]
- 20.Bruna J, Miró J, Velasco R. Epilepsy in glioblastoma patients: basic mechanisms and current problems in treatment. Expert Rev. Clin. Pharmacol. 2013;6:333–344. doi: 10.1586/ecp.13.12. [DOI] [PubMed] [Google Scholar]
- 21.Schouten LJ, Rutten J, Huveneers HAM, Twijnstra A. Incidence of brain metastases in a cohort of patients with carcinoma of the breast, colon, kidney, and lung and melanoma. Cancer. 2002;94:2698–705. doi: 10.1002/cncr.10541. [DOI] [PubMed] [Google Scholar]
- 22.Nayak L, Lee EQ, Wen PY. Epidemiology of brain metastases. Curr. Oncol. Rep. 2012;14:48–54. doi: 10.1007/s11912-011-0203-y. [DOI] [PubMed] [Google Scholar]
- 23.Takahashi K, Takahashi F, Hirama M, Tanabe KK, Fukuchi Y. Restoration of CD44S in non-small cell lung cancer cells enhanced their susceptibility to the macrophage cytotoxicity. Lung Cancer. 2003;41:145–53. doi: 10.1016/S0169-5002(03)00224-1. [DOI] [PubMed] [Google Scholar]
- 24.Yoshida T, Matsuda Y, Naito Z, Ishiwata T. CD44 in human glioma correlates with histopathological grade and cell migration. Pathol. Int. 2012;62:463–70. doi: 10.1111/j.1440-1827.2012.02823.x. [DOI] [PubMed] [Google Scholar]
- 25.Akiyama H, Tooyama I, Kawamata T, Ikeda K, McGeer PL. Morphological diversities of CD44 positive astrocytes in the cerebral cortex of normal subjects and patients with Alzheimer’s disease. Brain Res. 1993;632:249–59. doi: 10.1016/0006-8993(93)91160-T. [DOI] [PubMed] [Google Scholar]
- 26.Uberti D, et al. Increased CD44 gene expression in lymphocytes derived from Alzheimer disease patients. Neurodegener. Dis. 2010;7:143–7. doi: 10.1159/000289225. [DOI] [PubMed] [Google Scholar]
- 27.Goto Y, et al. UCHL1 provides diagnostic and antimetastatic strategies due to its deubiquitinating effect on HIF-1α. Nat. Commun. 2015;6:6153. doi: 10.1038/ncomms7153. [DOI] [PMC free article] [PubMed] [Google Scholar]
- 28.Deighton RF, et al. The proteomic response in glioblastoma in young patients. J. Neurooncol. 2014;119:79–89. doi: 10.1007/s11060-014-1474-6. [DOI] [PMC free article] [PubMed] [Google Scholar]
- 29.Takami Y, et al. Ubiquitin carboxyl-terminal hydrolase L1, a novel deubiquitinating enzyme in the vasculature, attenuates NF-kappaB activation. Arterioscler. Thromb. Vasc. Biol. 2007;27:2184–90. doi: 10.1161/ATVBAHA.107.142505. [DOI] [PubMed] [Google Scholar]
- 30.Zhang M, Cai F, Zhang S, Zhang S, Song W. Overexpression of ubiquitin carboxyl-terminal hydrolase L1 (UCHL1) delays Alzheimer’s progression in vivo. Sci. Rep. 2014;4:7298. doi: 10.1038/srep07298. [DOI] [PMC free article] [PubMed] [Google Scholar]
- 31.Moreira PI, Carvalho C, Zhu X, Smith MA, Perry G. Mitochondrial dysfunction is a trigger of Alzheimer’s disease pathophysiology. Biochim. Biophys. Acta. 2010;1802:2–10. doi: 10.1016/j.bbadis.2009.10.006. [DOI] [PubMed] [Google Scholar]
- 32.Upadhya SC, Hegde AN. Role of the ubiquitin proteasome system in Alzheimer’s disease. BMC Biochem. 2007;8(Suppl 1):S12. doi: 10.1186/1471-2091-8-S1-S12. [DOI] [PMC free article] [PubMed] [Google Scholar]
- 33.Liang WS, et al. Alzheimer’s disease is associated with reduced expression of energy metabolism genes in posterior cingulate neurons. Proc. Natl. Acad. Sci. USA. 2008;105:4441–6. doi: 10.1073/pnas.0709259105. [DOI] [PMC free article] [PubMed] [Google Scholar]
- 34.Maruszak A, Żekanowski C. Mitochondrial dysfunction and Alzheimer’s disease. Prog. Neuropsychopharmacol. Biol. Psychiatry. 2011;35:320–30. doi: 10.1016/j.pnpbp.2010.07.004. [DOI] [PubMed] [Google Scholar]
- 35.Silva DFF, Esteves AR, Oliveira CR, Cardoso SM. Mitochondria: the common upstream driver of amyloid-β and tau pathology in Alzheimer’s disease. Curr. Alzheimer Res. 2011;8:563–72. doi: 10.2174/156720511796391872. [DOI] [PubMed] [Google Scholar]
- 36.Saharan S, Mandal PK. The emerging role of glutathione in Alzheimer’s disease. J. Alzheimers. Dis. 2014;40:519–29. doi: 10.3233/JAD-132483. [DOI] [PubMed] [Google Scholar]
- 37.Blair SL, et al. Glutathione metabolism in patients with non-small cell lung cancers. Cancer Res. 1997;57:152–5. [PubMed] [Google Scholar]
- 38.Manolopoulos KN, Klotz L-O, Korsten P, Bornstein SR, Barthel A. Linking Alzheimer’s disease to insulin resistance: the FoxO response to oxidative stress. Mol. Psychiatry. 2010;15:1046–52. doi: 10.1038/mp.2010.17. [DOI] [PubMed] [Google Scholar]
- 39.Maekawa T, et al. Expression and localization of FOXO1 in non-small cell lung cancer. Oncol. Rep. 2009;22:57–64. [PubMed] [Google Scholar]
- 40.Essers MAG, et al. FOXO transcription factor activation by oxidative stress mediated by the small GTPase Ral and JNK. EMBO J. 2004;23:4802–12. doi: 10.1038/sj.emboj.7600476. [DOI] [PMC free article] [PubMed] [Google Scholar]
- 41.Ho KK, Myatt SS, Lam EW-F. Many forks in the path: cycling with FoxO. Oncogene. 2008;27:2300–11. doi: 10.1038/onc.2008.23. [DOI] [PubMed] [Google Scholar]
- 42.Coppedè F, Migliore L. DNA damage and repair in Alzheimer’s disease. Curr. Alzheimer Res. 2009;6:36–47. doi: 10.2174/156720509787313970. [DOI] [PubMed] [Google Scholar]
- 43.Cron KR, et al. Proteasome inhibitors block DNA repair and radiosensitize non-small cell lung cancer. PLoS One. 2013;8:e73710. doi: 10.1371/journal.pone.0073710. [DOI] [PMC free article] [PubMed] [Google Scholar]
- 44.Shokolenko I, Venediktova N, Bochkareva A, Wilson GL, Alexeyev MF. Oxidative stress induces degradation of mitochondrial DNA. Nucleic Acids Res. 2009;37:2539–48. doi: 10.1093/nar/gkp100. [DOI] [PMC free article] [PubMed] [Google Scholar]
- 45.Zismanov V, Drucker L, Gottfried M. Combined inhibition of Hsp90 and the proteasome affects NSCLC proteostasis and attenuates cell migration. Anticancer. Drugs. 2014;25:998–1006. doi: 10.1097/CAD.0000000000000140. [DOI] [PubMed] [Google Scholar]
- 46.Cabeza-Arvelaiz Y, Schiestl RH. Transcriptome analysis of a rotenone model of parkinsonism reveals complex I-tied and -untied toxicity mechanisms common to neurodegenerative diseases. PLoS One. 2012;7:e44700. doi: 10.1371/journal.pone.0044700. [DOI] [PMC free article] [PubMed] [Google Scholar]
- 47.Catalá-López F, et al. Inverse and direct cancer comorbidity in people with central nervous system disorders: a meta-analysis of cancer incidence in 577,013 participants of 50 observational studies. Psychother. Psychosom. 2014;83:89–105. doi: 10.1159/000356498. [DOI] [PubMed] [Google Scholar]
- 48.Ong ELH, Goldacre R, Goldacre M. Differential risks of cancer types in people with Parkinson’s disease: a national record-linkage study. Eur. J. Cancer. 2014;50:2456–62. doi: 10.1016/j.ejca.2014.06.018. [DOI] [PubMed] [Google Scholar]
- 49.Serrano J, Fernández AP, Martínez-Murillo R, Martínez A. High sensitivity to carcinogens in the brain of a mouse model of Alzheimer’s disease. Oncogene. 2010;29:2165–71. doi: 10.1038/onc.2009.503. [DOI] [PubMed] [Google Scholar]
- 50.Brennan CW, et al. The Somatic Genomic Landscape of Glioblastoma. Cell. 2013;155:462–477. doi: 10.1016/j.cell.2013.09.034. [DOI] [PMC free article] [PubMed] [Google Scholar]
- 51.Racker, E. Bioenergetics and the problem of tumor growth. Am. Sci. 60, 56–63. [PubMed]
- 52.Atamna H, Kumar R. Protective role of methylene blue in Alzheimer’s disease via mitochondria and cytochrome c oxidase. J. Alzheimers. Dis. 2010;20(Suppl 2):S439–52. doi: 10.3233/JAD-2010-100414. [DOI] [PubMed] [Google Scholar]
- 53.Poteet E, et al. Reversing the Warburg effect as a treatment for glioblastoma. J. Biol. Chem. 2013;288:9153–64. doi: 10.1074/jbc.M112.440354. [DOI] [PMC free article] [PubMed] [Google Scholar]
- 54.Pathak D, et al. The Role of Mitochondrially Derived ATP in Synaptic Vesicle Recycling. J. Biol. Chem. 2015;290:22325–36. doi: 10.1074/jbc.M115.656405. [DOI] [PMC free article] [PubMed] [Google Scholar]
- 55.Stewart CR, et al. CD36 ligands promote sterile inflammation through assembly of a Toll-like receptor 4 and 6 heterodimer. Nat. Immunol. 2010;11:155–61. doi: 10.1038/ni.1836. [DOI] [PMC free article] [PubMed] [Google Scholar]
- 56.Miklossy J. Chronic inflammation and amyloidogenesis in Alzheimer’s disease–role of Spirochetes. J. Alzheimers. Dis. 2008;13:381–91. doi: 10.3233/JAD-2008-13404. [DOI] [PubMed] [Google Scholar]
- 57.Deleidi M, Isacson O. Viral and inflammatory triggers of neurodegenerative diseases. Sci. Transl. Med. 2012;4:121ps3. doi: 10.1126/scitranslmed.3003492. [DOI] [PMC free article] [PubMed] [Google Scholar]
- 58.Lu H, Ouyang W, Huang C. Inflammation, a key event in cancer development. Mol. Cancer Res. 2006;4:221–33. doi: 10.1158/1541-7786.MCR-05-0261. [DOI] [PubMed] [Google Scholar]
- 59.Solinas G, Germano G, Mantovani A, Allavena P. Tumor-associated macrophages (TAM) as major players of the cancer-related inflammation. J. Leukoc. Biol. 2009;86:1065–73. doi: 10.1189/jlb.0609385. [DOI] [PubMed] [Google Scholar]
- 60.Ritchie ME, et al. limma powers differential expression analyses for RNA-sequencing and microarray studies. Nucleic Acids Res. 2015;43:e47. doi: 10.1093/nar/gkv007. [DOI] [PMC free article] [PubMed] [Google Scholar]
- 61.McCall MN, Jaffee HA, Irizarry RA. fRMA ST: frozen robust multiarray analysis for Affymetrix Exon and Gene ST arrays. Bioinformatics. 2012;28:3153–4. doi: 10.1093/bioinformatics/bts588. [DOI] [PMC free article] [PubMed] [Google Scholar]
- 62.Ashburner M, et al. Gene ontology: tool for the unification of biology. The Gene Ontology Consortium. Nat. Genet. 2000;25:25–9. doi: 10.1038/75556. [DOI] [PMC free article] [PubMed] [Google Scholar]
- 63.Ramanan VK, Shen L, Moore JH, Saykin AJ. Pathway analysis of genomic data: concepts, methods, and prospects for future development. Trends Genet. 2012;28:323–32. doi: 10.1016/j.tig.2012.03.004. [DOI] [PMC free article] [PubMed] [Google Scholar]
- 64.Matthews L, et al. Reactome knowledgebase of human biological pathways and processes. Nucleic Acids Res. 2009;37:D619–22. doi: 10.1093/nar/gkn863. [DOI] [PMC free article] [PubMed] [Google Scholar]
- 65.McCall MN, Bolstad BM, Irizarry RA. Frozen robust multiarray analysis (fRMA) Biostatistics. 2010;11:242–253. doi: 10.1093/biostatistics/kxp059. [DOI] [PMC free article] [PubMed] [Google Scholar]
- 66.Ramasamy A, Mondry A, Holmes CC, Altman DG. Key issues in conducting a meta-analysis of gene expression microarray datasets. PLoS Med. 2008;5:e184. doi: 10.1371/journal.pmed.0050184. [DOI] [PMC free article] [PubMed] [Google Scholar]
- 67.Gautier L, Cope L, Bolstad BM, Irizarry R. A. affy–analysis of Affymetrix GeneChip data at the probe level. Bioinformatics. 2004;20:307–15. doi: 10.1093/bioinformatics/btg405. [DOI] [PubMed] [Google Scholar]
- 68.Wang X, et al. An R package suite for microarray meta-analysis in quality control, differentially expressed gene analysis and pathway enrichment detection. Bioinformatics. 2012;28:2534–6. doi: 10.1093/bioinformatics/bts485. [DOI] [PMC free article] [PubMed] [Google Scholar]
- 69.Khaitovich P. Regional Patterns of Gene Expression in Human and Chimpanzee Brains. Genome Res. 2004;14:1462–1473. doi: 10.1101/gr.2538704. [DOI] [PMC free article] [PubMed] [Google Scholar]
- 70.Tan PPC, French L, Pavlidis P. Neuron-Enriched Gene Expression Patterns are Regionally Anti-Correlated with Oligodendrocyte-Enriched Patterns in the Adult Mouse and Human Brain. Front. Neurosci. 2013;7:5. doi: 10.3389/fnins.2013.00005. [DOI] [PMC free article] [PubMed] [Google Scholar]
- 71.Iorio F, et al. Discovery of drug mode of action and drug repositioning from transcriptional responses. Proc. Natl. Acad. Sci. 2010;107:14621–14626. doi: 10.1073/pnas.1000138107. [DOI] [PMC free article] [PubMed] [Google Scholar]
Associated Data
This section collects any data citations, data availability statements, or supplementary materials included in this article.