Abstract
The study of the cancer–immune system is important for understanding tumorigenesis and the development of cancer and immunotherapy. In this work, we build a comprehensive cancer–immune model including both cells and cytokines to uncover the underlying mechanism of cancer immunity based on landscape topography. We quantify three steady-state attractors, normal state, low cancer state and high cancer state, for the innate immunity and adaptive immunity of cancer. We also illustrate the cardinal inhibiting cancer immunity interactions and promoting cancer immunity interactions through global sensitivity analysis. We simulate tumorigenesis and the development of cancer and classify these into six stages. The characteristics of the six stages can be classified further into three groups. These correspond to the escape, elimination and equilibrium phases in immunoediting, respectively. Under specific cell–cell interactions strength oscillations emerge. We found that tumorigenesis and cancer recovery processes may need to go through cancer–immune oscillation, which consumes more energy. Based on the cancer–immune landscape, we predict three types of cells and two types of cytokines for cancer immunotherapy as well as combination immunotherapy. This landscape framework provides a quantitative way to understand the underlying mechanisms of the interplay between cancer and the immune system for cancer tumorigenesis and development.
Keywords: potential landscape, cancer–immune network, tumorigenesis, cancer development
1. Introduction
The immune system is a complex one which protects against disease, for example, by eliminating tumour cells. When tumour cell antigens are detected by the immune system this leads to the innate immune response and the adaptive immune response, both of which are involved in many types of immune cells and cytokines [1]. However, during tumorigenesis and progression, cancer can lead to dysfunction of the immune system. The immune system can then become an accomplice through chronic inflammation [2]. This leads to two hallmarks of cancer immunity, avoiding immune destruction and tumour-promoting inflammation [3]. The functions of the immune system during cancer development are complicated, thus studying the underlying mechanisms between cancer and the immune system is important for understanding cancer and cancer therapy. Recent studies on immune vaccines suggest that it is crucial to find an effective immune therapy [4].
Mathematical models are useful and effective for describing intricate systems such as the tumour immune microenvironment. Many immunity models have been studied. In [5], a few spatially homogeneous mechanistic mathematical models were reviewed, and a summary of different models from single-variable to multi-variable models is given. The relationship between the immune response and cancer aggressiveness was studied through a specific model. Tumour and immune cells were studied with an exosome exchange model to assess the effectiveness of different therapeutic protocols [6]. Besides cancer mechanistic studies, mathematic models are also used to study immune cell vaccines [7]. Although many immune models have been built using ordinary differential equations (ODEs), a comprehensive immune model including both immune cells and cytokines for cancer from a biological network perspective has not yet been established.
Quantitative analysis of a circuit or complex network is important for characterizing biological processes and their underlying mechanisms. These can be quantitatively studied physically and globally through the landscape and flux theory of non-equilibrium dynamic systems [8–10]. The theory has been applied to different fields, including gene regulation networks [9,11–14], neural networks [15,16], metabolism pathways [17], signalling networks [18], evolution [19] and ecology [20]. However, it is still challenging to reveal the underlying mechanism between cancer and the immune system.
In this work, we build comprehensive cancer–immune networks by collecting data from the experimental literature [21–36]. The network includes cancer cells, 12 types of immune cells and 13 types of cytokines. The network involves cell–cell interactions, cytokine–cell interactions and cell–cytokine production. We have analysed the immune network quantitatively. Three steady-state basins of attractor, normal state, low cancer state and high cancer state emerge based on the landscape topography. Along with cancer development and evolution, the landscape presents different characteristics corresponding to the different phases in immunoediting [37]. We also uncover the emergence and origin of cancer–immune oscillations. Important immunotherapy targets are predicted, including three types of immune cells and two types of cytokines.
2. Results
2.1. Cancer–immune system network modelling
Different cancer types are influenced by immune cells and cytokines differently. For example, CD8+ T cells (CD8+) attack MHC-I-positive tumour cells, while natural killer (NK) cells attack tumour cells with MCH-I loss or downregulation [38]. Here, in our model, we consider tumour cells to be heterogeneous. The network includes cell–cell interactions, cytokine–cell interactions and cell–cytokine production. All these relationships are from previous experimental studies [21–36]. The cancer–immune network includes cancer cells, T helper cells (Th1, Th2 and Th17), macrophage cells (M1 and M2), tumour-associated neutrophil cells (TAN), myeloid-derived suppressor cells (MDSCs), CD8+, regulatory T cells (Treg), dendritic cells (mature dendritic cells and immature dendritic cells) and NK cells as well as 13 related cytokines, interleukin (IL)-2, IL-4, IL-6, IL-8, IL-10, IL-12, IL-13, IL-17, IL-21, IL-23, interferon (IFN)-γ, transforming growth factor (TGF)-β and tumour necrosis factor (TNF)-α with a total of 26 nodes. The interactions among the nodes are listed in the electronic supplementary material, table S1.
We chose representative immune cells and their associated cytokines closely related to cancer cells for the immune response from the existing literature. We also selected the regulations among these cancer cells, immune cells and cytokines from the literature search.
Dendritic cells (mDCs) are antigen-presenting cells of the immune system. They trigger the adaptive responses when detecting antigens from cancer cells. Immature dendritic cells (iDCs) have been considered suppressive and tolerogenic to cancer immunity [32]. NK cells and CD8+ are the main effective killer cells for the innate immune response and the adaptive immune response, respectively. T helper cells are central to the development of an immune response by activating antigen-specific effector cells and recruiting cells of the innate immune system. Th1 cells activate antigen-presenting cells (APCs) and induce the production of the type of antibodies that can enhance the chances of cancer cells turning into APCs. However, the Th2 response triggered by cancer promotes the growth of cancer cells [34]. Th17 cells play a potent proinflammatory role in cancer microenvironments [25]. M1 plays a classic role in the Th1 response and in mediating resistance against cancer cells. M2 takes part in the inflammatory process [23]. In addition, TAN plays an important role in tumour growth and progression [23].
It is evident that immune responses in cancer are negatively regulated by immunosuppressive cells (Treg) and MDSCs [28]. Cytokines are produced by the cells and regulate other cells through activation or repression. Cytokines can thus mediate the cell–cell interactions. The different cytokines are chosen according to different cell types for the network building. The whole network is shown in figure 1.
Figure 1.
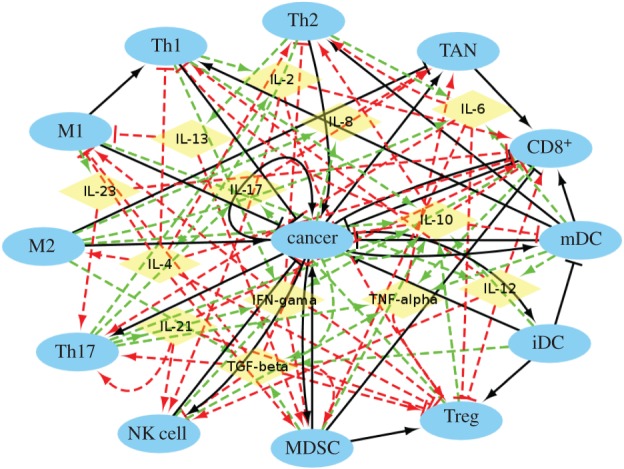
The cancer–immune system. The network includes 26 nodes and 107 interaction links. Cerulean ellipses represent cells and yellow diamonds represent cytokines. Black solid arrows and bars represent cell–cell activation and inhibition, respectively. Red dashed arrows and bars represent cytokine–cell activation and inhibition, respectively. Green dashed arrows represent cell–cytokine production.
For the major cell–cell interactions, Th1 inhibits cancer cells by activating the APCs, while Th2 activates cancer cells by promoting their proliferation. M1 activates Th1 and inhibits cancer cells. M2 activates cancer cells through an inflammatory process [23]. CD8+, Th1 and Th2 are activated by mDCs. Accumulation of iDCs inhibits mDC proliferation and activates Treg through stimulating its proliferation [26]. TAN activates CD8+ by enhancing proliferation [33]. The cancer cells and MDSCs form a positive feedback loop through PGE2 and COX-2. MDSCs activate Treg by inducing its expansion through the ARG1 pathway. MDSCs inhibit the CD8+ response [28]. NK cells and CD8+ inhibit cancer cells as effective killers. The cancer->cancer interaction does not just refer to the cancer growth by itself. It can be activated by the self-production of cytokines, such as IL-1 [34], which is not included in the cancer–immune network in order to avoid redundancy.
For the major cytokine–cell interactions, Th1 is mainly activated by IL-2. Th2 is mainly activated by IL-4. IL-12 activates NK cells and CD8+. NK cells and MDSCs are mainly activated by IL-17 [21,25]. Th17 is mainly activated by IL-21 and IL-23 through triggering expansion [25]. M1 is mainly activated by IFN-γ [34]. For the main cytokine production, IL-17 is mainly produced by Th17 [21]. TGF-β leads to cancer proliferation [28]. Owing to the complexity of the network for viewing the whole map clearly, we also display only the cell–cell interactions in figure 2.
Figure 2.
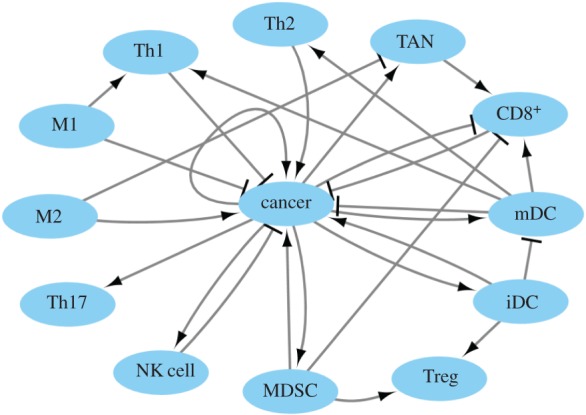
The cancer–immune system for cell–cell interactions. Black arrows represent cell–cell activation. Black bars represent cell–cell inhibition.
The driving forces of the dynamics for the cell or cytokine concentrations are determined as
 |
2.1 |
 |
2.2 |
 |
2.3 |
 |
2.4 |
 |
2.5 |
where F represents the driving force of the variable X, the effector cell concentration or the cytokine concentration. The characteristics of cell–cell and cytokine–cell interactions are different from those of cell–cytokine production. Equation (2.1) is used for cell–cell and cytokine–cell interactions, while equation (2.2) is used for cell–cytokine production. In equation (2.1), X represents the effector cell concentration, and A represents the basic production rate of the cell concentration. In equation (2.2), X represents the cytokine concentration, and A represents the maximum production rate of the cytokine concentration in the immune microenvironment. D represents the degradation rate of the cells or cytokine concentration and S represents the threshold with half concentration production. The parameter n is the Hill coefficient for describing the cooperativity of the interactions. The positive parameter γji represents the activation of Xi from Xj if γ > 1 and inhibition if γ < 1. The Hill function was used for presenting cell–cell interactions and cytokine–cell interactions in [39,40]. For cell–cell or cytokine–cell interactions, Hji is the summation of the two Hill functions, the inhibition term and the activation term. When γ > 1, equation (2.3) can be converted into equation (2.4), and the activation term (only the second term) is effective. Conversely, when γ < 1, equation (2.3) can be converted into equation (2.5), and only the inhibition term is effective. Owing to the saturation effects of the immune response [40], the Hill function Hji is used to approximately represent the cell production rate change upon interacting with other cells or cytokines in our model. This is because the immune cells communicate through surface receptors and the regulation is saturated due to the limit in the quantity of the surface receptors. The product of Hji represents the combined effect of both the cell–cell and cytokine–cell interactions. For the cell–cytokine production, the whole production is described by the summation of the Hill functions. Michaelis–Menten form is used to describe cell–cytokine interactions with limited production of cytokines [40]. We consider that the maximum production rate in the cancer microenvironment is limited, because the cytokines generated from the cancer microenvironment diffuse to a healthy part of the tissue. Every Michaelis–Menten term in equation (2.2) represents the contribution of the production rate for every related cell. Each type of cytokine produces the total maximum production rate A. Specifically, the term Hji used for multiplying DiXi in equation (2.1) is only for interactions on cancer cells from NK cells and CD8+. Because the NK cells and CD8+ are killer cells corresponding to the innate immune system and the adaptive immune system, respectively, the inhibiting mechanism promotes the decay of cancer cells.
The parameters for this cancer–immune model are chosen carefully to produce results that are biologically relevant and reasonable. For example, the decay rate is set according to the death rates for most types of cells. We also take into consideration the differences in activation or inhibition strengths between cell types and in order to reasonably describe the interactions in the cancer–immune system according to the previous experimental studies. For example, both IL-4 and IL-6 promote Th2, and it is mainly triggered by IL-4 [36], thus we set the IL-4->Th2 activation regulation strength much higher than the IL-6->Th2 activation regulation strength. For other interactions lacking such information we just set the regulations at the same level. The interaction strengths and corresponding references are listed in the electronic supplementary material, table S2.
2.2. Landscape of cancer innate and adaptive immunity
The landscape of the cancer–immune system can be obtained through the self-consistent mean field approximation of the corresponding probabilistic evolution equation. The landscape U =−ln(Pss), where U is defined as the landscape and is directly related to Pss, which represents the steady-state probability distribution of the concentration variables.
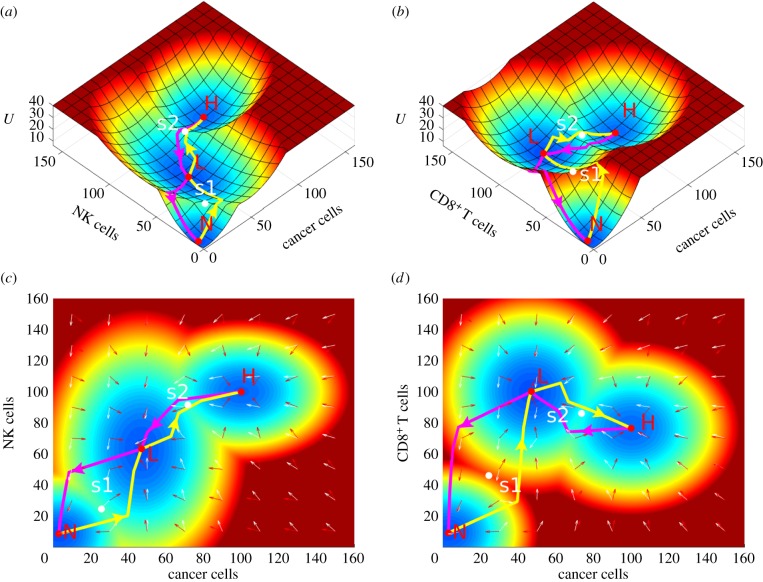
The ODEs of the cancer–immune system includes 26 variables. It is difficult to visualize the landscape in 26 dimensions. We chose two dimensions to display by integrating over other dimensions. We chose effective killer cells and the cancer cell as the two-dimensional variables. The immune system includes the innate immune system and the adaptive immune system. The innate immune system gives an immediate and non-specific response to the pathogens, while the adaptive system resorts to APCs, such as dendritic cells for responding, and is highly specific to a particular pathogen. The main effective killer cells of the innate immune system are NK cells and the main effective killer cells of the adaptive immune system are CD8+. In order to show the different characteristics between the innate immune system and the adaptive immune system, cancer cells with NK cells and with CD8+ are separately chosen for landscape display. Three steady-state attractors, normal state (N), low cancer state (L) and high cancer state (H), emerge as shown in figure 3. The red region represents high potential, while the blue region represents low potential. Between the two steady-state attractors, there is a saddle which is coloured white in figure 3. We define the saddle between the normal state and the low cancer state as s1 and the saddle between the low cancer state and the high cancer state as s2.
Figure 3.
The landscape of the cancer innate immune and adaptive immune system. The cancer innate immune system is depicted by cancer cells and NK cells in (a,c). The cancer adaptive immune system is depicted by cancer cells and CD8+ in (b,d). N, normal state; L, low cancer state; H, high cancer state; s1, saddle between the normal state and the low cancer state; s2, saddle between the normal state and the high cancer state. The yellow arrows represent the paths from N to L and from L to H, and the magenta arrows represent the paths from H to L and from L to N. The white arrows represent the directions of probability flux, and the red arrows represent the directions of the negative gradient of potential energy. (c,d) Same landscape in two dimensions for (a,b), respectively.
The landscape of the innate immune variable is displayed in figure 3a,c, whereas the adaptive immune variable is shown in figure 3b,d. The landscape characteristics of the innate immune and the landscape characteristics of the adaptive immune variables are not the same. In the normal state (N), cancer cells, NK cells and CD8+ are all at very small concentrations (near zero). For the innate immune response, the NK cells are at low (high) level with respect to the low (high) cancer state. On the other hand, for the adaptive immune response, the CD8+ are at high (low) level with respect to the low (high) cancer state. The result on the adaptive response is also observed in other immune models [41]. This suggests that, at the high cancer state, the adaptive immune response is inhibited by cancer cells.
To study the transition processes among steady-state attractors, we calculated the dominant paths among different attractors by minimizing the transition actions. The dominant paths are shown on the landscape (figure 3b,d). The yellow arrows (from the N (normal) state to the L (low cancer) state and from the L state to the H (high cancer) state) represent tumorigenesis and the transition to a high cancer state, while the magenta arrows (from the H state to the L state and from the L state to the N state) represent cancer recovery. We also show the steady-state probability flux of the cancer–immune system on the landscape in figure 3c,d. The white and red arrows, respectively, represent the direction of probability flux and the negative gradient of the potential energy. The dynamics of the cancer–immune system is determined by both the gradient of the potential and the probability flux. The force from the steady-state probability flux leads the dominant paths of the system to deviate from the conventionally expected potential gradient paths. As we can see the two dominant paths are different from each other: cancer tumorigenesis/transition to the high cancer state and cancer recovery are irreversible.
2.3. Global sensitivity analysis of the cancer immunity model
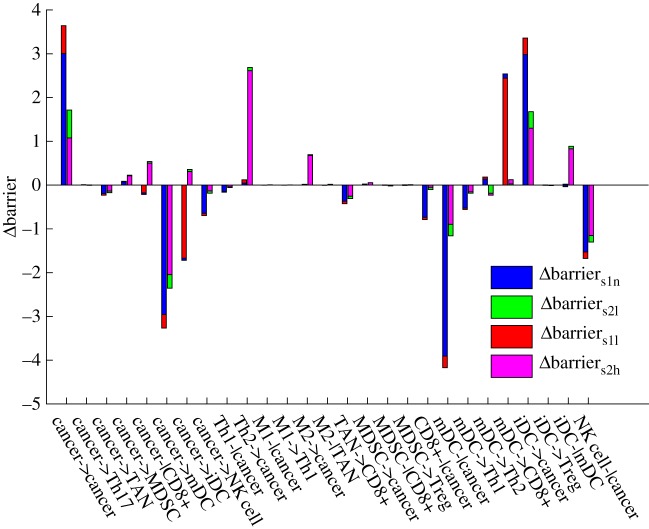
We define the potential between the saddle and the steady-state attractor as the barrier height. This represents the ability to switch from one steady-state attractor to another. According to figure 4, we can quantify the barrier between s1 and the normal steady state (barriers1n), the barrier between s1 and the low cancer steady state (barriers1l), the barrier between s2 and the low cancer steady state (barriers2l) and the barrier between s2 and the high cancer steady state (barriers2h). Each of the 27 cell–cell interaction parameters is increased by 10% for perturbing the network, leading to changes in the respective barrier. As shown in figure 4, every group has four barrier changes for each parameter change. We considered that the regulation parameters changes for promoting the low cancer state and inhibiting the normal state if the barrier changes of the low cancer state are larger than those of the normal state, because the low cancer state becomes more stable or less unstable compared with the normal state. In the same sense, the regulation parameter changes are for promoting the high cancer state and inhibiting the low cancer state if the barrier changes of the high cancer state are larger than those of the low cancer state.
Figure 4.
Global sensitivity analysis for the 27 cell–cell interactions. The x-axis represents the 27 cell–cell interactions. The y-axis represents the barrier changes. Each parameter is increased by 10% individually. Δbarriers1n, the change of barrier between s1 and the normal steady state. Δbarriers1l, the change of barrier between s1 and the low cancer state. ΔBarriers2l, the change of barrier between s2 and the low cancer steady state. ΔBarriers2h, the change of barrier between s2 and the high cancer steady state.
Interestingly, all of these regulation parameters change for either promoting the low cancer steady state, or promoting the normal state and high cancer state but not both. The cell–cell interactions promoting the low cancer state are cancer->cancer, cancer->MDSC, cancer-|CD8+, cancer->iDC, Th2->cancer, M2->cancer, M2-|TAN, MDSC->cancer, mDC->Th2, iDC->cancer, iDC->Treg and iDC-|mDC, most of which that inhibit cancer immunity were reported in [29,42–45]. The cell–cell interactions inhibiting the low cancer state, cancer->Th17, cancer->TAN, cancer->mDC, cancer->NK cell, Th1-|cancer, M1-|cancer, M1->Th1, TAN->CD8+, MDSC-|CD8+, MDSC->Treg, CD8+-|cancer, mDC-|cancer, mDC->Th1, mDC->CD8+ and NK cell-|cancer, were reported to show a trend of promoting cancer immunity [46–49]. This indicates that the low cancer state switches to the normal state or high cancer state under promoting cancer immunity. It perhaps implies that the underlying immune pressure is the force driving the low cancer state to the high cancer state. This means cancer cells have to die or evolve to the high cancer state in the cancer–immune system.
The low cancer steady state is thus used to characterize cancer immunity. From the global sensitivity analysis, we explore the barrier changes of the low cancer state and the normal state in figure 4. A greater difference in barrier change values means more influence by the cell–cell interactions with respect to the parameter changes. The cardinal inhibiting cancer immunity interactions are cancer->cancer and iDC->cancer, while the cardinal promoting cancer immunity interactions are cancer->mDC, mDC-|cancer, NK cell-|cancer and mDC->CD8+.
2.4. Quantification of normal and cancer state kinetic switching
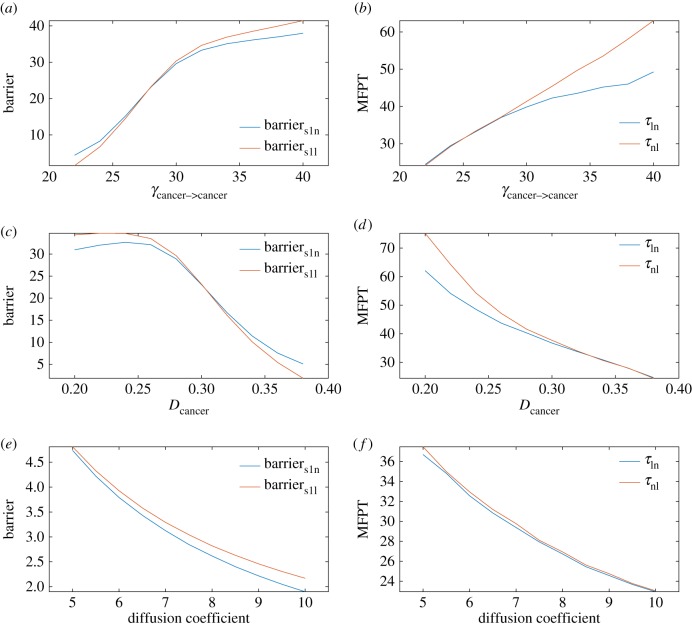
For these cardinal interactions, we chose cancer->cancer for further analysis as an example, because cancer cells are heterogeneous and cancer->cancer strength varies largely. The decay rate of cancer (Dcancer) is also varied. The barrier can be used to measure the ability to switch from one attractor to another. The mean first passage time (MFPT) is defined as the average transition time from one attractor to another. It is also used to measure the ability to switch. For example, if the MFPT from the normal state to the low cancer state (τnl) is longer than the adverse transition (τln), the system prefers to stay in the normal state, which means there is less probability of encountering cancer. The barrier and MFPT calculations along with the γcancer-> cancer (cancer–cancer cell interations) or Dcancer changes are shown in figure 5a–d. This figure shows that when γcancer-> cancer is increased or Dcancer is decreased, barriers1n, barriern1s, τln and τnl all increase. This suggests that the normal state and low cancer state both become more stable. It is interesting that the normal state becomes more stable when γcancer-> cancer is increased or Dcancer is decreased. This may imply that cancer cells without immunity change will not lead to transitions between the normal state and the low cancer state. Figure 5e,f shows the landscape results when fluctuations characterized by the diffusion coefficient (noise level) are changed. This shows that, when the diffusion coefficient is increased, barriers1n, barriern1s, τln and τnl all decrease. The normal state and low cancer state both become less stable. This suggests that, as the noise goes up, the transitions between the normal state and the low cancer state become easier.
Figure 5.
(a–f) The barrier and MFPT results when γcancer->cancer, Dcancer as well as the diffusion coefficient change; Barriers1n, the barrier between s1 and the normal state. Barriers1l, the barrier between s1 and the low cancer state. τln, the mean first passage time from the low cancer state to the normal state. τnl, the mean first passage time from the normal state to the low cancer state.
2.5. Dynamic landscape of immunity along cancer development under an immune microenvironment
Immunity of cancer in the immune microenvironment evolves along with tumorigenesis and progression. Not only the concentration of cancer cells, but also the tumour-associated immune cells such as MDSC are increased during cancer development. This is controlled by the regulation interactions between different cells or cytokines and cells. In order to display the dynamic landscape changes and simulate cancer development, we increase the inhibiting cancer immunity and decrease the strength of the cell–cell interactions promoting cancer immunity at the same time. We simulate starting with strong cancer immunity, and all cell–cell interaction parameters inhibiting cancer immunity are multiplied by α(α ≥ 1) and all cell–cell interaction parameters promoting cancer immunity are divided by α(α ≥ 1) to represent the cancer development level.
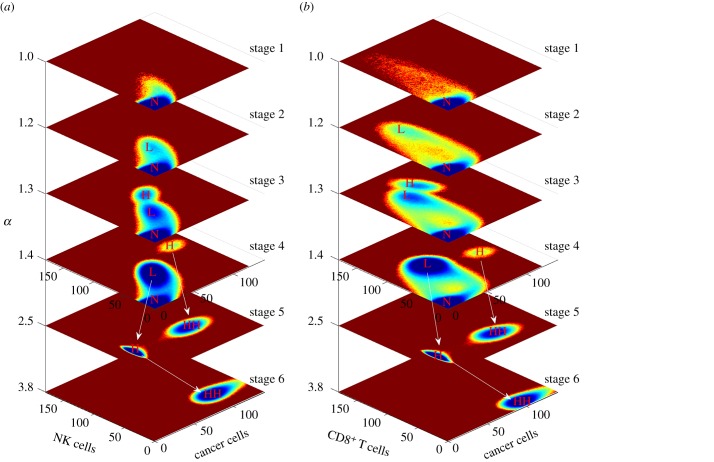
The whole cancer development dynamic landscape is shown in figure 6. The top four and bottom two landscapes are shown in different ranges or scales to display different details. The cancer development direction is from top to bottom as α increases. When the cancer is at strong immunity (α = 1), it is monostable and the cancer cells, NK cells and CD8+ are at a low level. Only the normal state is distinct. Along with cancer development, the low cancer state emerges and the high cancer state emerges at α = 1.2 and α = 1.3, respectively. Although the high cancer state at α = 1.3 emerges, the NK cells and CD8+ levels are also increased compared with the low cancer state. For further cancer development, the high cancer state moves to a high-cancer–low-immunity state for CD8+ (α = 1.4), and the three states (normal, low cancer and high cancer) coexist, which corresponds to the result in [41]. Then, the normal state starts to disappear and the low cancer state moves to a high cancer state, while the high cancer state moves to a larger concentration level, which is defined as the high–high cancer state (HH) when α = 2.5 with a low immunity level. Finally and interestingly, the steady-state attractor at HH disappears and the high cancer state continues to increase to the HH instead, as shown in figure 6, when α = 3.8. The concentration level of HH continues growing when α is increased with a low immunity level.
Figure 6.
Dynamic landscape of cancer tumorigenesis and development. The horizontal coordinates represent cancer development along with increasing α from top to bottom. The top four stages and the bottom two stages are shown in different ranges of cancer cell concentration level. The cancer cell concentration in the bottom two stages ranges from 0 to 1400. The cancer cell concentration in the top four stages ranges from 0 to 140. The white arrows indicate the state moves between two stages: (a) dynamic landscape for cancer cells and NK cells and (b) dynamic landscape for cancer cells and CD8+.
Cancer development is a complex process along with DNA mutation and microenvironment changes. It is characterized by immunoediting [37], consisting of three phases: elimination, equilibrium and escape. In our model, it has six stages along with cancer tumorigenesis and process. At the stage of α = 1, only the normal state emerges and it can be controlled by the immune system. The cancer concentration is impossible to reach at a higher level and the newborn cancer cells are killed immediately. This corresponds to the elimination phase. At the stage of α = 2.5 and α = 3.8 only high cancer or HH emerges and it will never switch back to the normal state. The cancer cell is out of control through escaping from immune cell detection and inhibition of immune cell activation. The cancer concentration level continues to increase rapidly along with cancer development. The two stages correspond to the escape phase. Equilibrium is the longest of the three processes in cancer immunoediting [37] and it involves the normal state and at least the low cancer state. The stages at α = 1.2, α = 1.3 and α = 1.4 correspond to the equilibrium phase. During this phase, it is possible to switch between the normal state and other steady states owing to biological fluctuation. When it switches back to the normal state, most cancer cells are destroyed. The surviving cancer cells reproduce and evolve to a population with increased resistance to the immune system, leading to gradual cancer development. The final stage of the escape phase emerges when α = 1.4, because the immune system starts to lose control of the cancer cells, as shown in figure 6.
It is interesting that tumorigenesis can start with a low cancer state and finally settles at HH even without direct transitions across barriers among steady-state attractors along cancer development. It seems that the low cancer state is the source while the high cancer state is the derivative along cancer development. The barriers between saddles and steady states under a tristable system along with cancer development are shown in figure 7. Barriers1l increases faster than barriers1n, while barriers2l increases faster than barriers2h. This suggests that the low cancer steady state becomes more stable along cancer development. Above all, it implies that the high cancer state is the product of evolution under immune pressure at the specific stages of development.
Figure 7.
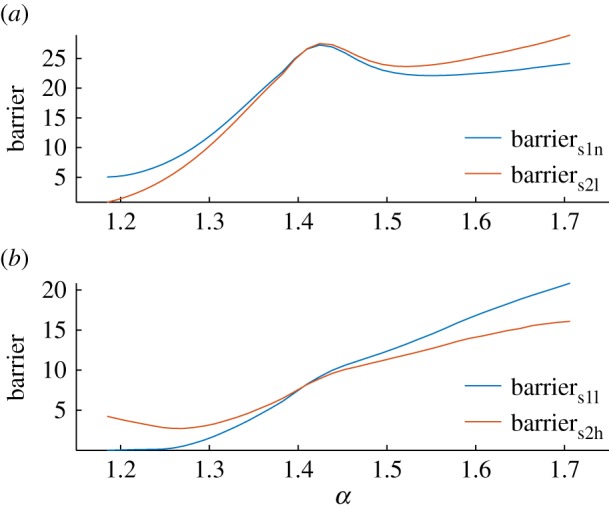
Barrier for a tristable cancer–immune system along with increasing α. ΔBarriers1n, the change of barrier between s1 and the normal state. ΔBarriers1l, the change of barrier between s1 and the low cancer state. ΔBarriers2l, the change of barrier between s2 and the low cancer steady state. ΔBarriers2h, the change of barrier between s2 and the high cancer steady state.
2.6. Cancer oscillation landscape
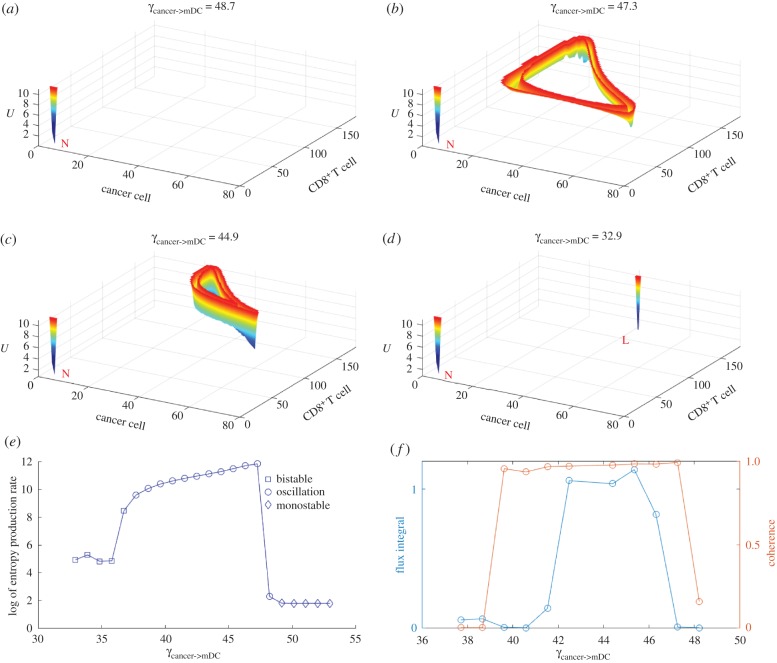
It is interesting that oscillation emerges when we explore the regulatory interactions cancer->cancer, cancer->mDC, mDC->CD8+ and CD8+->cancer under specific conditions. The landscape is obtained using the Langevin method and one steady state with the limit cycle is obtained. When we increase the regulations of cancer->cancer or decrease the other three interactions starting with the monostable state, a shallow limit cycle emerges and, finally, switches to the low cancer state along with the regulation changes.
The oscillation has been observed in some related tumour and immune system studies [50,51]. The landscape under cancer->mDC regulation changes is shown in figure 8 as an example. In figure 8b, a shallow limit cycle emerges and circulates anticlockwise. The limit cycle seems to be a triangle. When the CD8+ and cancer cells are at a relatively low level, the cancer concentration increases with a slight increase of CD8+. When the cancer cells reach a relatively high level, CD8+ start to increase rapidly, which leads to the cancer cells decreasing. When it reaches a state with a relatively high CD8+ level and a relatively low cancer level, the CD8+ level decreases rapidly. It then returns to the state with a relatively low CD8+ and low cancer cell level. The limit cycle shrinks along the decrease of regulation in figure 8c and the potential landscape of the limit cycle near the low cancer state becomes deeper. Finally, it switches to the low cancer state in figure 8d. This suggests that the limit cycle can be a precursor of the low cancer state under some conditions.
Figure 8.
The landscape topography of the oscillation switch along with a decrease in γcancer->mDC. (a) Emergence of the normal state with γcancer->mDC = 48.7. (b and c) Coexistence of the normal state and the limit cycle with γcancer->mDC from 47.3 to 44.9. (d) Emergence of the normal state and the low cancer state with γcancer->mDC = 32.9. (e) Entropy production rate of monostability, bistability and oscillation. (f) Flux integral and coherence of oscillation.
It is interesting that the four interactions leading to the limit cycle become a module consisting of three nodes, cancer, mDCs and CD8+, which is shown in the electronic supplementary material, figure S1. mDCs bridge innate immunity with adaptive immunity [52], while CD8+ are the main effective killers for adaptive immunity. From the electronic supplementary material, figure S1, the cancer cell concentration is increased through self-activation and inhibited through the adaptive response. If we consider there is an indirect activation between cancer and CD8+ by ignoring the mDCs it is quite similar to the classical predator–prey dynamics of an activation–repression loop, which leads to oscillation under specific regulations [53]. This suggests that promoting the cancer adaptive response module may lead to immunity oscillation.
In addition, we calculated the entropy production rate (EPR) for the phase transition from bistability to oscillation to monostability by increasing the regulation of cancer->mDC (figure 8e). The EPR represents the total entropy variations. Decreasing the EPR means less energy for maintenance. We can see that the EPR is high when oscillation emerges. When the system switches to bistability or monostability, the EPR sharply decreases. This implies that the oscillation phase requires much more energy to maintain. We also calculated the flux integral and coherence of the system when the oscillation emerges (figure 8f). The flux integral correlates with coherence roughly. This indicates that the higher flux leads to high oscillation coherence. The flux integral and coherence decrease sharply when the system starts to switch to bistability or monostability. This indicates that a larger flux leads to a stronger driving force in the oscillation and more energy dissipation. Therefore, more energy has to be pumped into the system for switching between bistability and monostability. It also implies that cancer tumorigenesis and recovery processes consume more energy.
2.7. Cell and cytokine therapy target
Cancer immunotherapy uses the immune system to treat cancer. Recently, researchers have paid more attention to immunotherapy, and the recent achievements of several key immunotherapy milestones have dramatically changed the field of cancer treatment [54]. It is important to predict the effective immunotherapy target.
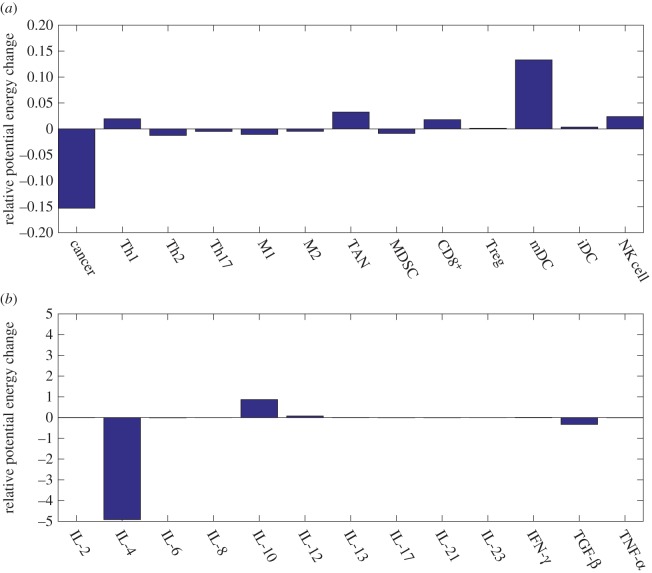
Here, we predict the immunotherapy target based on landscape theory. For each variable xi, F(xi) is changed to F′(xi) = F(xi) + ci. The term ci represents the corresponding variable rate change by immune cell or cytokine injections. The potential energies of the three steady-state attractors are calculated for equivalent ci. We define the changes of the relative potential energy from the normal state to the low cancer state as the degree of therapy effect. The normal state becomes more stable or less unstable compared with the low cancer state, if the changes in the relative potential energy are positive. The therapy takes the adverse effect, if the relative potential energy becomes negative.
The immune cells and the degree of cytokine therapy are shown in figure 9a,b. We predict three important therapy targets of immune cells: mDCs, NK cells and CD8+. Although the tumour-associated cells also show a positive therapeutic effect, the injection of TAN cells makes the low cancer steady state more stable, as shown in the electronic supplementary material, figure S2, and it is not considered as a therapy target. It is reported that mDC vaccination reduces the size of breast cancer stem cells and prolongs survival [55]. Successful immunotherapy of malignant tumours by using NK cells is summarized in [56].
Figure 9.
Predictions for immunotherapy targets based on barrier changes for cells and cytokine injections. (a) Relative potential energy changes of the cell injections. (b) Relative potential energy changes of the cytokine injections. The parameter ci = 0.2.
The cytokine therapy targets predicted are IL-10 and IL-12 in figure 9b. Endogenous IL-10 inhibits inflammatory cytokine production and hampers the development of Treg cells and MDSCs, two key components of the immunosuppressive tumour microenvironment [57]. A potentially beneficial role of IL-12 is demonstrated in directly limiting the malignant phenotype of cancer stem cells [58].
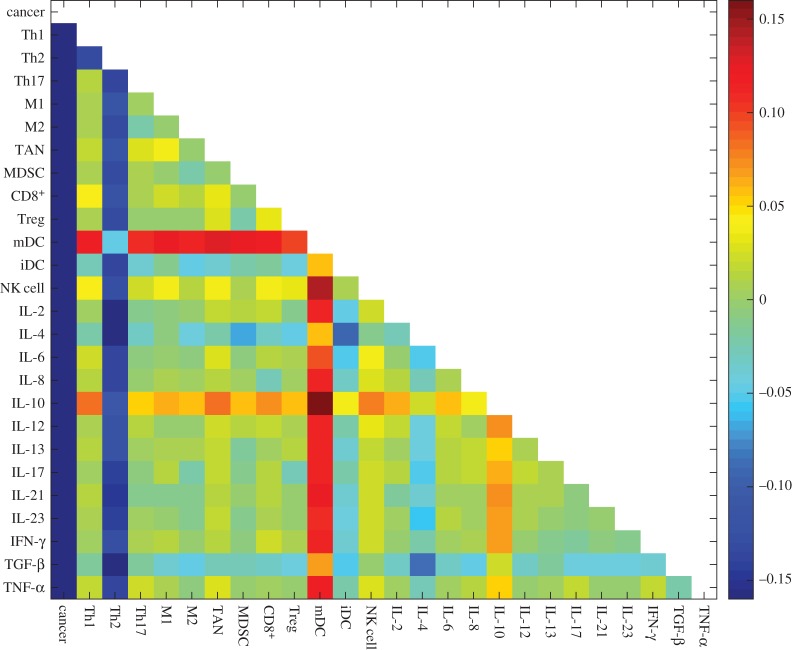
We also predicted the effects of combination immunotherapy. This is according to the landscape barrier change which leads to higher stability/less stability of the cancer basin of attraction. The combination injection of every two types of cells or cytokines is predicted in figure 10. The values in the colour matrix represent the degrees of therapeutic effect. The red colour represents a positive therapeutic effect, while the blue colour represents a negative therapeutic effect. The two most effective combinations are NK cells with IL-10 and mDCs with IL-10.
Figure 10.
Predictions for combinations of immunotherapy based on barrier changes upon cell and cytokine injection. Red colour represents positive therapy and blue colour represents negative therapy. The parameter ci = 0.1.
3. Discussion
The relationship between cancer and immunity is complex and the underlying mechanism of the tumorigensis and development in the immune microenvironment is still unclear. In this study, a comprehensive cancer–immunity model is built including cancer cells, 12 types of immune cells and 13 types of cytokines. Their regulations are classified into three types of interactions: cell–cell interaction, cytokine–cell interaction and cell–cytokine production. There are three types of steady-state basins of attractors: normal state (N), low cancer state (L) and high cancer state (H). It is interesting that adaptive immunity of cancer is inhibited in the high cancer state compared with the low cancer state, although the innate immunity is normal. It has been reported that patients with a lower CD8+ level have a higher T-stage of the tumour and a higher relapse rate [59].
We provide a physical view of cancer tumorigenesis and development. Cancer cells change the characteristics of the immune system by changing interaction strengths. Along the cancer progression under the immune system, six stages with different characteristics emerge in sequence (figure 6). Interestingly, they correspond to three phases: elimination, equilibrium and escape in the immunoediting framework [37]. This also suggests that the low cancer state is the source state and the high cancer state is the result of the evolution originating from cancer immune dynamics. The cancer cell concentration level in the high cancer state increases faster than that in the low cancer state with cancer development. The high cancer state moves to HH at stage 5, while the low cancer state moves to HH at stage 6. In other words, unlucky patients with a high cancer state at stage 3 or 4 will die earlier owing to the rapid cancer cell concentration increase under cancer development. The steady-state attractor originating from the high cancer state only exists within a specific cancer immunity, neither too low nor too high. This provides an opportunity for cancer to remain in a potentially malignant stage (high cancer state at stage 3 or 4). Thus, it is questioned whether it is possible that cancer displays different phenotypes even in the same genotype, condition, microenvironment or process due to the underlying mechanism of cancer immune dynamic interactions. Perhaps the immune system increases the variety and complexity of cancer.
Limit cycle oscillations emerge upon certain cell–cell interactions. It is common that oscillations occur in the immune system [60]. Periodic oscillations have been observed in cancer through analysing blood cell counts [61]. It is reasonable that the oscillatory phenomenon occurs in the cancer–immune system. Although it has been discussed whether the oscillation is encountered by the delay of the immune response with contradictory results [51,62–64], the biological functions or components leading to oscillation have not been studied. In our work, we find that the module with cancer cells, mDCs and CD8+ leads to the oscillation of the cancer–immune system. These three types of cells play an important role in the cancer–immune system. Through analysis of the entropy production rate, flux integral and coherence, this suggest that tumorigenesis and cancer recovery processes may need to go through cancer–immune oscillation and consume more energy.
Three types of cells and two types of cytokines are predicted in our model, all of which have been reported as effective for curing cancer or produced as vaccines [55–58]. Combinations of therapy have been suggested to be more effective. We predicted two of the most effective combinations for immunotherapy. The mathematical model in this study is built based on prior knowledge of the interactions of the immune system. There are still many undiscovered interactions in the immune system. This limits the complete quantitative descriptions of the immune system from the mathematical models. Although the current cancer–immune model contains 12 types of immune cells and 13 types of cytokines, the complexity between the cancer and the immune system is still underestimated. In addition, some other issues such as gene expressions in different cells are not considered owing to their complexity. Therefore, a model with genetic expression, immune cells, cytokines and cancer microenvironment changes can hopefully be used for studying the cancer mechanism and cancer therapy.
4. Material and methods
4.1. Self-consistent mean field approximation
The evolution of the probability distribution on the dynamic system can be described by the probabilistic diffusion equations. Given the state P(X1, X2, …, Xn, t), where X1, X2, …, Xn represent the concentration of the cells or the cytokines, it is hard to exactly solve the high-dimensional partial differential equations. Here, we apply self-consistent mean field approximation of individual variables. The probability P(X1, X2, …, Xn, t) is split into the products of probability of the individual variable,  , according to [11,65–68]. Thus, the dimensionality of the system is reduced to M × N from MN, which makes the computation and storage tractable.
However, it is often difficult to solve the self-consistent mean field equation due to its nonlinearity. We start from the moment equations. In principle, once all moments are known, we can obtain the probability distributions of the dynamic system. Here, a Gaussian distribution ansatz is used to calculate the probability for approximation, and two moments, the mean and the variance, need to be known.
When the diffusion coefficient D is small, the moment equations can be approximated to [69]:
| 4.1 |
and
| 4.2 |
Here,  is the mean of a certain variable and σ(t) is the covariance matrix of the dynamic system evolution. A(t) is a tensor and its matrix element is Aij = ∂Fi(x(t))/∂xj(t). AT(t) is the transpose of A(t). In terms of these equations, we can solve x(t) and σ(t). The diagonal elements of σ(t) are considered. Therefore, the evolution of the probabilistic distribution for each variable can be expressed by Gaussian approximation determined by the mean and variance,
| 4.3 |
The equation above is the expression of the probability for one steady state. For a multistable system, the total probability is equal to the probability of overlap for all the steady states. The multistable system probability of x has the form:  . Here the weight factor wi can be obtained through Langevin simulation. Finally, the landscape can be quantified through the steady-state probability, U(x) =−lnPss(x).
4.2. Langevin dynamics method
For a dynamic system in noisy fluctuating environments, the dynamics is often described by ODEs as  . Here, x(t) represents the vector of the cell concentration and the cytokine concentration. F(x) is the vector for the driving force of these cell–cell interactions, cytokine–cell interactions or cell–cytokine production. External noise and intrinsic noise are of significance to biological systems [70]. So the noise term ζ is added to the force
  , the average dynamics of the system. The noise term ζ is assumed to follow a Gaussian distribution and the mean correlations are given as: 〈ζj(x, t)〉 = 0 and 〈ζi(x, t)ζj(x, t′)〉 = 2Dijδijδ(t − t′) (δij = 1 for i = j and δij = 0 for i≠j). Here δ(t) is the Dirac delta function and D is the diffusion coefficient matrix. The noise term is associated with the intensity of cellular fluctuations either from the environmental external fluctuations or from the intrinsic fluctuations. Under long-time Langevin dynamics simulations, we can obtain the steady-state distribution P(x) for the state variable x through statistics. Finally, the potential landscape is obtained by U =−ln(P(x)).
Supplementary Material
Supplementary Material
Supplementary Material
Acknowledgements
W.L. thanks K. Zhang, Dr L. Xu, Dr F. Zhang, L. Zhao and C. Yu for discussions and comments.
Data accessibility
Codes and parameters can be found in doi:10.6084/m9.figshare.5053624.
Author's contributions
J.W. designed the research; W.L. and J.W. performed the research; W.L. and J.W. analysed the data; and W.L. and J.W. wrote the paper.
Competing interests
We declare we have no competing interests.
Funding
This study was supported by NSFC grant no. 91430217, and MOST China grant nos. 2016YFA0203200 and 2013YQ170585. J.W. is grateful for support from grant no. NSF-PHY-76066.
References
- 1.Gajewski TF, Schreiber H, Fu Y-X. 2013. Innate and adaptive immune cells in the tumor microenvironment. Nat. Immunol. 14, 1014–1022. ( 10.1038/ni.2703) [DOI] [PMC free article] [PubMed] [Google Scholar]
- 2.DuBois RN, Wang D. 2015. Immunosuppression associated with chronic inflammation in the tumor microenvironment. Carcinogenesis 36, 1085–1093. ( 10.1093/carcin/bgv123) [DOI] [PMC free article] [PubMed] [Google Scholar]
- 3.Weinberg RA, Hanahan D. 2011. Hallmarks of cancer: the next generation. Cell 144, 646–674. ( 10.1016/j.cell.2011.02.013) [DOI] [PubMed] [Google Scholar]
- 4.Sabado RL, Bhardwaj N. 2015. Cancer immunotherapy: dendritic-cell vaccines on the move. Nature 519, 300–301. ( 10.1038/nature14211) [DOI] [PubMed] [Google Scholar]
- 5.Eftimie R, Bramson JL, Earn DJD. 2011. Interactions between the immune system and cancer: a brief review of non-spatial mathematical models. Bull. Math. Biol. 73, 2–32. ( 10.1007/s11538-010-9526-3) [DOI] [PubMed] [Google Scholar]
- 6.Wilkie KP, Hahnfeldt P. 2013. Mathematical models of immune-induced cancer dormancy and the emergence of immune evasion. Interface Focus 3, 20130010 ( 10.1098/rsfs.2013.0010) [DOI] [PMC free article] [PubMed] [Google Scholar]
- 7.Pappalardo F, Pennisi M, Ricupito A, Topputo F, Bellone M. 2014. Induction of t-cell memory by a dendritic cell vaccine: a computational model. Bioinformatics 30, 1884–1891. ( 10.1093/bioinformatics/btu059) [DOI] [PubMed] [Google Scholar]
- 8.Wang J, Xu L, Wang E. 2008. Potential landscape and flux framework of nonequilibrium networks: robustness, dissipation, and coherence of biochemical oscillations. Proc. Natl Acad. Sci. USA 105, 12 271–12 276. ( 10.1073/pnas.0800579105) [DOI] [PMC free article] [PubMed] [Google Scholar]
- 9.Wang J, Zhang K, Xu L, Wang E. 2011. Quantifying the Waddington landscape and biological paths for development and differentiation. Proc. Natl Acad. Sci. USA 108, 8257–8262. ( 10.1073/pnas.1017017108) [DOI] [PMC free article] [PubMed] [Google Scholar]
- 10.Wang J. 2015. Landscape and flux theory of non-equilibrium dynamical systems with application to biology. Adv. Phys. 64, 1–137. ( 10.1080/00018732.2015.1037068) [DOI] [Google Scholar]
- 11.Li C, Wang J. 2013. Quantifying cell fate decisions for differentiation and reprogramming of a human stem cell network: landscape and biological paths. PLoS Comput. Biol. 9, e1003165 ( 10.1371/journal.pcbi.1003165) [DOI] [PMC free article] [PubMed] [Google Scholar]
- 12.Li C, Wang J. 2013. Quantifying Waddington landscapes and paths of non-adiabatic cell fate decisions for differentiation, reprogramming and transdifferentiation. J. R. Soc. Interface 10, 20130787 ( 10.1098/rsif.2013.0787) [DOI] [PMC free article] [PubMed] [Google Scholar]
- 13.Li C, Wang J. 2014. Quantifying the underlying landscape and paths of cancer. J. R. Soc. Interface 11, 20140774 ( 10.1098/rsif.2014.0774) [DOI] [PMC free article] [PubMed] [Google Scholar]
- 14.Li C, Wang J. 2015. Quantifying the landscape for development and cancer from a core cancer stem cell circuit. Cancer. Res. 75, 2607–2618. ( 10.1158/0008-5472.CAN-15-0079) [DOI] [PubMed] [Google Scholar]
- 15.Yan H, Zhao L, Hu L, Wang X, Wang E, Wang J. 2013. Nonequilibrium landscape theory of neural networks. Proc. Natl Acad. Sci. USA 110, E4185–E4194. ( 10.1073/pnas.1310692110) [DOI] [PMC free article] [PubMed] [Google Scholar]
- 16.Yan H, Zhang K, Wang J. 2016. Physical mechanism of mind changes and tradeoffs among speed, accuracy, and energy cost in brain decision making: landscape, flux, and path perspectives. Chin. Phys. B 25, 078702 ( 10.1088/1674-1056/25/7/078702) [DOI] [Google Scholar]
- 17.Li C, Wang E, Wang J. 2012. Landscape topography determines global stability and robustness of a metabolic network. ACS Synth. Biol. 1, 229–239. ( 10.1021/sb300020f) [DOI] [PubMed] [Google Scholar]
- 18.Lapidus S, Han B, Wang J. 2008. Intrinsic noise, dissipation cost, and robustness of cellular networks: the underlying energy landscape of MAPK signal transduction. Proc. Natl Acad. Sci. USA 105, 6039–6044. ( 10.1073/pnas.0708708105) [DOI] [PMC free article] [PubMed] [Google Scholar]
- 19.Zhang F, Xu L, Zhang K, Wang E, Wang J. 2012. The potential and flux landscape theory of evolution. J. Chem. Phys. 137, 065102 ( 10.1063/1.4734305) [DOI] [PubMed] [Google Scholar]
- 20.Xu L, Zhang F, Zhang K, Wang E, Wang J. 2014. The potential and flux landscape theory of ecology. PLoS ONE 9, e86746 ( 10.1371/journal.pone.0086746) [DOI] [PMC free article] [PubMed] [Google Scholar]
- 21.Wilke CM, Kryczek I, Wei S, Zhao E, Wu K, Wang G, Zou W. 2011. Th17 cells in cancer: help or hindrance? Carcinogenesis 32, 643–649. ( 10.1093/carcin/bgr019) [DOI] [PMC free article] [PubMed] [Google Scholar]
- 22.Strioga M, Schijns V, Powell DJ, Pasukoniene V, Dobrovolskiene N, Michalek J. 2012. Dendritic cells and their role in tumor immunosurveillance. Innate Immun. 19, 98–111. ( 10.1177/1753425912449549) [DOI] [PubMed] [Google Scholar]
- 23.Galdiero MR, Garlanda C, Jaillon S, Marone G, Mantovani A. 2013. Tumor associated macrophages and neutrophils in tumor progression. J. Cell. Physiol. 228, 1404–1412. ( 10.1002/jcp.24260) [DOI] [PubMed] [Google Scholar]
- 24.Hemdan NYA. 2013. Anti-cancer versus cancer-promoting effects of the interleukin-17-producing t helper cells. Immunol. Lett. 149, 123–133. ( 10.1016/j.imlet.2012.11.002) [DOI] [PubMed] [Google Scholar]
- 25.Qi W, Huang X, Wang J. 2013. Correlation between th17 cells and tumor microenvironment. Cell. Immunol. 285, 18–22. ( 10.1016/j.cellimm.2013.06.001) [DOI] [PubMed] [Google Scholar]
- 26.Ma Y, Shurin GV, Peiyuan Z, Shurin MR. 2013. Dendritic cells in the cancer microenvironment. J. Cancer 4, 36–44. ( 10.7150/jca.5046) [DOI] [PMC free article] [PubMed] [Google Scholar]
- 27.Dudek AM, Martin S, Garg AD, Agostinis P. 2013. Immature, semi-mature, and fully mature dendritic cells: toward a DC-cancer cells interface that augments anticancer immunity. Front. Immunol. 4 ( 10.3389/fimmu.2013.00438) [DOI] [PMC free article] [PubMed] [Google Scholar]
- 28.Khaled YS, Ammori BJ, Elkord E. 2013. Myeloid-derived suppressor cells in cancer: recent progress and prospects. Immunol. Cell Biol. 91, 493–502. ( 10.1038/icb.2013.29) [DOI] [PubMed] [Google Scholar]
- 29.Jiang J, Guo W, Liang X. 2014. Phenotypes, accumulation, and functions of myeloid-derived suppressor cells and associated treatment strategies in cancer patients. Hum. Immunol. 75, 1128–1137. ( 10.1016/j.humimm.2014.09.025) [DOI] [PubMed] [Google Scholar]
- 30.Lewis CE. 2006. Distinct role of macrophages in different tumor microenvironments. Cancer Res. 66, 605–612. ( 10.1158/0008-5472.CAN-05-4005) [DOI] [PubMed] [Google Scholar]
- 31.Wolf D, Sopper S, Pircher A, Gastl G, Wolf AM. 2015. Treg(s) in cancer: friends or foe? J. Cell. Physiol. 230, 2598–2605. ( 10.1002/jcp.25016) [DOI] [PubMed] [Google Scholar]
- 32.Tran Janco JM, Lamichhane P, Karyampudi L, Knutson KL. 2015. Tumor-infiltrating dendritic cells in cancer pathogenesis. J. Immunol. 194, 2985–2991. ( 10.4049/jimmunol.1403134) [DOI] [PMC free article] [PubMed] [Google Scholar]
- 33.Powell DR, Huttenlocher A. 2016. Neutrophils in the tumor microenvironment. Trends Immunol. 37, 41–52. ( 10.1016/j.it.2015.11.008) [DOI] [PMC free article] [PubMed] [Google Scholar]
- 34.Wörmann SM, Diakopoulos KN, Lesina M, Algül H. 2013. The immune network in pancreatic cancer development and progression. Oncogene 33, 2956–2967. ( 10.1038/onc.2013.257) [DOI] [PubMed] [Google Scholar]
- 35.Morvan MG, Lanier LL. 2015. NK cells and cancer: you can teach innate cells new tricks. Nat. Rev. Cancer 16, 7–19. ( 10.1038/nrc.2015.5) [DOI] [PubMed] [Google Scholar]
- 36.Sokol CL, Barton GM, Farr AG, Medzhitov R. 2007. A mechanism for the initiation of allergen-induced T helper type 2 responses. Nat. Immunol. 9, 310–318. ( 10.1038/ni1558) [DOI] [PMC free article] [PubMed] [Google Scholar]
- 37.Dunn GP, Bruce AT, Ikeda H, Old LJ, Schreiber RD. 2002. Cancer immunoediting: from immunosurveillance to tumor escape. Nat. Immunol. 3, 991–998. ( 10.1038/ni1102-991) [DOI] [PubMed] [Google Scholar]
- 38.Garrido F, Aptsiauri N, Doorduijn EM, Lora AMG, van Hall T. 2016. The urgent need to recover MHC class I in cancers for effective immunotherapy. Curr. Opin. Immunol. 39, 44–51. ( 10.1016/j.coi.2015.12.007) [DOI] [PMC free article] [PubMed] [Google Scholar]
- 39.de Pillis LG, Gu W, Radunskaya AE. 2006. Mixed immunotherapy and chemotherapy of tumors: modeling, applications and biological interpretations. J. Theor. Biol. 238, 841–862. ( 10.1016/j.jtbi.2005.06.037) [DOI] [PubMed] [Google Scholar]
- 40.Kirschner D, Panetta JC. 1998. Modeling immunotherapy of the tumor–immune interaction. J. Math. Biol. 37, 235–252. ( 10.1007/s002850050127) [DOI] [PubMed] [Google Scholar]
- 41.Lu M, Huang B, Hanash SM, Onuchic JN, Ben-Jacob E. 2014. Modeling putative therapeutic implications of exosome exchange between tumor and immune cells. Proc. Natl Acad. Sci. USA 111, E4165–E4174. ( 10.1073/pnas.1416745111) [DOI] [PMC free article] [PubMed] [Google Scholar]
- 42.Gabrilovich DI, Nagaraj S. 2009. Myeloid-derived suppressor cells as regulators of the immune system. Nat. Rev. Immunol. 9, 162–174. ( 10.1038/nri2506) [DOI] [PMC free article] [PubMed] [Google Scholar]
- 43.DeNardo DG, Coussens LM. 2007. Inflammation and breast cancer. Balancing immune response: crosstalk between adaptive and innate immune cells during breast cancer progression. Breast Cancer Res. 9, 212 ( 10.1186/bcr1746) [DOI] [PMC free article] [PubMed] [Google Scholar]
- 44.Kusmartsev S, Gabrilovich D. 2002. Immature myeloid cells and cancer-associated immune suppression. Cancer Immunol. Immunother. 51, 293–298. ( 10.1007/s00262-002-0280-8) [DOI] [PMC free article] [PubMed] [Google Scholar]
- 45.Vicari AP, Caux C, Trinchieri G. 2002. Tumour escape from immune surveillance through dendritic cell inactivation. Semin. Cancer Biol. 12, 33–42. ( 10.1006/scbi.2001.0400) [DOI] [PubMed] [Google Scholar]
- 46.Ferrantini M, Capone I, Belardelli F. 2008. Dendritic cells and cytokines in immune rejection of cancer. Cytok. Growth Factor Rev. 19, 93–107. ( 10.1016/j.cytogfr.2007.10.003) [DOI] [PubMed] [Google Scholar]
- 47.Titu LV, Monson JR, Greenman J. 2002. The role of CD8+ T cells in immune responses to colorectal cancer. Cancer Immunol. Immunother. 51, 235–247. ( 10.1007/s00262-002-0276-4) [DOI] [PMC free article] [PubMed] [Google Scholar]
- 48.Marcus A, Gowen BG, Thompson TW, Iannello A, Ardolino M, Deng W, Wang L, Shifrin N, Raulet DH. 2014. Recognition of tumors by the innate immune system and natural killer cells. Adv. Immunol. 122, 91–128. ( 10.1016/B978-0-12-800267-4.00003-1) [DOI] [PMC free article] [PubMed] [Google Scholar]
- 49.Wertel I. 2008. The role of dendritic cells in cytotoxic immune response regulation in ovarian cancer microenvironment. Front. Biosci. 13, 2177 ( 10.2741/2833) [DOI] [PubMed] [Google Scholar]
- 50.Lejeune O, Chaplain MAJ, ElAkili I. 2008. Oscillations and bistability in the dynamics of cytotoxic reactions mediated by the response of immune cells to solid tumours. Math. Comput. Model. 47, 649–662. ( 10.1016/j.mcm.2007.02.026) [DOI] [Google Scholar]
- 51.Bi P, Ruan S, Zhang X. 2014. Periodic and chaotic oscillations in a tumor and immune system interaction model with three delays. Chaos 24, 023101 ( 10.1063/1.4870363) [DOI] [PubMed] [Google Scholar]
- 52.Banchereau J, Steinman RM. 1998. Dendritic cells and the control of immunity. Nature 392, 245–252. ( 10.1038/32588) [DOI] [PubMed] [Google Scholar]
- 53.Evans CM, Findley GL. 1999. A new transformation for the Lotka--Volterra problem. J. Math. Chem. 25, 105–110. ( 10.1023/A:1019172114300) [DOI] [Google Scholar]
- 54.Koch M. 2016. Cancer immunotherapy booster. Cell 165, 253–255. ( 10.1016/j.cell.2016.04.055) [DOI] [Google Scholar]
- 55.Pham PV, et al. 2016. Targeting breast cancer stem cells by dendritic cell vaccination in humanized mice with breast tumor: preliminary results. OncoTargets Ther. 9, 4441–4451. ( 10.2147/OTT.S105239) [DOI] [PMC free article] [PubMed] [Google Scholar]
- 56.Cheng M, Chen Y, Xiao W, Sun R, Tian Z. 2013. NK cell-based immunotherapy for malignant diseases. Cell. Mol. Immunol. 10, 230–252. ( 10.1038/cmi.2013.10) [DOI] [PMC free article] [PubMed] [Google Scholar]
- 57.Tanikawa T, Wilke CM, Kryczek I, Chen GY, Kao J, Nunez G, Zou W. 2011. Interleukin-10 ablation promotes tumor development, growth, and metastasis. Cancer Res. 72, 420–429. ( 10.1158/0008-5472.CAN-10-4627) [DOI] [PMC free article] [PubMed] [Google Scholar]
- 58.Yin XL, Wang N, Wei X, Xie GF, Li JJ, Liang HJ. 2012. Interleukin-12 inhibits the survival of human colon cancer stem cells in vitro and their tumor initiating capacity in mice. Cancer Lett. 322, 92–97. ( 10.1016/j.canlet.2012.02.015) [DOI] [PubMed] [Google Scholar]
- 59.Mlecnik B, et al. 2011. Histopathologic-based prognostic factors of colorectal cancers are associated with the state of the local immune reaction. J. Clin. Oncol. 29, 610–618. ( 10.1200/JCO.2010.30.5425) [DOI] [PubMed] [Google Scholar]
- 60.Stark J, Chan C, George AJT. 2007. Oscillations in the immune system. Immunol. Rev. 216, 213–231. ( 10.1111/j.1600-065X.2007.00501.x) [DOI] [PubMed] [Google Scholar]
- 61.Fortin P, Mackey MC. 1999. Periodic chronic myelogenous leukaemia: spectral analysis of blood cell counts and aetiological implications. Br. J. Haematol. 104, 336–345. ( 10.1046/j.1365-2141.1999.01168.x) [DOI] [PubMed] [Google Scholar]
- 62.d'Onofrio A, Gatti F, Cerrai P, Freschi L. 2010. Delay-induced oscillatory dynamics of tumour–immune system interaction. Math. Comput. Model. 51, 572–591. ( 10.1016/j.mcm.2009.11.005) [DOI] [Google Scholar]
- 63.Feyissa S, Banerjee S. 2013. Delay-induced oscillatory dynamics in humoral mediated immune response with two time delays. Nonlinear Anal. Real World Appl. 14, 35–52. ( 10.1016/j.nonrwa.2012.05.001) [DOI] [Google Scholar]
- 64.Bodnar M, Foryś U. 2016. Delays do not cause oscillations in a corrected model of humoral mediated immune response. Appl. Math. Comput. 289, 7–21. ( 10.1016/j.amc.2016.05.006) [DOI] [Google Scholar]
- 65.Li C, Wang J. 2014. Landscape and flux reveal a new global view and physical quantification of mammalian cell cycle. Proc. Natl Acad. Sci. USA 111, 14 130–14 135. ( 10.1073/pnas.1408628111) [DOI] [PMC free article] [PubMed] [Google Scholar]
- 66.Wang J, Li C, Wang E. 2010. Potential and flux landscapes quantify the stability and robustness of budding yeast cell cycle network. Proc. Natl Acad. Sci. USA 107, 8195–8200. ( 10.1073/pnas.0910331107) [DOI] [PMC free article] [PubMed] [Google Scholar]
- 67.Sasai M, Wolynes PG. 2003. Stochastic gene expression as a many-body problem. Proc. Natl Acad. Sci. USA 100, 2374–2379. ( 10.1073/pnas.2627987100) [DOI] [PMC free article] [PubMed] [Google Scholar]
- 68.Zhang B, Wolynes PG. 2014. Stem cell differentiation as a many-body problem. Proc. Natl Acad. Sci. USA 111, 10 185–10 190. ( 10.1073/pnas.1408561111) [DOI] [PMC free article] [PubMed] [Google Scholar]
- 69.Van Kampen NG. 1992. Stochastic processes in chemistry and physics. Amsterdam, The Netherlands: North Holland. [Google Scholar]
- 70.Kærn M, Elston TC, Blake WJ, Collins JJ. 2005. Stochasticity in gene expression: from theories to phenotypes. Nat. Rev. Genet. 6, 451–464. ( 10.1038/nrg1615) [DOI] [PubMed] [Google Scholar]
Associated Data
This section collects any data citations, data availability statements, or supplementary materials included in this article.
Supplementary Materials
Data Availability Statement
Codes and parameters can be found in doi:10.6084/m9.figshare.5053624.


