Abstract
Decomposition of biomolecular reaction networks into pathways is a powerful approach to the analysis of metabolic and signalling networks. Current approaches based on analysis of the stoichiometric matrix reveal information about steady-state mass flows (reaction rates) through the network. In this work, we show how pathway analysis of biomolecular networks can be extended using an energy-based approach to provide information about energy flows through the network. This energy-based approach is developed using the engineering-inspired bond graph methodology to represent biomolecular reaction networks. The approach is introduced using glycolysis as an exemplar; and is then applied to analyse the efficiency of free energy transduction in a biomolecular cycle model of a transporter protein [sodium-glucose transport protein 1 (SGLT1)]. The overall aim of our work is to present a framework for modelling and analysis of biomolecular reactions and processes which considers energy flows and losses as well as mass transport.
Keywords: network thermodynamics, biomolecular systems, bond graph, reaction kinetics
1. Introduction
The term ‘pathway analysis’ is used very broadly in systems biology to describe several quite distinct approaches to the analysis of biomolecular networks [1–3] and often the definition of a ‘pathway’ is somewhat nebulous. In this work, we are concerned with those pathways defined in terms of the stoichiometric analysis of biomolecular reaction networks [4–8]; in particular, the null space1 of an appropriate stoichiometric matrix1 is used to identify the pathways of a biomolecular network. Two alternative concepts of pathways: elementary modes and extreme pathways are compared and contrasted by Papin et al. [3]. Computational issues are considered by Schuster & Hilgetag [9], Pfeiffer et al. [10], Schilling et al. [11] and Schuster et al. [12]. A brief introduction to the relevant concepts appears in appendix B.
These approaches have proven to be very useful in determining network properties and emergent behaviour of biomolecular reaction networks in terms of the pathway ‘building blocks’ of these networks. However, these approaches are solely focused on mass flows of biomolecular reaction networks. However, to date, little attention has been given to the identification and analysis of pathways in the context of energy flows in biomolecular reaction networks. This paper extends the pathway concept to include such energy flows using an engineering-inspired method: the bond graph.
Like engineering systems, living systems are subject to the laws of physics in general and the laws of thermodynamics in particular [13–17]. This fact gives the opportunity of applying engineering science to the modelling, analysis and understanding of living systems. The bond graph method of Paynter [18] is one such energy-based engineering approach [19–24] which has been extended to include chemical systems [20,25], biological systems [26] and biomolecular systems [27–32]. A brief introduction to the bond graph approach appears in appendix A.
Applying the bond graph method to modelling biomolecular pathways moves the focus from mass flow to energy flow. Hence this paper brings together stoichiometric pathway analysis with energy-based bond graph analysis to identify the pathways of steady-state free energy transduction in biomolecular networks. Although the bond graph approach is well established in the field of engineering, and the stoichiometric pathway analysis approach well established in the field of biochemical analysis, they have not hitherto been brought together. As illustrated in the sodium-glucose transport protein example of §6, this interdisciplinary synthesis gives new insight into the energetic behaviour of living systems.
Section 2 introduces the bond graph approach to pathway analysis using glycolysis as an exemplar. As a preliminary to the energy-based approach, §3 discusses the stoichiometric approach to pathway analysis. Section 4 combines the energy-based reaction analysis of §2 with the stoichiometric pathway analysis of §3 to give an energy-based pathway analysis of biomolecular systems. Section 5 looks at the generic biomolecular cycle transporter model of Hill [14] focusing on the energy transduction aspects; in particular, a two-pathway decomposition provides insight into free-energy dissipation and efficiency. Section 6 uses this two-pathway decomposition to look at a particular transporter—the sodium-glucose transport protein 1 (SGLT1)—using parameters drawn from the experimental results of Eskandari et al. [33]. Section 7 draws some conclusions and indicates future research directions. Appendix A provides a short introduction to those features of the bond graph approach necessary to understand this paper and appendix B similarly introduces systems biology. The complete equations describing the examples are given in the electronic supplementary material.
2. Energy-based reaction analysis
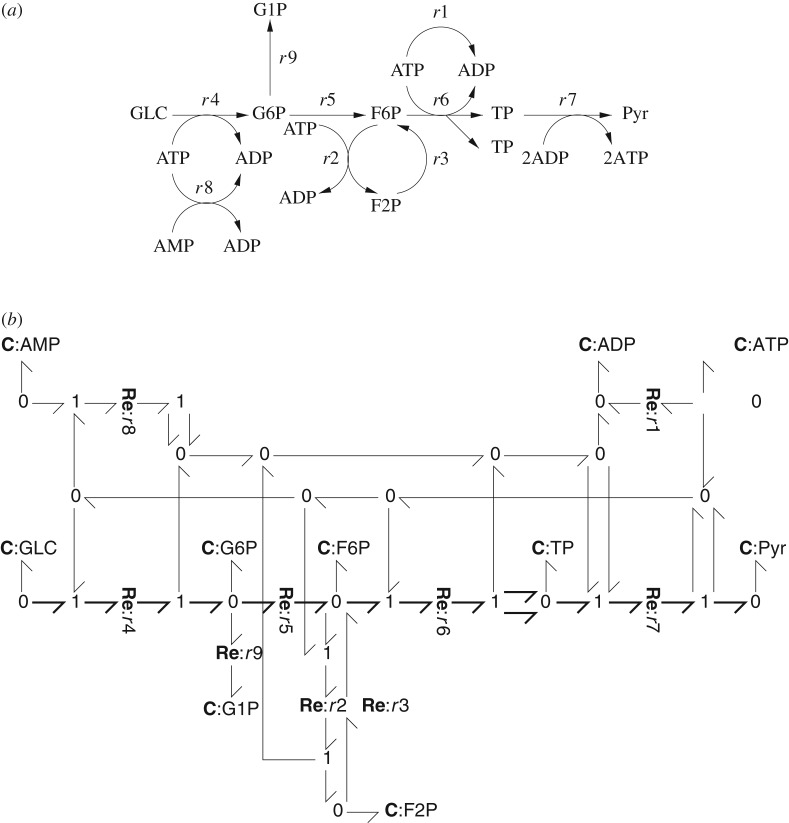
As reviewed in the Introduction, and as discussed by Gawthrop & Crampin [29,31] and appendix A, chemical equations can be written in the form of bond graphs to enable energy-based analysis. As an introductory and illustrative example, the glycolysis example from the seminal book of Heinrich & Schuster [5], fig. 3.4 has the following chemical equations:
These equations can be represented by the biomolecular reaction diagram of figure 1a or the equivalent bond graph of figure 1b. Briefly, each reaction is represented by an Re component and each species by a C component. The (Gibbs) energy flows are represented by bonds which carry both chemical potential and molar flow. Bonds are connected by 0 junctions which imply a common chemical potential on each bond and 1 junctions which imply a common molar flow on each bond. C components store, Re components dissipate and bonds and junctions transmit Gibbs energy. Further details are given in appendix A and references [29–32].
Figure 1.
Glycolysis example from Heinrich & Schuster [5]. (a) Biomolecular reaction diagram of the glycolysis pathway. (b) Bond graph representation of the biomolecular pathway.
Closed biomolecular systems are described in stoichiometric form as:
| 2.1 |
where X is the nX×1 system state, V the nV×1 vector of reaction flows and N is the nX×nV stoichiometric matrix which can be derived from the bond graph representation [29,32]. In the case of the example of figure 1:
| 2.2 |
In the case of mass-action kinetics [8], the reaction flows are generated by the formula:
| 2.3 |
where Af and Ar are the forward and reverse2 reaction affinities. As discussed by Gawthrop & Crampin [29,31], these affinities are given by:
| 2.4 |
where superscript ‘T’ indicates matrix transpose and μ is the (vector of) chemical potentials where the ith element is a logarithmic function of the ith element xi of X:
| 2.5 |
where Ki is a species-specific positive constant. Nf and Nr are the forward and reverse stoichiometric matrices, respectively, and conservation of energy requires that:
| 2.6 |
By definition, all stoichiometric parameters, that is the elements Nfij of Nf and the elements Nrij of Nr have the following properties:
| 2.7 |
As discussed by Gawthrop & Crampin [31], open biomolecular systems can be described and analysed using the notion of chemostats [34,31]. Chemostats have two biomolecular interpretations:
(i) one or more species are fixed to give a constant concentration (for example, under a specific experimental protocol); this implies that an appropriate external flow is applied to balance the internal flow of the species,
(ii) as a C component with a fixed state imposed on a model in order to analyse its properties [30].
Additionally, in the context of a control systems analysis, the chemostat can be used as an ideal feedback controller, applied to species to be fixed with setpoint as the fixed concentration and control signal an external flow.
When chemostats are present, the reaction flows are determined by the dynamic part of the stoichiometric matrix. In this case, the stoichiometric matrix N can be decomposed as the sum of two matrices [31]: the chemostatic stoichiometric matrix Ncs and the chemodynamic stoichiometric matrix Ncd, where N=Ncs+Ncd and:
| 2.8 |
Note that Ncd is the same as N except that the rows corresponding to the chemostat variables are set to zero. In this case, Ncd is given by N of equation (2.2) with rows 1–4 set to zero.
With these definitions, an open system can be expressed as
| 2.9 |
The stoichiometric properties of Ncd, rather than N, determine system properties when chemostats are present. Using equation (2.8), in equation (2.9) can also be written as
| 2.10 |
V s can be interpreted as the external flows required to hold the chemostat states constant. The reaction flows are given by the same formulae (2.3) and (2.4) as closed systems.
3. Stoichiometric pathway analysis
As discussed in the textbooks [4–8] and appendix B, the (non-unique) nV×nP null-space matrix Kp of the open system stoichiometric matrix Ncd has the property that
| 3.1 |
and r is the rank of N. Furthermore, if the reaction flows V are constrained in terms of the nP pathway flows V p as
| 3.2 |
then substituting equation (3.2) into equation (2.1) and using equation (3.1) implies that . This is significant because the biomolecular system of equation (2.1) may be in a steady state for any choice of V p.
As mentioned above, Kp is not unique: there are many possible approaches to choosing Kp such that equation (3.1) holds. As discussed by, for example, Pfeiffer et al. [10], Kp can be computed in such a way as to give useful features such as integer entities and maximal number of zero elements; moreover, if all reactions are irreversible, the columns of Kp must correspond to a convex space.3 As discussed in §4, the analysis of this paper requires that all elements Kpij of Kp must satisfy the same conditions as those on Nfij and Nrij (2.7), namely:
| 3.3 |
For this reason, Kp is referred to as the positive-pathway matrix (PPM) in the sequel. This does not imply that reactions are assumed to be irreversible; however, one approach to generating such a Kp is using software such as metatool [10] as if all reactions were irreversible.
In the case of the glycolysis system of figure 1, Heinrich & Schuster [5] choose the chemostats to be: GLC, Pyr, ATP and ADP. Using the algorithm of Pfeiffer et al. [10],4 Kp for the glycolysis system of figure 1 was computed as
| 3.4 |
The pathways corresponding to the three columns of Kp, (referring to figure 1a), are: {r1}, {r2 r3} and {r4 r5 r6 2r7}. The latter pathway is marked on the bond graph of 1b using bold bonds. As pointed out by Heinrich & Schuster [5], these three pathways are independent insofar as they have no reactions in common; as will be seen in the rest of this section and in the examples of §§5 and 6, this is not always the case.
The number of pathways, and their independence, not only depend on the network structure, but also on the choice of chemostats. To illustrate this point, consider the same glycolysis system of figure 1, but choose an additional chemostat to be G1P. In this case, Kp is given by
| 3.5 |
The first three columns of equation (3.5) are identical to the three columns of equation (3.4). The fourth column corresponds to the additional pathway {r4 r9}, which shares reaction r4 with the pathway {r4 r5 r6 2r7} corresponding to the third column of equations (3.5) and (3.4).
4. Energy-based pathway analysis
This section combines the energy-based reaction analysis of §2 with the stoichiometric pathway analysis of §3 to give an energy-based pathway analysis of biomolecular systems.
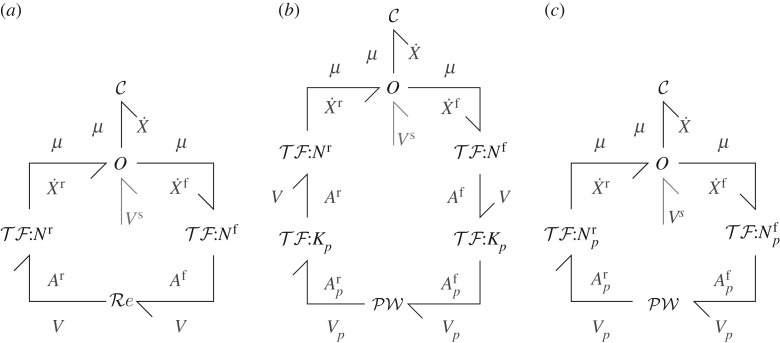
As discussed by Gawthrop & Crampin [29,31], equations (2.1), (2.4) and (2.6) can be summarized by the diagram of figure 2a. The key point here is that the energy flow from the reaction components represented by the vectors of covariables Ar and V is transformed without energy loss by into the energy flow to the components represented by the vectors of covariables μ and and the energy flow from the components represented by the vectors of covariables μ and is transformed without energy loss by into the energy flow to reaction components represented by the vectors of covariables Af and V. Dissipation of energy occurs at the reaction components . The challenge for an energy-based pathway analysis is to determine the energy flow associated with each pathway.
Figure 2.
Energy-based analysis. (a) Reaction-based system [31]. The bond symbols correspond to vectors of bonds; , and correspond to arrays of C, Re and 0 components; the two components represent the intervening junction structure comprising bonds, 0 and 1 junctions and TF components. Nf and Nr are the forward and reverse stoichiometric matrices, respectively. V s represents the chemostatic flows. (b) The positive-pathway matrix Kp maps the nP positive-pathway flows V p onto the nV reaction flows V and also maps the nV reaction affinities onto the nP positive-pathway affinities. conceptually represents the non-linear function generating the steady-state positive-pathway flows in terms of the positive-pathway affinities; unlike , it does not have a diagonal structure. (c) components have been merged using and .
The key result of the stoichiometric pathway analysis summarized in §3 is equation (3.2) relating the pathway flow vector V p to the reaction flow vector V by V =KpV p. To bring this result into the energy domain, we define the forward and reverse pathway affinities and , respectively, and the pathway affinity Ap, as
| 4.1 |
With these definitions, we can define powers (energy flows) associated with pathways:
| 4.2 |
| 4.3 |
Thus, the net forward pathway energy flow equals the net forward reaction energy flow Pf and the net reverse pathway energy flow equals the net reverse reaction energy flow Pr. Hence Kp can be considered as an energy transmitting transformer for both forward and backward pathway energies and is represented in figure 2b by the symbol .
Figure 2c can be obtained from figure 2b by combining equations (2.1) and (2.6) with equation (3.2), and equations (4.1) with equations (2.4) to give:
| 4.4 |
| 4.5 |
Equation (4.5) defines the forward and reverse pathway stoichiometric matrices; using conditions (2.7) and (3.3), it follows that and have positive integer elements:
| 4.6 |
A property of Np follows from combining equations (4.5), (2.8) and (3.1); in particular, Np may be rewritten as
| 4.7 |
Hence Np has the property that the only non-zero rows correspond to the chemostats.
In the case of the example of figure 1:
| 4.8 |
Using equation (4.4) and Np from equation (4.8), the affinity associated with each of the three pathways is, as expected:
| 4.9 |
Because conditions (4.6) agree with conditions (2.7), and could correspond to the forward and reverse stoichiometric matrices of the following three reactions:
where CS2=F6P+F2P and CS3=2ATP+2ADP+G6P+F6P+2TP. However, some care must be taken in this interpretation. Firstly, the kinetics are not mass-action even if the original equations correspond to mass-action kinetics. Secondly, and unlike conventional reactions, these three reactions are not independent; the consequences of this fact are discussed in §5. Nevertheless, such a pathway decomposition provides insight into the energy flows in a reaction network. This is illustrated using a generic example of Hill [14] in §5 and using a specific example, the sodium-glucose transport protein of Eskandari et al. [33], in §6.
5. Example: free energy transduction and biomolecular cycles
In his classic monograph, ‘Free energy transduction and biomolecular cycle kinetics’ Hill [14] discusses how the difference between the concentration of a species Mo outside a membrane and the concentration of the same species Mi inside the membrane can be used to transport another species Li inside the membrane to outside the membrane Lo via a large protein molecule with two conformations E and E★ the former allowing successive binding to Mi and Li and the latter to Mo and Lo. This biomolecular cycle is represented by the diagram of figure 3a which corresponds to that of Hill [14], fig. 1.2(a). There are seven reactions
Figure 3.
Free energy transduction and biomolecular cycles: model. (a) As discussed in the text, this is a generic model of a transmembrane transporter due to Hill [14] and based on the conformations of the protein E which uses the chemical gradient of M to pump L across the membrane against an adverse gradient. An ideal cycle would have no ‘slippage’: the link from EM to E★M would not exist. As discussed in the text, two pathways: loop and slip have been marked. (b) The bond graph is geometrically the same as (a) but gives a precise description. (Es is used in place of E★ for syntactical reasons).
where the last reaction is the so-called slippage5 term in which the enzyme changes conformation without transporting species L. The original Hill diagram does not name the seven reactions, they are named here to provide a link to the bond graph which explicitly names reactions.
The corresponding bond graph appears in figure 3b where E★ is replaced by Es for syntactical reasons. The bond graph clearly shows the cyclic structure of the chemical reactions and is geometrically similar to the diagram of figure 3a. As discussed by Hill [14], the four species Mo, Mi, Lo and Li, are assumed to have constant concentration: therefore, they are modelled by four chemostats.
The states X, stoichiometric matrix N and reaction flows V of this system are
| 5.1 |
The matrix Ncd is the same as N but with the first four rows (corresponding to the four chemostats) deleted. The rank of Ncd is r=5 corresponding to the four chemostats and the conserved moiety of the remaining states; thus the null space has dimension nV−r=2.
As discussed in §4, two positive pathways were identified both by bond graph pathway analysis and using metatool.6 The corresponding PPM Kp is
| 5.2 |
Apart from the ordering of the two columns, the PPM for this system is unique. These two columns correspond to the path involving the six reactions: {e em lem es esm lesm} and the upper loop involving the four reactions: {e em es slip}. These are the only positive pathways for this system. For convenience, the first (outer) pathway will be named loop and the second pathway (involving the ‘slip’ reaction) will be named slip; this nomenclature is indicated in figure 3a.
For the purposes of illustration, the thermodynamic constants of the 10 species are taken to be unity, the total amount of E, EM, LEM, E★, E★M and LE★M is taken as Etot=10, the amount of Mo and Li is taken as unity, the amount of Lo as two and Mi is variable. The rate constant of the slippage reaction is varied in the sequel, and that of the other reactions is 10.
The system was simulated with a slow change of the amount of Mi from 2 to 100 such that the system was effectively in a steady state for each value of the amount of Mi; these values were then refined using a steady-state finder. The conserved moiety was automatically accounted for using the method of Gawthrop & Crampin [29], §3(c). The results were checked using explicit expressions for the steady-state values using the software of Qi et al. [37], which is based on the method of King & Altman. The system equations are given in the electronic supplementary material.
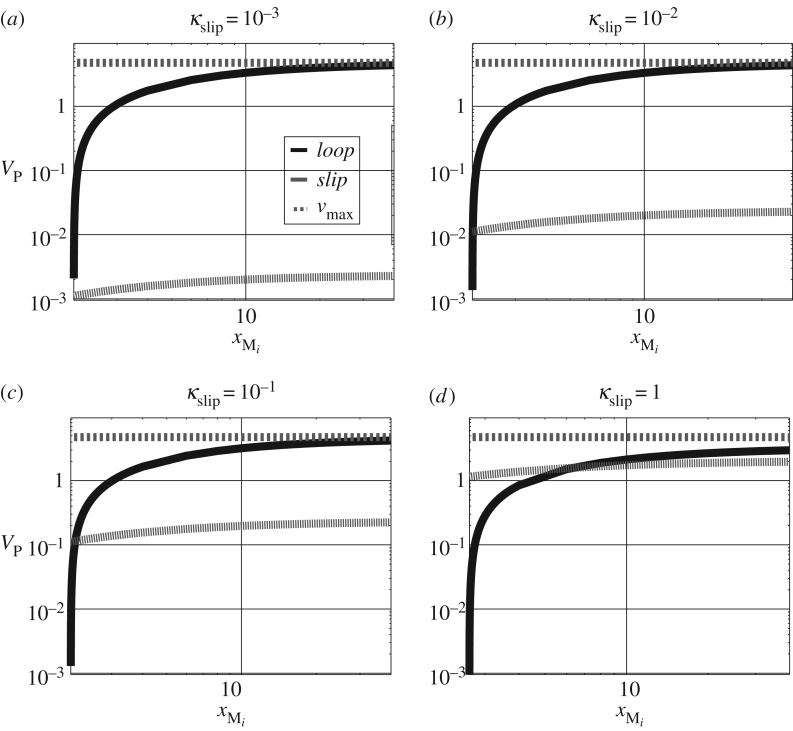
Figure 4 shows the two pathway flows and against the amount xMi of Mi for four values of κslip. As derived in the electronic supplementary material, the maximum flow when the κslip=0 is given by and this value is also plotted on each graph.
Figure 4.
Free energy transduction and biomolecular cycles: positive flow regime. (a) The flow in the two pathways labelled loop and slip in figure 3a are shown together with the maximum flow for slippage coefficient κslip=10−3. (b)–(d) The same information for three further values of the slippage coefficient κslip.
The purpose of this cycle is to use the excess of M to pump L against the concentration gradient. In addition to viewing the cycle as a mass transport system, it may also be viewed as a system for transducing free energy from M to L. From this point of view, it is interesting to investigate the (steady-state) efficiency η of the energy transduction [14], §1.4, which we define as
| 5.3 |
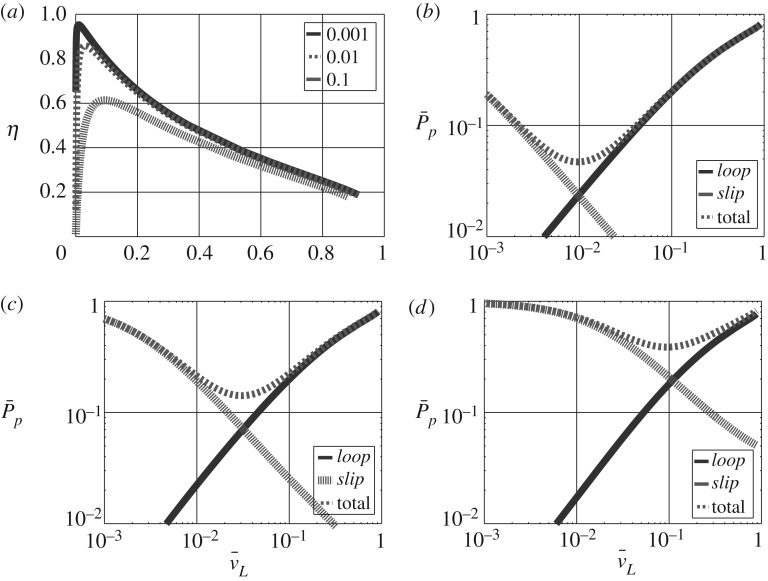
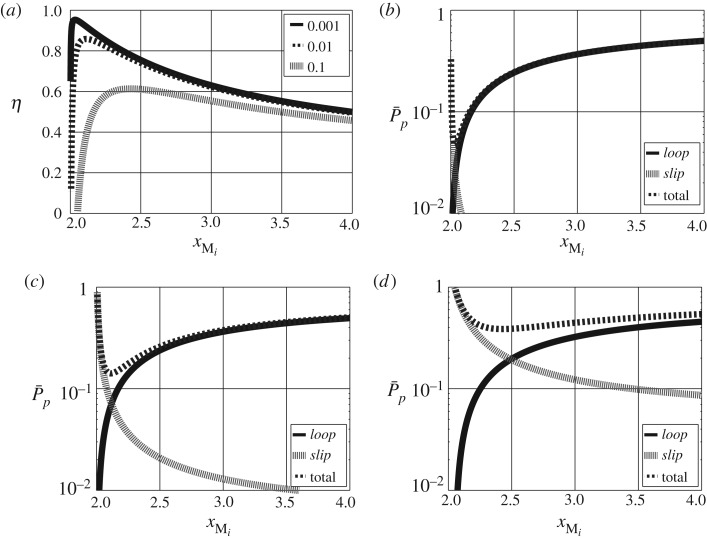
The simulated η is plotted against normalized flow in figure 5a for the four values of κslip and reveals three features:
(i) with negligible slip, the maximum efficiency occurs at low flow rates.
(ii) the efficiency decreases as κslip increases
(iii) the flow rate corresponding to maximum efficiency increases with κslip.
Figure 5.
Free energy transduction and biomolecular cycles: energy-based analysis. (a) The free energy transduction efficiency η is plotted against normalized flow of L for the three values of the slippage coefficient κslip used in (b–d). (b–d) The normalized pathway free energy dissipation is plotted against normalized flow of L for the two pathways loop and slip marked on figure 3a together with the total normalized free energy dissipation. (a) Efficiency η for different κslip; normalized dissipation (b) : κslip=10−3, (c) : κslip=10−2 and (d) : κslip=10−1.
To further investigate the source of the inefficiency, the pathway dissipation Pp was computed and normalized to give . This is plotted for each pathway, together with the total normalized dissipation, against the normalized flow of L in figure 5b,d for three values of κslip. As can be seen, the main loop pathway dissipation increases with flow of L with all of the free energy associated with M dissipated at the maximum flow rate. By contrast, the slippage pathway dissipation decreases with flow of L with all of the free energy associated with M dissipated at zero flow rate. The combined normalized dissipation thus has a minimum (i.e. energy transduction is most efficient) at an intermediate flow rate dependant on κslip.
Figure 6 is similar to figure 5 except that the efficiency η and normalized energy flows are plotted against Mi in the positive flow regime. The minima occur at values of Mi towards the lower end of the positive flow regime. This reflects the fact that, as shown in figure 4, large changes in flow vP correspond to small changes in concentration xMi towards the lower end of the positive flow regime; for larger values of xMi, the effect of changes in xMi on vP is smaller.
Figure 6.
Free energy transduction and biomolecular cycles: energy-based analysis. Figure 5 is replotted with xMi replacing . (a) Efficiency η for different κslip; normalized dissipation (b) : κslip=10−3, (c) : κslip=10−2 and (d) : κslip=10−1.
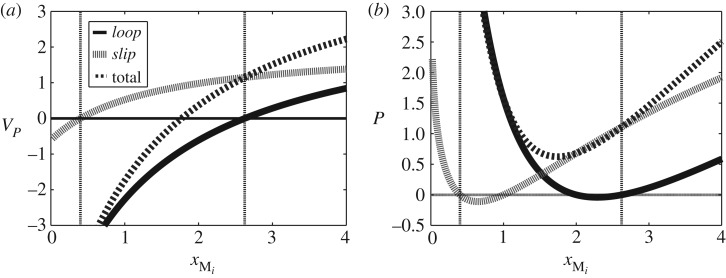
As mentioned in §4, the reactions corresponding to the two pathways of this example are not independent. To examine the consequences of this interaction, figure 7 focuses on the system behaviour in the crossover region where the two pathway flows have opposite directions. Figure 7a shows the two mass flows which have opposite sign in the crossover region 0.42<Mi<2.62 delineated by the two vertical lines. Within this region, figure 7b shows that the individual pathway energy dissipations may be negative; of course, as indicated in figure 7b, the total dissipation remains positive. This behaviour is a consequence of the intersection of the two pathways leading to a non-diagonal (figure 2). Furthermore, the sum of the two pathway flows, corresponding to the flow of Mi and Mo, also changes sign thus causing the associated energy flow PM (5.3) to also change sign. Thus normalizing the pathway energy transduction in the crossover region using equation (5.3) is not helpful. However, the normal operating region of such a biomolecular cycle is outside the crossover region and hence this situation does not normally arise.
Figure 7.
Mass and energy flows in the crossover region. For sufficiently small Mi, the cycle no longer acts as a transporter as the flows in the two pathways labelled loop and slip in figure 3a become negative. This figure examines the crossover regime (delineated by the two vertical lines) where one pathway flow is positive and the other negative—with a large value (κslip=1) of slippage to exaggerate the effect. Note the negative pathway dissipations when the sign of the pathway flows is different—this is due to the intersection of the two pathways leading to a non-diagonal . (a) Mass flows and (b) energy flows.
6. Example: the sodium-glucose transport protein 1
The SGLT1 (also known as the Na+/glucose transporter) was studied experimentally by Parent et al. [38] and explained by a biophysical model [39]; further experiments and modelling were conducted by Chen et al. [40]. Eskandari et al. [33] examined the kinetics of the reverse mode using similar experiments and analysis to Parent et al. [38,39] but with reverse transport and currents. This example looks at a bond graph-based model of SGLT1 based on the model of Eskandari et al. [33]. For simplicity, it is assumed that the membrane potential is zero and thus there are no electrogenic effects.
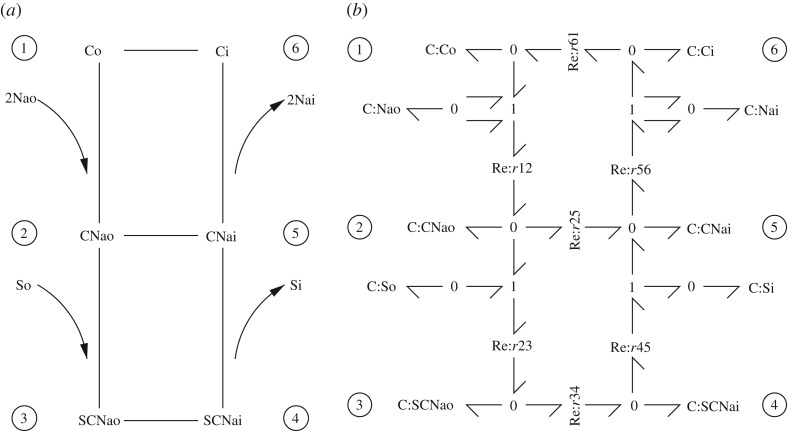
The model of Eskandari et al. [33], fig. 6B, given in diagrammatic form in figure 8a is based on the six-state biomolecular cycle of fig. 2 of Parent et al. [39]. When operating normally, sugar is transported from the outside to the inside of the membrane driven against a possibly adverse gradient by the concentration gradient of Na+. The diagram of figure 8a is similar to the Hill model of figure 3a. Apart from the renaming of components, and the reversal of inside and outside, the major difference is that the single driving molecule Mi and Mo replaced by two driving molecules 2Na+o and 2Na+i. This change is reflected in the bond graph of 8b by the double bonds. This also means that the stoichiometric matrix N is the same as that of equation (5.1) except that the rows corresponding to Na+o and Na+i are multiplied by 2. However, as Na+o and Na+i are chemostats, this change does not affect the PPM Kp which is still given by (5.2). The actual matrices are given in the electronic supplementary material.
Figure 8.
The SGLT1. (a) Diagram with the six states marked. (b) The corresponding bond graph.
The seven sets of reaction kinetic parameters are given in Eskandari et al. [33], fig. 6B and listed in the first two columns of table S1 of the electronic supplementary material and the third column gives the corresponding equilibrium constants. The vector of seven equilibrium constants Keq is converted into the vector of 10 thermodynamic constants K of table S2 of the electronic supplementary material using the formula of Gawthrop et al. [30]:
| 6.1 |
where N is the 10×7 stoichiometric matrix. The corresponding rate constants κ are then computed as discussed by Gawthrop et al. [30] and listed in the final column of table S1 of the electronic supplementary material. The system was simulated as described in §5 and the system equations are given in the electronic supplementary material.
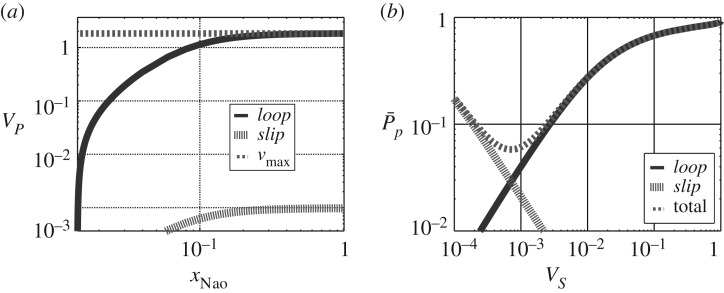
As in figure 4, figure 9a shows the two pathway flows and, as in figure 5, figure 9b shows the corresponding pathway dissipation. As in §5, but using parameters corresponding to experimental data, the combined normalized dissipation has a minimum (i.e. energy transduction is most efficient) at an intermediate flow rate.
Figure 9.
The SGLT1. (a) Simulated flows (normalized) in the two pathways labelled loop and slip in figure 3a. (b) The normalized pathway dissipations as a function of normalized flows.
7. Conclusion
It has been shown that standard methods of mass-flow pathway analysis can be extended to energy-flow pathway analysis making use of the bond graph method arising from engineering science. The method has been applied to a glycolysis example of Heinrich & Schuster [5], fig. 3.4 and the biomolecular cycle of Hill [14], fig. 1.2(a) to enable comparison with standard approaches.
The analysis of the biomolecular transporter cycle was shown to apply to a model of the SGLT1 based on the experimentally determined parameters of Eskandari et al. [33], fig. 6B. Intriguingly, it was found that the rate of energy dissipation has a minimum value at a particular normalized flow rate which in turn corresponds to a particular driving concentration. This minimum is due to the interaction of a number of factors including the system parameters, the presence of two interacting pathways and the concentration of Na+ (or M in the case of §5) needed to generate the transporter flow. It would be interesting to compare this theoretical flow rate to that found in nature.
The bond graph approach can be used to decompose complex systems into computational modules [30,31]. Combining such modularity with the energy-based pathway analysis approach of this paper would provide an approach to analysing and understanding energy flows in complex biomolecular systems, for example, those within the Physiome Project [41], which is the subject of current research.
Although this paper is restricted to flows of chemical energy, the bond graph approach enables models to be built across multiple energy domains including chemoelectrical transduction [42,43]. Hence the pathway approach can be equally well applied to systems with electrogenic features such as excitable membranes [44] and the mitochondrial electron transport chain [45].
The effective use of energy is an important determinant of evolution [13,17,46,47]. Therefore, the energy-based pathway analysis of this paper is potentially relevant to investigating why living systems have evolved as they have. For example, do real SGLT1 transporters operate near the point of minimal energy dissipation?
The supply of energy is essential to life and disruption of energy supply has been implicated in many diseases such as cardiac failure [48,49], Parkinson’s disease [50–54] and cancer [55–57]. Therefore, it seems natural to apply the energy-based methods of this paper to investigate such systems. In particular, mitochondria are important for energy transduction in living systems and mitochondrial dysfunction is hypothesized to be the source of ageing [58], ch. 14, cancer [59,60] and other diseases [61]. Mathematical models of mitochondria exist already [62–65], and it is hoped that the energy-based pathway analysis of this paper will shed further light on the function and dysfunction of mitochondria, and this is the subject of current research.
Supplementary Material
Acknowledgements
P.J.G. thanks the Melbourne School of Engineering for its support via a Professorial Fellowship. Both authors thank Dr Ivo Siekmann for discussions relating to conic spaces and Dr Daniel Hurley for help with the virtual reference environment. We also thank the reviewers for their suggestions for improving the paper and Professor Peter Hunter for pointing out some errors in the draft manuscript.
Appendix A. A short introduction to bond graph modelling
The purpose of this section is to provide the bond graph background necessary to understand the paper itself. More information is to be found in references [29–32].
Bond graphs unify the modelling of energy within and across multiple physical domains using the concepts of effort and flow variables whose product is power. Thus, in the electrical domain the effort variable voltage V with units of V and flow variable current i with units of A have the product P=V i with units of J s−1. In the biomolecular domain, the effort variable is chemical potential μ with units of J mol−1 and the flow variable is reaction flow rate v with units of mol s−1; μv also has units of J s−1.
The bond graph C component is a generic energy storage component corresponding to a capacitor in the electrical domain and the amount of a chemical species in the biomolecular domain. If q is the time integral of the flow variable, the electrical capacitor generates voltage V according to the linear relationship: V =q/C, where C is the capacitance in Farads and q is the charge in Coulombs. By contrast, the chemical species generates chemical potential μJ mol−1 according to the nonlinear relationship: , where R is the universal gas constant with units of J mol−1 K−1, T is the absolute temperature with units of K, x=q/q0, where q0 is the reference quantity and K is a species-dependent constant which is dimensionless and depends on the reference quantity.
The bond graph R component is a generic energy dissipation component corresponding to a resistor in the electrical domain. In the linear case, it generates current i according to the linear relationship: i=κΔV , where κ is the conductance and ΔV is the net voltage across the resistor. The R component corresponds to a chemical reaction in the biomolecular domain. Assuming mass-action kinetics it generates molar flow v according to the nonlinear relationship: , where Af (the forward affinity) and Ar (the reverse affinity) are the net chemical potentials (with units of J mol−1) of the reactants and products of the reaction, respectively; κ is the reaction rate constant with units of mol s−1. Because this relationship treats the forward and reverse affinities differently, this reaction version of the R component is given a special symbol: Re.
Bond graphs represent the flow of energy between components by the bond symbol where the direction of the harpoon corresponds to the direction of positive energy flow; this is a sign convention. The bonds connect components via junctions which transmit, but do not store or dissipate energy. There are two junctions: the 0 junction where all impinging bonds have the same effort and the 1 junction where all impinging bonds have the same flow. The expression for the flows associated with the 0 junction, and the efforts associated with the 1 junction, are determined by the energy conservation requirement.
Figure 10 illustrates bond graph modelling in the electrical domain. The four capacitors and one resistor are connected as in the schematic diagram of figure 10a. In bond graph colon notation, the symbol before the colon indicates the component type and the symbol after the colon indicates the component name. Thus, the bond graph of figure 10b has four C components named A–D to represent the four capacitors and a single R component named r to represent the resistor. The two 0 junctions on the left reverse the sign of the flow associated with C:A and C:B. The two 0 junctions on the right are not necessary, but are convenient for connecting to others via bonds components to form a larger system. The left 1 junction corresponds to V f=V A+V B and the right 1 junction corresponds to V r=V C+V D; the centre 1 junction corresponds to ΔV =V f−V r=(V A+V B)−(V C+V D). Given the constitutive relations for the C and R component, the dynamical equations describing the system can be automatically generated from the bond graph of figure 10b.
Figure 10.
Modelling electrical systems. (a) Electrical schematic diagram. (b) Bond graph: ΔV =(V A+V B)−(V C+V D).
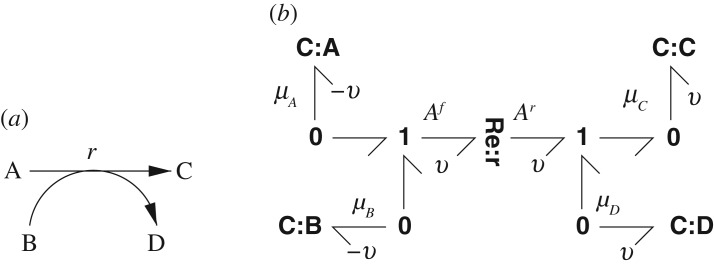
Figure 11 illustrates bond graph modelling in the chemical domain; the corresponding reaction is A+B r C+D. In a similar manner to the electrical system of figure 10, the bond graph of figure 11b has four C components named A–D to represent the four species and a single Re component named r to represent the reaction. The major difference is the use of the Re component to replace the 1 and R combination within the dotted box of figure 10b; as mentioned previously this is because the forward and reverse affinities are treated differently. In particular, with reference to the example of figure 11, Af=μA+μB, Ar=μC+μD which, with reference to equation (2.4) corresponds to
Using equations (2.3) and (2.5), it follows that:
This is a form of the mass-action kinetics equation discussed in the textbooks [8]. In particular, the equation can be rewritten as follows:
where
As mentioned above, the K constants are dimensionless and thus kf and kr are dimensionless. The dimensionless equilibrium constant Keq is defined as
As discussed by Gawthrop et al. [30], Keq and KA, KB, KC and KD are related by the general formula (6.1).
Figure 11.
Modelling biomolecular systems: A+B r C+D. (a) Biomolecular schematic diagram. (b) Bond graph: Af=μA+μB, Ar=μC+μD.
In both the electrical and biomolecular systems, there is only one flow: the current i in the electrical case and the molar flow v in the biomolecular case. This flow f is out of C:A and C:B and into C:C and C:D. Hence, in the biomolecular case, . This implies that xA+xC=xAC, xA+xD=xAD and xB+xC=xBC where xAC, xAD and xBC are constant. Each of these three equations represents a conserved moiety: the total amount of the charge or species involved remains constant. The choice of conserved moieties in a given situation is generally not unique; this is discussed further in appendix B.
Replacing A,B,C and D by GLC, G6P, ATP and ADP, respectively, and r by r4 in figure 11 corresponds to the reaction to the left of the diagram in figure 1. The apparently redundant 0 junctions in figure 11 are used to provide connections between this particular reaction and the overall reaction network of figure 1. The reaction diagram of figure 1a has the entities ATP and ADP represented more than once. Although this enhances clarity by removing the need for intersecting lines on the diagram, it reduces clarity by having each entity appear in multiple locations. By contrast, the bond graph of figure 1b represents ATP and ADP each by a single C component (ATP and ADP, respectively) with appropriate connections to each of the reactions represented by Re:r1–Re:r9.
This idea of representing biomolecular reaction networks by C components (representing species) and Re components (representing reactions) connected by bonds () and 0 and 1 junctions is summarized and formalized in figure 2a. This representation is summarized in the caption to figure 2 and is discussed in detail by Gawthrop & Crampin [29,31].
Bond graphs provide one foundation for this paper, the other is the systems biology concept of pathways outlined in the next section.
Appendix B. A short introduction to systems biology
The purpose of this section is to provide the systems biology background necessary to understand the paper itself.
As discussed in the basic textbooks (for example, that of [8]), the stoichiometric matrix N is a fundamental construct in describing and understanding biomolecular systems. In particular, given nX chemical species with molar amounts contained in the column vector X and nV reactions with molar flow rates contained in the column vector V ; the nX×nV stoichiometric matrix N relates the rate of change of X to V by equation (2.1) repeated here:
| 2.1 |
The elements of N are integers that determine the amount of each species participating in the reaction. For example, the reaction A+B r C+D of figure 11 can be represented by equation (2.1) where:
where xA is the molar amount of substance A, etc., and vr is the reaction flow.
As discussed in the basic textbooks (for example, that of [8]), the mathematical concept of a null space of N gives useful information about the fundamental properties of the biomolecular system described by N. These are two null spaces: the left null space described by the matrix G where GN=0 and the right null space described by the matrix Kp where NKp=0. In the case of the open systems discussed in §2, N is replaced by Ncd.
The significance of G is that pre-multiplying both sides of equation (2.1) by G gives
Hence the linear combinations of X implied by the rows of G are constant; in systems biology nomenclature such combinations are known as conserved moieties. In the case of the example system, one possible matrix G is
It can be verified that GN=0 and the corresponding three conserved moieties are
The significance of Kp is that if the elements of V are not independent but rather defined by V =Kpv then equation (2.1) gives
Hence the columns of Kp determine pathways: combinations of non-zero flows which lead to constant species amounts. In this example, there is no Kp such that NKp=0. However, in the special case that the four species A–D are chemostats (their values are held constant by some external flows) then N now has four zero entries and Kp=1 and thus the four species have constant amounts for any v and thus the single reaction r trivially becomes a pathway. As discussed in the paper, the more complex systems of figures 1, 3 and 8 have non-trivial pathways.
Neither G nor Kp are unique. The seminal contribution discussed by Heinrich & Schuster [5] was to examine the case where the entries of Kp are both integer and non-negative thus defining pathways where all reaction flows have the same sign and are integer multiples of some base flows. This idea forms the basis of analysing large-scale biomolecular systems by flux-balance analysis (FBA) [8]. Together with the bond graph concepts outlined in appendix A, this idea provides the foundation for this paper.
Footnotes
The mathematical concept of a null space is given a biological interpretation in appendix B.
The terms ‘forward’ and ‘reverse’ often correspond to ‘substrate’ and ‘product’ or ‘input’ and ‘output’, respectively; they are used here for consistency with previous work, to avoid ambiguity and to recognize that reactions may be reversible.
This is related to the classical Cone lemma [35], ch. 10.
The Octave [36] version of metatool from http://pinguin.biologie.uni-jena.de/bioinformatik/networks/metatool/metatool5.0/metatool5.0.html was used.
The term ‘slippage’ was used in this context by Terrell L. Hill in his seminal book [14]. An ideal cycle would have no slippage and the link from EM to E★M would not exist in figure 3a.
The Octave [36] version of metatool from http://pinguin.biologie.uni-jena.de/bioinformatik/networks/metatool/metatool5.0/metatool5.0.html was used.
Data accessibility
A virtual reference environment [66] is available for this paper at http://dx.doi.org/10.5281/zenodo.165180. The simulation parameters are listed in the electronic supplementary material.
Authors' contributions
All authors contributed to drafting and revising the paper, and they affirm that they have approved the final version of the manuscript.
Competing interests
We declare we have no competing interests.
statement
This research was in part conducted and funded by the Australian Research Council Centre of Excellence in Convergent Bio-Nano Science and Technology (project no. CE140100036).
References
- 1.Khatri P, Sirota M, Butte AJ. 2012. Ten years of pathway analysis: current approaches and outstanding challenges. PLoS Comput. Biol. 8, e1002375 (doi:10.1371/journal.pcbi.1002375) [DOI] [PMC free article] [PubMed] [Google Scholar]
- 2.Sandefur CI, Mincheva M, Schnell S. 2013. Network representations and methods for the analysis of chemical and biochemical pathways. Mol. BioSyst. 9, 2189–2200. (doi:10.1039/C3MB70052F) [DOI] [PMC free article] [PubMed] [Google Scholar]
- 3.Papin JA, Stelling J, Price ND, Klamt S, Schuster S, Palsson BO. 2004. Comparison of network-based pathway analysis methods. Trends Biotechnol. 22, 400–405. (doi:10.1016/j.tibtech.2004.06.010) [DOI] [PubMed] [Google Scholar]
- 4.Clarke BL. 1988. Stoichiometric network analysis. Cell. Biophys. 12, 237–253. (doi:10.1007/BF02918360) [DOI] [PubMed] [Google Scholar]
- 5.Heinrich R, Schuster S. 1996. The regulation of cellular systems. New York, NY: Chapman & Hall. [Google Scholar]
- 6.Palsson B. 2006. Systems biology: properties of reconstructed networks. Cambridge, UK: Cambridge University Press. [Google Scholar]
- 7.Palsson B. 2011. Systems biology: simulation of dynamic network states. Cambridge, UK: Cambridge University Press. [Google Scholar]
- 8.Klipp E, Liebermeister W, Wierling C, Kowald A, Lehrach H, Herwig R. 2011. Systems biology. New York, NY: Wiley-Blackwell. [Google Scholar]
- 9.Schuster S, Hilgetag C. 1994. On elementary flux modes in biochemical reaction systems at steady state. J. Biol. Syst. 2, 165–182. (doi:10.1142/S0218339094000131) [Google Scholar]
- 10.Pfeiffer T, Sanchez-Valdenebro I, Nuno JC, Montero F, Schuster S. 1999. Metatool: for studying metabolic networks. Bioinformatics 15, 251–257. (doi:10.1093/bioinformatics/15.3.251) [DOI] [PubMed] [Google Scholar]
- 11.Schilling CH, Letscher D, Palsson B. 2000. Theory for the systemic definition of metabolic pathways and their use in interpreting metabolic function from a pathway-oriented perspective. J. Theor. Biol. 203, 229–248. (doi:10.1006/jtbi.2000.1073) [DOI] [PubMed] [Google Scholar]
- 12.Schuster S, Hilgetag C, Woods JH, Fell DA. 2002. Reaction routes in biochemical reaction systems: algebraic properties, validated calculation procedure and example from nucleotide metabolism. J. Math. Biol. 45, 153–181. (doi:10.1007/s002850200143) [DOI] [PubMed] [Google Scholar]
- 13.Lotka AJ. 1922. Contribution to the energetics of evolution. Proc. Natl Acad. Sci. USA 8, 147–151. (doi:10.1073/pnas.8.6.147) [DOI] [PMC free article] [PubMed] [Google Scholar]
- 14.Hill TL. 1989. Free energy transduction and biochemical cycle kinetics. New York, NY: Springer. [Google Scholar]
- 15.Qian H, Beard DA, Liang S-d. 2003. Stoichiometric network theory for nonequilibrium biochemical systems. Eur. J. Biochem. 270, 415–421. (doi:10.1046/j.1432-1033.2003.03357.x) [DOI] [PubMed] [Google Scholar]
- 16.Beard DA, Qian H. 2010. Chemical biophysics: quantitative analysis of cellular systems. Cambridge, UK: Cambridge University Press. [Google Scholar]
- 17.Martin WF, Sousa FL, Lane N. 2014. Energy at life’s origin. Science 344, 1092–1093. (doi:10.1126/science.1251653) [DOI] [PubMed] [Google Scholar]
- 18.Paynter HM. 1961. Analysis and design of engineering systems. Cambridge, MA: MIT Press. [Google Scholar]
- 19.Karnopp DC, Margolis DL, Rosenberg RC. 2012. System dynamics: modeling, simulation, and control of mechatronic systems, 5th edn. New York, NY: John Wiley & Sons.
- 20.Cellier FE. 1991. Continuous system modelling. Berlin, Germany: Springer. [Google Scholar]
- 21.Gawthrop PJ, Smith LPS. 1996. Metamodelling: bond graphs and dynamic systems. Hemel Hempstead, UK: Prentice Hall. [Google Scholar]
- 22.Gawthrop PJ, Bevan GP. 2007. Bond-graph modeling: a tutorial introduction for control engineers. IEEE Control Syst. Mag. 27, 24–45. (doi:10.1109/MCS.2007.338279) [Google Scholar]
- 23.Borutzky W. 2011. Bond graph modelling of engineering systems: theory, applications and software support. Berlin, Germany: Springer. [Google Scholar]
- 24.Borutzky W. (ed.). 2017. Bond graphs for modelling, control and fault diagnosis of engineering systems. New York, NY: Springer. [Google Scholar]
- 25.Greifeneder J, Cellier FE. 2012. Modeling chemical reactions using bond graphs. In Proc. ICBGM12, 10th SCS Intl. Conf. on Bond Graph Modeling and Simulation 2012, Genoa, Italy, 8–11 July, pp. 110–121. San Diego, CA: The Society for Modeling and Simulation International.
- 26.Diaz-Zuccarini V, Pichardo-Almarza C. 2011. On the formalization of multi-scale and multi-science processes for integrative biology. Interface Focus 1, 426–437. (doi:10.1098/rsfs.2010.0038) [DOI] [PMC free article] [PubMed] [Google Scholar]
- 27.Oster G, Perelson A, Katchalsky A. 1971. Network thermodynamics. Nature 234, 393–399. (doi:10.1038/234393a0) [Google Scholar]
- 28.Oster GF, Perelson AS, Katchalsky A. 1973. Network thermodynamics: dynamic modelling of biophysical systems. Q. Rev. Biophys. 6, 1–134. (doi:10.1017/S0033583500000081) [DOI] [PubMed] [Google Scholar]
- 29.Gawthrop PJ, Crampin EJ. 2014. Energy-based analysis of biochemical cycles using bond graphs. Proc. R. Soc. A 470, 20150459 (doi:10.1098/rspa.2014.0459) [DOI] [PMC free article] [PubMed] [Google Scholar]
- 30.Gawthrop PJ, Cursons J, Crampin EJ. 2015. Hierarchical bond graph modelling of biochemical networks. Proc. R. Soc. A 471, 20150642 (doi:10.1098/rspa.2015.0642) [Google Scholar]
- 31.Gawthrop PJ, Crampin EJ. 2016. Modular bond-graph modelling and analysis of biomolecular systems. IET. Syst. Biol. 10, 187–201. (doi:10.1049/iet-syb.2015.0083) [DOI] [PMC free article] [PubMed] [Google Scholar]
- 32.Gawthrop PJ. 2017. Bond-graph modelling and causal analysis of biomolecular systems. In Bond graphs for modelling, control and fault diagnosis of engineering systems (ed. W Borutzky), pp. 587–623. Berlin: Springer International Publishing.
- 33.Eskandari S, Wright EM, Loo DDF. 2005. Kinetics of the reverse mode of the Na+/glucose cotransporter. J. Membr. Biol. 204, 23–32. (doi:10.1007/s00232-005-0743-x) [DOI] [PMC free article] [PubMed] [Google Scholar]
- 34.Polettini M, Esposito M. 2014. Irreversible thermodynamics of open chemical networks. I. Emergent cycles and broken conservation laws. J. Chem. Phys. 141, 024 117 (doi:10.1063/1.4886396) [DOI] [PubMed] [Google Scholar]
- 35.Aigner M, Ziegler GM. 2014. Proofs from the book, 5th edn Berlin, Germany: Springer. [Google Scholar]
- 36.Eaton JW, Bateman D, Hauberg S, Wehbring R. 2015. GNU Octave version 4.0.0 manual: a high-level interactive language for numerical computations. See http://www.gnu.org/software/octave/doc/interpreter.
- 37.Qi F, Dash RK, Han Y, Beard DA. 2009. Generating rate equations for complex enzyme systems by a computer-assisted systematic method. BMC Bioinform. 10, 1–9. (doi:10.1186/1471-2105-10-238) [DOI] [PMC free article] [PubMed] [Google Scholar]
- 38.Parent L, Supplisson S, Loo DDF, Wright EM. 1992. Electrogenic properties of the cloned Na+/glucose cotransporter: I. Voltage-clamp studies. J. Membr. Biol. 125, 49–62. (doi:10.1007/BF00235797) [DOI] [PubMed] [Google Scholar]
- 39.Parent L, Supplisson S, Loo DDF, Wright EM. 1992. Electrogenic properties of the cloned Na+/glucose cotransporter: II. A transport model under nonrapid equilibrium conditions. J. Membr. Biol. 125, 63–79. (doi:10.1007/BF00235798) [DOI] [PubMed] [Google Scholar]
- 40.Chen X-Z, Coady MJ, Jackson F, Berteloot A, Lapointe J-Y. 1995. Thermodynamic determination of the Na+: glucose coupling ratio for the human SGLT1 cotransporter. Biophys. J. 69, 2405–2414. (doi:10.1016/S0006-3495(95)80110-4) [DOI] [PMC free article] [PubMed] [Google Scholar]
- 41.Hunter P. 2016. The virtual physiological human: the physiome project aims to develop reproducible, multiscale models for clinical practice. IEEE. Pulse 7, 36–42. (doi:10.1109/MPUL.2016.2563841) [DOI] [PubMed] [Google Scholar]
- 42.Karnopp D. 1990. Bond graph models for electrochemical energy storage: electrical, chemical and thermal effects. J. Franklin Inst. 327, 983–992. (doi:10.1016/0016-0032(90)90073-R) [Google Scholar]
- 43.Gawthrop PJ, Siekmann I, Kameneva T, Saha S, Ibbotson MR, Crampin EJ.2015. The energetic cost of the action potential: bond graph modelling of electrochemical energy transduction in excitable membranes. (http://arxiv.org/abs/1512.00956. )
- 44.Hille B. 2001. Ion channels of excitable membranes, 3rd edn. Sunderland, MA: Sinauer Associates.
- 45.Nicholls DG, Ferguson ST. 2013. Bioenergetics 4. Amsterdam, The Netherlands: Academic Press. [Google Scholar]
- 46.Sousa FL, Thiergart T, Landan G, Nelson-Sathi S, Pereira IAC, Allen JF, Lane N, Martin WF. 2013. Early bioenergetic evolution. Phil. Trans. R. Soc. B 368, 20130088 (doi:10.1098/rstb.2013.0088) [DOI] [PMC free article] [PubMed] [Google Scholar]
- 47.Pascal R, Pross A, Sutherland JD. 2013. Towards an evolutionary theory of the origin of life based on kinetics and thermodynamics. Open. Biol. 3, 130156 (doi:10.1098/rsob.130156) [DOI] [PMC free article] [PubMed] [Google Scholar]
- 48.Neubauer S. 2007. The failing heart—an engine out of fuel. N Engl. J. Med. 356, 1140–1151. (doi:10.1056/NEJMra063052) [DOI] [PubMed] [Google Scholar]
- 49.Tran K, Loiselle DS, Crampin EJ. 2015. Regulation of cardiac cellular bioenergetics: mechanisms and consequences. Physiol. Rep. 3, e12464 (doi:10.14814/phy2.12464) [DOI] [PMC free article] [PubMed] [Google Scholar]
- 50.Flint Beal M. 1992. Does impairment of energy metabolism result in excitotoxic neuronal death in neurodegenerative illnesses? Ann. Neurol. 31, 119–130. (doi:10.1002/ana.410310202) [DOI] [PubMed] [Google Scholar]
- 51.Wellstead P, Cloutier M. 2011. An energy systems approach to Parkinson’s disease. Wiley Interdisc. Rev. Syst. Biol. Med. 3, 1–6. (doi:10.1002/wsbm.107) [DOI] [PubMed] [Google Scholar]
- 52.Sheng Z-H, Cai Q. 2012. Mitochondrial transport in neurons: impact on synaptic homeostasis and neurodegeneration. Nat. Rev. Neurosci. 13, 77–93. (doi:10.1038/nrn3156) [DOI] [PMC free article] [PubMed] [Google Scholar]
- 53.Wellstead P, Cloutier M (eds). 2012. Systems biology of Parkinson’s disease. New York, NY: Springer. [Google Scholar]
- 54.Wellstead P. 2012. A new look at disease: Parkinson’s through the eyes of an engineer. Stockport, UK: Control Systems Principles.
- 55.Marin-Hernandez A, Gallardo-Perez JC, Rodriguez-Enriquez S, Encalada R, Moreno-Sanchez R, Saavedra E. 2011. Modeling cancer glycolysis. Biochim. Biophys. Acta 1807, 755–767. (doi:10.1016/j.bbabio.2010.11.006) [DOI] [PubMed] [Google Scholar]
- 56.Marin-Hernandez A, Lopez-Ramirez SY, Gallardo-Perez JC, Rodríguez-Enríquez S, Moreno-Sanchez R, Saavedra E. 2014. Systems biology approaches to cancer energy metabolism. In Systems biology of metabolic and signaling networks (eds MA Aon, V Saks U Schlattner), Springer Series in Biophysics, vol. 16, pp. 213–239. Berlin, Germany: Springer.
- 57.Masoudi-Nejad A, Asgari Y. 2014. Metabolic cancer biology: structural-based analysis of cancer as a metabolic disease, new sights and opportunities for disease treatment. Semin. Cancer. Biol. 30, 21–29. (doi:10.1016/j.semcancer.2014.01.007) [DOI] [PubMed] [Google Scholar]
- 58.Alberts B, Johnson A, Lewis J, Morgan D, Raff M, Roberts K, Walter P (eds). 2015. Molecular biology of the cell, 6th edn Abingdon, UK: Garland Science. [Google Scholar]
- 59.Gogvadze V, Orrenius S, Zhivotovsky B. 2008. Mitochondria in cancer cells: what is so special about them? Trends Cell. Biol. 18, 165–173. (doi:10.1016/j.tcb.2008.01.006) [DOI] [PubMed] [Google Scholar]
- 60.Solaini G, Sgarbi G, Baracca A. 2011. Oxidative phosphorylation in cancer cells. Biochim. Biophys. Acta 1807, 534–542. Bioenergetics of Cancer (doi:10.1016/j.bbabio.2010.09.003) [DOI] [PubMed] [Google Scholar]
- 61.Nunnari J, Suomalainen A. 2012. Mitochondria: in sickness and in health. Cell 148, 1145–1159. (doi:10.1016/j.cell.2012.02.035) [DOI] [PMC free article] [PubMed] [Google Scholar]
- 62.Beard DA. 2005. A biophysical model of the mitochondrial respiratory system and oxidative phosphorylation. PLoS Comput. Biol. 1, e36 (doi:10.1371/journal.pcbi.0010036) [DOI] [PMC free article] [PubMed] [Google Scholar]
- 63.Wu F, Yang F, Vinnakota KC, Beard DA. 2007. Computer modeling of mitochondrial tricarboxylic acid cycle, oxidative phosphorylation, metabolite transport, and electrophysiology. J. Biol. Chem. 282, 24 525–24 537. (doi:10.1074/jbc.M701024200) [DOI] [PubMed] [Google Scholar]
- 64.Cortassa S, Aon MA. 2014. Dynamics of mitochondrial redox and energy networks: insights from an experimental-computational synergy. In Systems biology of metabolic and signaling networks (eds MA Aon, V Saks, U Schlattner). Springer Series in Biophysics, vol. 16, pp. 115–144. Berlin, Germany: Springer.
- 65.Bazil JN, Beard DA, Vinnakota KC. 2016. Catalytic coupling of oxidative phosphorylation, ATP demand, and reactive oxygen species generation. Biophys. J. 110, 962–971. (doi:10.1016/j.bpj.2015.09.036) [DOI] [PMC free article] [PubMed] [Google Scholar]
- 66.Hurley DG, Budden DM, Crampin EJ. 2014. Virtual reference environments: a simple way to make research reproducible. Brief. Bioinform. 16, 901–903. (doi:10.1093/bib/bbu043) [DOI] [PMC free article] [PubMed] [Google Scholar]
Associated Data
This section collects any data citations, data availability statements, or supplementary materials included in this article.
Supplementary Materials
Data Availability Statement
A virtual reference environment [66] is available for this paper at http://dx.doi.org/10.5281/zenodo.165180. The simulation parameters are listed in the electronic supplementary material.


