

Abstract
Free water elimination (FWE) in brain diffusion MRI has been shown to improve tissue specificity in human white matter characterization both in health and in disease. Relative to the classical diffusion tensor imaging (DTI) model, FWE is also expected to increase sensitivity to microstructural changes in longitudinal studies. However, it is not clear if these two models differ in their test–retest reproducibility. This study compares a bi‐tensor model for FWE with DTI by extending a previous longitudinal‐reproducibility 3T multisite study (10 sites, 7 different scanner models) of 50 healthy elderly participants (55–80 years old) scanned in two sessions at least 1 week apart. We computed the reproducibility of commonly used DTI metrics (FA: fractional anisotropy, MD: mean diffusivity, RD: radial diffusivity, and AXD: axial diffusivity), derived either using a DTI model or a FWE model. The DTI metrics were evaluated over 48 white‐matter regions of the JHU‐ICBM‐DTI‐81 white‐matter labels atlas, and reproducibility errors were assessed. We found that relative to the DTI model, FWE significantly reduced reproducibility errors in most areas tested. In particular, for the FA and MD metrics, there was an average reduction of approximately 1% in the reproducibility error. The reproducibility scores did not significantly differ across sites. This study shows that FWE improves sensitivity and is thus promising for clinical applications, with the potential to identify more subtle changes. The increased reproducibility allows for smaller sample size or shorter trials in studies evaluating biomarkers of disease progression or treatment effects. Hum Brain Mapp 38:12–26, 2017. © 2016 Wiley Periodicals, Inc.
Keywords: multisite diffusion MRI, free‐water imaging, test–retest reproducibility, brain diffusion tensor imaging, longitudinal, healthy elderly
INTRODUCTION
Diffusion MRI is a noninvasive tool able to provide unique in vivo microstructural information (Basser et al., 1994; Basser and Pierpaoli, 1996), especially useful for the study of white‐matter structure and organization (Assaf and Pasternak, 2008). The commonly used diffusion tensor imaging (DTI) model, allows the characterization of water diffusion in white matter through metrics like fractional anisotropy (FA), mean diffusivity (MD), axial diffusivity (AXD), and radial diffusivity (RD). These metrics were able to identify the microstructure and subtle pathologies of white matter in numerous basic neuroscience and clinical applications (Alexander et al., 2007; Assaf and Pasternak, 2008; Basser and Jones, 2002; Le Bihan et al., 2001).
The single‐tensor DTI model, however, has the limitation that it assumes a single tissue compartment per voxel, thus generating biased DTI metrics in voxels consisting of a mixture of white matter and freely moving extracellular water molecules (Alexander et al., 2001; Jones and Cercignani, 2010; O'Donnell and Pasternak, 2015). To address this limitation, free water elimination (FWE) methods that include an explicit compartment modeling free water have been proposed (Baron and Beaulieu, 2014; Hoy et al., 2014; Metzler‐Baddeley et al.,2012; Pasternak et al., 2012a; Pasternak et al., 2009; Zhang et al., 2012). Free water contributions are not only limited to CSF partial volume effects at the border of the ventricles and brain parenchyma, but also found within deep white matter structures, potentially providing additional structural information (Pasternak et al., 2009). Of the abovementioned FWE methods, the bi‐tensor method by Pasternak et al., 2009 is a data processing approach fully compatible with clinical DTI acquisition protocols. By eliminating free water, the FWE methods improve the specificity to white matter of the DTI metrics and have been successfully applied to a variety of neurological disorders (e.g. schizophrenia, Alzheimer's disease, Parkinson's disease, Huntington's disease, traumatic head injuries, and major depressive disorder) showing stronger cross‐sectional effects relative to the single‐tensor model (Bergamino et al., 2015; Maier‐Hein et al., 2014; Mandl et al., 2015; Metzler‐Baddeley et al., 2012; Ofori et al., 2015a, 2015b; Pasternak et al., 2012b; Steventon et al., 2016).
The abovementioned work suggests that the FWE model offers improved specificity by separating free water from white matter tissue, resulting with a more accurate characterization of white matter diffusion properties. In addition, the model provides a separate characterization of the fractional volume of tissue and free water. In this study, we evaluate the test–retest reproducibility of the diffusion metrics derived from the FWE model. Quantitative characterization of test–retest reproducibility is a measure of robustness, and is important, for example, to estimate the number of subjects required for a longitudinal study (Diggle et al., 2002). Reducing the reproducibility errors of the single‐tensor model has direct cost implications, as it allows reaching the same statistical power with a smaller sample size, which is particularly important when planning large multisite studies (Horn and Toga, 2009).
When characterizing longitudinal changes in white‐matter microstructure, FWE may help reduce reproducibility errors for several reasons. Variability in brain slice positioning across MRI sessions can lead to different CSF‐contamination‐based partial volume effects (Metzler‐Baddeley et al., 2012, Vos et al., 2011). In addition, the extracellular volume is likely more affected by transient changes, such as dehydration, temperature, and stress, which may change between scans, but do not necessarily mean that the brain tissue itself has changed. The aim of this study is to compare the longitudinal test–retest reproducibility errors of DTI metrics commonly used in clinical studies (FA, MD, AXD, and RD) when derived from the single‐tensor DTI model versus the bi‐tensor FWE diffusion model. The underlying hypothesis is that the improved specificity to white‐matter diffusion properties offered by FWE should also reduce test–retest variability, thereby improving reproducibility.
MATERIALS AND METHODS
The data used in this study was acquired as part of the PharmaCog project, a large European project aimed at profiling biomarkers sensitive to prodromal Alzheimer's disease in elderly subjects with amnestic mild cognitive impairment in the age range of 50–80 (Galluzzi et al., 2016). The raw MRI data of the healthy subjects is public, its demographics, study design, and data preparation steps have been described in a preliminary calibration study showing that test–retest reproducibility errors of diffusion metrics derived from the standard single‐tensor model were consistent across sites and consistent with previous reports of single site studies (Jovicich et al., 2014).
Ten clinical European 3T MRI sites using Philips, GE, and Siemens scanners participated in this study, each site had a single MRI scanner. To evaluate test–retest reproducibility of the scanners participating in the PharmaCog project, each site recruited 5 volunteers in the age range of 50–80 years with no history of major psychiatric, neurological, or cognitive impairment. A total of 50 subjects participated; two subjects were excluded because of missing data (one from site 3 and one from site 10). Participants were scanned in two sessions (“test” and “retest”) between 7 days and a maximum of 60 days apart.
The diffusion MRI acquisition protocol was calibrated across sites: b value = 700 s/mm2, 5 b0 volumes, 30 gradient directions, voxel size 2 × 2 × 2 mm3, 64 axial slices, zero slice gap. Siemens and GE scanners allowed saving the 5 b0 volumes separately, whereas the Philips scanners saved only one volume corresponding to the average of the 5 b0 acquisitions. More details about site‐specific differences are described in our previous study (Jovicich et al., 2014).
This study introduces the following new analyses: (i) the fitting of a bi‐tensor model for FWE (Pasternak et al., 2009); (ii) comparison of test–retest reproducibility of DTI metrics, with and without FWE; and (iii) evaluation of reproducibility on 48 white matter regions of the JHU‐ICBM‐DTI‐81 white‐matter labels atlas (instead of 9 ROIs that were previously evaluated). The overall goal was to test whether or not FWE improves test–retest reproducibility of DTI metrics relative to the single‐tensor method, on wider brain coverage of white‐matter areas.
Free Water Elimination
Data preprocessing was performed with DTIPrep and it included automatic quality assurance, omitting image volumes containing severe artifacts, head motion correction, and eddy‐current correction (Liu et al., 2010) (http://www.nitrc.org/projects/dtiprep). The brain was masked using brain extraction tool (BET, FMRIB software library; http://fsl.fmrib.ox.ac.uk/fsl/fslwiki) (Smith, 2002). These preprocessing steps were identical to those taken in Jovicich et al. (2014), where additional preprocessing details can be found.
The preprocessed data were then fitted to the DTI model and to the bi‐tensor FWE model. DTI analysis was performed by the least squares method, estimating a tensor for each image voxel (Basser and Jones, 2002), using the “Diffusion Tensor Estimation” module in 3D Slicer (http://www.slicer.org). Details about the FWE used here have been previously described elsewhere (Pasternak et al. 2014, 2009). Briefly, the model considers two co‐existing compartments per voxel: one compartment is a free‐water compartment, which models isotropic diffusion with a diffusion coefficient of water at body temperature fixed to 3 × 10⁻³ mm2/s. Due to the fast diffusivity and short diffusion time, free‐water molecules are expected only at large enough extracellular spaces. The second compartment is the tissue compartment, which accounts for all other molecules, i.e., all intra and extracellular molecules that are hindered or restricted by tissue membranes (Pasternak et al., 2009). The tissue compartment is modeled by a diffusion tensor. The FWE method estimates this tensor, as well as the fractional volume of the free‐water compartment. To do so, the algorithm, implemented in Matlab (The MathWorks Inc., Natick, MA, USA), applies tensor regularization, which stabilizes the model fit (Pasternak et al. 2009). DTI indices (FA, RD, MD, and AXD) were extracted using the “Diffusion Tensor Scalar Measurements” module in 3D Slicer, either from the conventional diffusion tensors or from those fitted by the FWE model, yielding free‐water‐corrected DTI indices. This approach enabled the direct comparison of the corrected and uncorrected DTI indices.
TBSS and Atlas‐Based ROI Analysis
For each site, a white matter skeleton was created from the mean uncorrected FA images of all subjects using the standard Tract‐Based Spatial Statistics (TBSS) analysis (Smith et al., 2006). All the other individual subjects' diffusivity measures (with and without FWE), as well as the fractional volume of free‐water maps, were then projected onto the white‐matter skeleton.
To estimate the reproducibility in specific white‐matter areas, the different measures were averaged over the JHU‐ICBM‐DTI‐81 WM labels atlas (Mori et al., 2005) ROIs, overlapped with the corresponding site's skeleton (Jovicich et al., 2014). The projection of the scalar maps from both analyses methods (with and without FWE), in each site, onto the same skeleton, ensured that the reproducibility was evaluated on the same projections.
No white‐matter lesions were found in this dataset (Jovicich et al., 2014), therefore, DTI metrics over the right‐ and left‐brain hemispheres were averaged for each subject. The JHU‐ICBM‐DTI‐81 WM labels atlas contains 48 WM labels, 6 of which are bilateral (middle cerebral peduncle, pontine crossing tract, body, splenium, genu of the corpus callosum, and fornix). As a result, averaging across hemispheres gives a total of 27 WM labels (Table 1).
Table 1.
Regions of interest ordered by increasing volume size and corresponding reproducibility scores, with and without FWE
| Mean Volume (mm3) | AXD reproducibility errors (%) | FA reproducibility errors (%) | MD reproducibility errors (%) | RD reproducibility errors (%) | FW map reproducibility errors (%) | |||||
|---|---|---|---|---|---|---|---|---|---|---|
| DTI | FWE | DTI | FWE | DTI | FWE | DTI | FWE | |||
| Uncinate fasciculus | 64 ± 7 | 5.2 ± 3.4 | 3.7 ± 2.2 | 5.8 ± 3.7 | 3.8 ± 2.2 | 6.2 ± 4.6 | 2.5 ± 2.7 | 9.1 ± 6.2 | 5.3 ± 4.2 | 17.5 ± 11.9 |
| Superior fronto‐occipital fasciculus | 96 ± 29 | 5.0 ± 2.9 | 3.6 ± 2.2 | 5.4 ± 3.4 | 4.6 ± 3.0 | 4.9 ± 3.6 | 2.3 ± 1.8 | 6.5 ± 5.3 | 4.7 ± 3.5 | 18.2 ± 11.6 |
| Tapetum | 111 ± 33 | 4.2 ± 2.5 | 4.8 ± 3.0 | 3.9 ± 2.2 | 2.8 ± 1.9 | 5.1 ± 3.1 | 5.5 ± 4.7 | 7.0 ± 4.2 | 9.7 ± 8.3 | 10.4 ± 5.7 |
| Fornix | 172 ± 29 | 4.0 ± 3.5 | 5.4 ± 4.7 | 7.9 ± 6.1 | 6.5 ± 6.3 | 4.6 ± 4.6 | 7.9 ± 6.9 | 5.8 ± 5.8 | 12.4 ± 10.9 | 7.1 ± 6.4 |
| Inferior cerebellar peduncle | 193 ± 32 | 3.5 ± 2.6 | 2.9 ± 2.3 | 4.4 ± 2.8 | 3.0 ± 3.0 | 4.6 ± 2.4 | 2.5 ± 1.6 | 6.8 ± 3.6 | 4.2 ± 2.3 | 13.5 ± 7.2 |
| Medial lemniscus | 196 ± 27 | 3.6 ± 2.7 | 3.0 ± 2.4 | 3.7 ± 2.5 | 2.9 ± 1.8 | 4.3 ± 3.1 | 2.0 ± 1.8 | 6.4 ± 4.1 | 4.9 ± 3.0 | 12.4 ± 9.3 |
| Superior cerebellar peduncle | 203 ± 26 | 4.0 ± 2.3 | 4.7 ± 3.0 | 3.2 ± 1.9 | 2.1 ± 1.2 | 5.0 ± 2.7 | 5.5 ± 3.2 | 7.9 ± 4.5 | 11.2 ± 6.9 | 10.7 ± 5.9 |
| Fornix (stria terminalis) | 265 ± 33 | 3.8 ± 2.2 | 3.7 ± 1.9 | 4.0 ± 2.2 | 2.7 ± 1.5 | 3.9 ± 2.5 | 2.6 ± 1.8 | 5.3 ± 3.2 | 4.0 ± 2.4 | 10.4 ± 6.4 |
| Cingulum (hippocampus) | 310 ± 43 | 4.0 ± 3.1 | 2.8 ± 2.1 | 5.0 ± 3.1 | 3.9 ± 2.4 | 4.2 ± 3.0 | 1.8 ± 1.2 | 5.3 ± 3.5 | 4.7 ± 2.9 | 12.0 ± 8.0 |
| Cingulum (cigulate gyrus) | 313 ± 51 | 3.5 ± 2.3 | 2.5 ± 1.6 | 2.9 ± 1.7 | 2.3 ± 1.6 | 3.5 ± 2.5 | 1.4 ± 1.0 | 4.7 ± 3.2 | 2.9 ± 1.8 | 11.3 ± 6.8 |
| Pontine crossing tract | 357 ± 78 | 3.2 ± 2.5 | 2.4 ± 1.7 | 4.3 ± 2.6 | 3.2 ± 2.1 | 3.6 ± 3.0 | 1.8 ± 1.5 | 5.1 ± 4.1 | 3.4 ± 1.9 | 10.9 ± 10.4 |
| Corticospinal tract | 371 ± 54 | 4.1 ± 2.2 | 3.8 ± 2.2 | 4.1 ± 2.5 | 3.3 ± 1.9 | 4.0 ± 2.7 | 2.8 ± 2.0 | 5.5 ± 4.1 | 4.4 ± 3.2 | 10.2 ± 7.2 |
| Sagittal stratum | 460 ± 55 | 2.5 ± 1.7 | 2.2 ± 1.4 | 3.0 ± 1.5 | 1.7 ± 1.0 | 2.6 ± 2.1 | 1.4 ± 1.0 | 3.9 ± 2.8 | 2.7 ± 1.8 | 7.7 ± 5.6 |
| Cerebral peduncle | 495 ± 80 | 3.3 ± 2.1 | 3.4 ± 2.0 | 2.3 ± 1.3 | 1.5 ± 0.9 | 3.8 ± 2.6 | 3.2 ± 2.3 | 5.8 ± 3.7 | 5.2 ± 4.1 | 9.9 ± 5.7 |
| Retrolenticular part internal capsule | 624 ± 65 | 2.5 ± 1.5 | 2.0 ± 1.1 | 2.6 ± 1.6 | 1.7 ± 1.1 | 2.7 ± 1.8 | 1.1 ± 0.9 | 4.2 ± 2.6 | 2.7 ± 1.8 | 8.1 ± 5.8 |
| Posterior corona radiata | 635 ± 91 | 2.5 ± 1.5 | 1.7 ± 1.0 | 2.2 ± 1.1 | 2.1 ± 1.1 | 2.3 ± 1.6 | 0.7 ± 0.5 | 2.6 ± 2.0 | 1.6 ± 1.0 | 6.6 ± 5.0 |
| Posterior thalamic radiation | 650 ± 67 | 2.0 ± 1.6 | 1.9 ± 1.4 | 2.3 ± 1.3 | 1.6 ± 0.9 | 2.1 ± 1.4 | 1.4 ± 1.0 | 3.0 ± 1.8 | 2.7 ± 1.5 | 5.2 ± 3.6 |
| Anterior limb internal capsule | 763 ± 80 | 2.8 ± 1.8 | 2.1 ± 1.4 | 2.4 ± 1.5 | 1.6 ± 1.1 | 3.1 ± 2.0 | 1.8 ± 1.1 | 4.3 ± 2.9 | 3.0 ± 1.7 | 9.0 ± 6.7 |
| Posterior limb internal capsule | 826 ± 65 | 2.2 ± 1.3 | 1.6 ± 1.0 | 2.2 ± 1.5 | 1.3 ± 1.0 | 2.9 ± 2.0 | 1.2 ± 0.8 | 5.0 ± 3.8 | 3.1 ± 2.2 | 11.2 ± 7.7 |
| Anterior corona radiata | 1337 ± 210 | 2.1 ± 1.6 | 1.3 ± 1.0 | 3.0 ± 1.9 | 2.3 ± 1.6 | 2.1 ± 1.7 | 0.4 ± 0.4 | 2.7 ± 1.9 | 1.6 ± 1.0 | 7.0 ± 4.9 |
| Superior corona radiata | 1371 ± 144 | 2.6 ± 1.8 | 1.6 ± 1.1 | 2.6 ± 1.7 | 2.2 ± 1.3 | 2.9 ± 2.2 | 0.6 ± 0.8 | 3.6 ± 2.7 | 1.8 ± 1.2 | 10.2 ± 7.3 |
| Superior longitudinal fasciculus | 1418 ± 199 | 2.6 ± 1.8 | 1.6 ± 1.0 | 2.6 ± 1.2 | 2.1 ± 1.2 | 2.6 ± 2.0 | 0.5 ± 0.5 | 3.1 ± 2.2 | 1.7 ± 1.0 | 8.5 ± 6.5 |
| External capsule | 1423 ± 120 | 2.5 ± 1.6 | 1.8 ± 1.1 | 3.0 ± 2.1 | 2.8 ± 1.8 | 2.5 ± 1.7 | 0.8 ± 0.7 | 3.0 ± 2.1 | 1.8 ± 1.3 | 6.8 ± 4.5 |
| Genu | 1815 ± 150 | 2.1 ± 1.8 | 2.1 ± 2.0 | 2.2 ± 1.6 | 1.0 ± 0.6 | 2.2 ± 2.0 | 1.8 ± 1.5 | 3.7 ± 3.3 | 2.5 ± 1.7 | 6.9 ± 6.2 |
| Splenium | 2351 ± 284 | 1.7 ± 1.3 | 1.8 ± 1.5 | 1.0 ± 0.8 | 0.5 ± 0.4 | 1.7 ± 1.4 | 1.7 ± 1.3 | 2.9 ± 2.4 | 2.5 ± 2.1 | 5.5 ± 4.6 |
| Middle cerebellar peduncle | 2379 ± 300 | 2.6 ± 2.3 | 2.6 ± 2.4 | 1.8 ± 1.5 | 1.5 ± 1.0 | 2.8 ± 2.4 | 2.5 ± 2.4 | 3.4 ± 3.2 | 3.2 ± 3.5 | 5.5 ± 5.1 |
| Body | 3196 ± 213 | 2.5 ± 1.8 | 2.7 ± 2.1 | 1.9 ± 1.5 | 1.0 ± 0.9 | 2.4 ± 1.7 | 2.1 ± 1.5 | 3.2 ± 2.8 | 2.6 ± 2.2 | 5.8 ± 5.4 |
| Average across all ROIs | – | 3.2 ± 2.1 | 2.8 ± 1.9 | 3.3 ± 2.1 | 2.4 ± 1.7 | 3.4 ± 2.5 | 2.2 ± 1.7 | 4.8 ± 3.4 | 4.0 ± 2.9 | 9.8 ± 3.8 |
Mean ROI volume (mm3) (mean ± SD) and test–retest reproducibility errors (%) averaged across subjects (mean ± SD) for uncorrected (DTI), FWE‐corrected AXD, FA, MD, RD, and free water (FW) map across the 27 white‐matter labels of the JHU‐ICBM‐DTI‐81 white‐matter labels atlas. White cells denote no significant differences, blue cells denote significant improvement of reproducibility scores with FWE, and grey cells denote significant worsening of reproducibility with FWE. The statistics of each cell in the table is done on N = 48 subjects using a two‐tailed Wilcoxon signed rank test, P < 0.05. [Color table can be viewed at http://wileyonlinelibrary.com.]
Previous studies have evaluated how FWE changes diffusion metrics relative to those estimated by the standard DTI model (Bergamino et al., 2015; Maier‐Hein et al., 2014; Metzler‐Baddeley et al., 2012; Ofori et al., 2015a; Pasternak et al., 2014; Steventon et al., 2016). For comparison purposes, we also evaluated such changes (for example, the percent change in FA was computed as (FAFWE − FADTI)/FADTI, averaging across ROIs and subjects. Test–retest reproducibility score (ɛ) of the DTI metrics was evaluated calculating the percent absolute change relative to the mean (Jovicich et al., 2014) for each diffusion metric (DM) as follows:
for each ROI, with and without FWE, where lower scores indicate better reproducibility. These reproducibility scores were then averaged across subjects for each site to test for site effects, and then across sites after confirming that there were no sites effects.
A complementary approach for characterizing variability between scans is by estimating the intraclass correlation coefficient (ICC). Unlike the test–retest reproducibility score ɛ, which focuses on within‐subject variability, the ICC combines both within and across subject variability. A one‐way random effect ICC(1) was used to evaluate the degree of absolute agreement across sessions following rank‐order data transformation to make the test nonparametric (McGraw and Wong, 1996, Shrout and Fleiss, 1979). Considering subjects as “targets” and test–retest sessions as “raters,” the ICC measures the proportion of variance between repeated sessions out of the total variance across subjects and sessions. The ICC value was calculated separately for each diffusion scalar metric and for each ROI, with and without FWE as follows:
where is the expected mean square difference within subjects (“raters”).
Statistical Analysis
Data were analyzed using Matlab (The MathWorks Inc., Natick, MA, USA) version 2015b. To test for MRI site effects of test–retest reproducibility, we used a one‐way Kruskall–Wallis test. To test for differences in reproducibility with and without FWE, for each DTI metric and ROI, we used a two‐tailed Wilcoxon signed rank test. To correct for multiple comparisons across ROIs, we used False Discovery Rate (FDR) (Benjamini and Hochberg, 1995; Benjamini and Yekutieli, 2001).
Both age (higher difficulty to stay still during the scan) and the interval between the two scans (higher influences of scanner instabilities and subject physiological changes) can potentially affect reproducibility (Bonekamp et al., 2007; Charlton et al., 2006; Sullivan et al., 2010). Therefore, we evaluate the correlation between reproducibility and these variables using the Spearman correlation test, corrected for multiple comparisons. For all tests, the threshold for significance was P < 0.05.
To test for differences in reproducibility (test–retest reproducibility score and ICC) with and without FWE, for each DTI metric and ROI, we used a two‐tailed Wilcoxon signed rank test.
Sample Size Comparison
Reproducibility errors affect sample size calculations in longitudinal studies. Sample size is of interest due to its various practical implications, in particular study costs. We used the formulation of longitudinal sample size calculation to compare the sample size ratio between the two diffusion models in terms of the percent of subjects that would be needed when using the FWE model as opposed to the single‐tensor model (Diggle et al., 2002; Reuter et al., 2012; Jovicich et al., 2013). For each diffusion metric and ROI, we calculated the sample size ratio, which is independent from effect size assumptions, as follows:
where σ 2 is the group variance and ρ is the correlation of the across‐session test–retest estimates for the uncorrected (DTI) and the FWE‐corrected data. The standard error of the SSfrac was estimated using bootstrapping (1000 resamples).
RESULTS
The complete DTI dataset consisted of 48 subjects scanned twice, 10 MRI sites, 4 subjects per site for site 3 and site 10, and 5 subjects for all the other sites. Quality assurance results, signal‐to‐noise ratio, and head motion analysis were previously reported in Jovicich et al. (2014).
Free Water Elimination: Effects on Diffusion Metrics and Free Water Maps
Averaging over all ROIs and subjects, we found that relative to the standard DTI analysis, FWE had a mean FA increase of (23 ± 6) %, with mean increase in the FA value of 0.11 ± 0.01, a mean MD decrease of (27 ± 3) %, with a mean decrease in the value of 0.22 ± 0.02, a mean RD decrease of (39 ± 4) %, with a mean decrease in the value of 0.22 ± 0.02, and a mean AXD decrease of (18 ± 2) %, with a mean decrease in the value of 0.22 ± 0.01. The average FWE volume fraction was 0.17 ± 0.09.
Free Water Elimination: Effects on Across‐Session Test–Retest Reproducibility
There were no significant differences in reproducibility across MR sites for all metrics and ROIs (Kruskall–Wallis, P > 0.05), except for RD in the superior Corona Radiata (P value = 0.047). In the proceeding analyses, we therefore grouped the reproducibility scores from all 48 subjects regardless of MRI site.
Table 1 lists the ROIs ordered by increasing volume size, and their corresponding reproducibility scores, with and without FWE. In this table, cells with blue background denote significant improvement of reproducibility in FWE scores relative to uncorrected scores, with gray background denote significant worsening of reproducibility with FWE, and with white background denote no significant differences between the two models. Test–retest reproducibility was significantly improved by FWE in most white matter ROIs (Wilcoxon test, P < 0.05 with FDR). From the 27 ROIs, reproducibility was improved in 15 ROIs for AXD (55%), 16 ROIs for RD (59%), 20 ROIs for MD (74%), and 22 ROIs for FA (81%). In six instances (within three ROIs), FWE resulted with worse reproducibility (see cells with gray background in Table 1). Using the single‐tensor DTI model, the indices with the best reproducibility were AXD (3.2%±2.1%), followed by FA (3.3%±2.1%), MD (3.4%±2.5%), and RD (4.8%±3.4%). When applying the FWE model, the index with best reproducibility was MD (2.2%±1.7%), followed by FA (2.4%±1.7%), AXD (2.8%±1.9%), and RD (4.0%±2.9%). The test–retest reproducibility was also calculated for the free water maps for each ROI (Table 1), showing in general worse scores than the DTI metrics (9.8 ± 3.8%).
To highlight the effect of ROI size on test–retest reproducibility, Figure 1 presents the separate plots for each DTI metric. The plots show the mean reproducibility score (Table 1) over the volume in cubic millimeters of each ROI, for the two analyzed models (DTI in red; FWE in blue). In this figure, full circles represent significant improvement in reproducibility by FWE, crosses represent significant worsening in reproducibility by FWE, and empty circles represent no significant effects between the DTI and FWE models. From this figure, we see that reproducibility is improved as the size of the ROI grows, and that FWE improves reproducibility in FA across all ROI sizes, and has more effect on MD, RD, and AXD in smaller ROIs (<1800 mm3). Figure 2 shows the histograms of reproducibility scores for the two models. The overall distribution of reproducibility scores is skewed to the left for FWE (blue) comparing with DTI (red).
Figure 1.
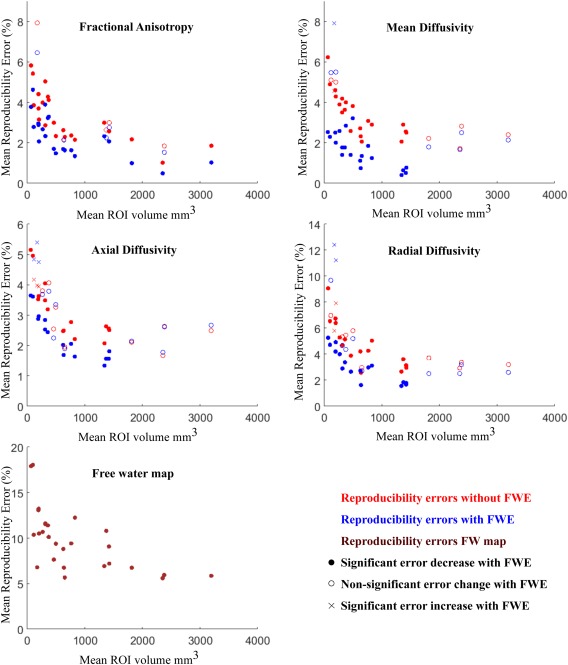
Reproducibility errors of diffusion metrics: effects of ROI size and free water elimination. Red symbols are for uncorrected maps, blue symbols are for FWE maps, dark red symbols are for free water maps. The statistical significance between the reproducibility of uncorrected and FWE‐corrected data corresponds to the results from Table 1 and is shown here by using different symbols: full circles represent ROIs where FWE significantly reduces reproducibility errors, empty circles where there are no significant differences, and crosses where FWE significantly increases errors. [Color figure can be viewed at http://wileyonlinelibrary.com.]
Figure 2.
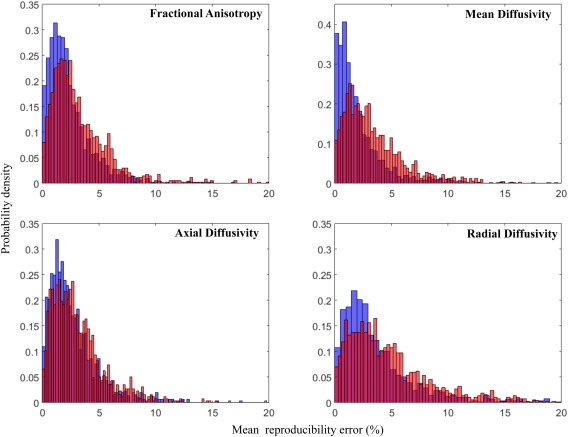
Reproducibility errors of diffusion metrics: whole‐brain normalized histogram distributions. For each diffusion metric (FA, MD, AXD, RD), the normalized reproducibility histograms for uncorrected (red) and FWE‐corrected data (blue) are shown. [Color figure can be viewed at http://wileyonlinelibrary.com.]
There were no significant correlations between reproducibility scores and age or between reproducibility scores and the interval between scans, in any of the ROIs and metrics studied.
Tables 2, 3, 4, 5 show the ICC score and confidence intervals (CI), with and without FWE, for the various ROIs and DTI metrics. Both FWE and uncorrected data had moderate‐to‐high ICC values, with a tendency of higher ICCs for larger ROIs (Tables 2, 3, 4, 5). When considering all ROIs, the effects of FWE on ICC were mixed. For two diffusion metrics, there were no significant ICC differences (FA: P = 0.3613, Table 2; RD: P = 0.8854, Table 5); for AXD, the ICC improved with FWE (P= 0.0029, Table 4); and for MD, the ICC was reduced with FWE (P = 0.025, Table 3). Both analyses methods, single‐tensor and FWE, were consistent in terms of the diffusion metrics with highest ICC. With the single‐tensor DTI model, after averaging across ROIs, FA showed the highest reproducibility (mean ± SD) (ICC: 0.87 ± 0.05), followed by AXD (ICC: 0.84 ± 0.07), RD (ICC: 0.83 ± 0.09), and MD (ICC: 0.81 ± 0.09). FWE measures were similar, with FA as the most reproducible metric (ICC: 0.87 ± 0.05), followed by AXD (ICC: 0.86 ± 0.07), RD (ICC: 0.82 ± 0.14), and MD (ICC: 0.77 ± 0.12).
Table 2.
ICC values of fractional anisotropy (FA), with (FWE) and without (DTI) free water elimination
| White‐matter ROIs | Fractional anisotropy ICC | |
|---|---|---|
| DTI | FWE | |
| Uncinate fasciculus | 0.82 [0.69–0.89] | 0.86 [0.76–0.92] |
| Superior fronto‐occipital fasciculus | 0.83 [0.71–0.90] | 0.85 [0.75–0.91] |
| Tapetum | 0.91 [0.84–0.95] | 0.70 [0.52–0.82] |
| Fornix | 0.83 [0.72–0.90] | 0.88 [0.79–0.93] |
| Inferior cerebellar peduncle | 0.84 [0.74–0.91] | 0.79 [0.66–0.88] |
| Medial lemniscus | 0.77 [0.63–0.87] | 0.79 [0.66–0.88] |
| Superior cerebellar peduncle | 0.79 [0.66–0.88] | 0.73 [0.56–0.84] |
| Fornix (stria terminalis) | 0.85 [0.75–0.91] | 0.86 [0.76–0.92] |
| Cingulum (hippocampus) | 0.78 [0.65–0.87] | 0.82 [0.70–0.89] |
| Cingulum (cigulate gyrus) | 0.88 [0.80–0.93] | 0.91 [0.85–0.95] |
| Pontine crossing tract | 0.84 [0.74–0.91] | 0.81 [0.68–0.89] |
| Corticospinal tract | 0.83 [0.71–0.90] | 0.78 [0.64–0.87] |
| Sagittal stratum | 0.88 [0.80–0.93] | 0.91 [0.84–0.95] |
| Cerebral peduncle | 0.88 [0.80–0.93] | 0.86 [0.76–0.92] |
| Retrolenticular part internal capsule | 0.86 [0.76–0.92] | 0.87 [0.78–0.92] |
| Posterior corona radiata | 0.94 [0.89–0.96] | 0.93 [0.88–0.96] |
| Posterior thalamic radiation | 0.94 [0.89–0.96] | 0.99 [0.98–0.99] |
| Anterior limb internal capsule | 0.91 [0.85–0.95] | 0.94 [0.90–0.97] |
| Posterior limb internal capsule | 0.82 [0.70–0.90] | 0.89 [0.82–0.94] |
| Anterior corona radiata | 0.94 [0.90–0.97] | 0.93 [0.88–0.96] |
| Superior corona radiata | 0.92 [0.86–0.95] | 0.94 [0.90–0.97] |
| Superior longitudinal fasciculus | 0.95 [0.91–0.97] | 0.93 [0.88–0.96] |
| External capsule | 0.92 [0.87–0.96] | 0.92 [0.86–0.95] |
| Genu | 0.92 [0.86–0.95] | 0.93 [0.87–0.96] |
| Splenium | 0.93 [0.87–0.96] | 0.94 [0.89–0.97] |
| Middle cerebellar peduncle | 0.89 [0.81–0.94] | 0.90 [0.83–0.94] |
| Body | 0.89 [0.81–0.94] | 0.90 [0.83–0.94] |
| Average ICC across all ROIs (mean±SD) | 0.87 ± 0.05 | 0.87 ± 0.07 |
For each of the 27 ROIs of the JHU‐ICBM‐DTI‐81 white‐matter labels atlas (ordered by increasing volume size), the ICC values and the corresponding confidence interval (CI) [lower bound − upper bound] were quantified for uncorrected (DTI) and FWE‐corrected FA. The statistics of the last line is done on N = 27 ROIs comparing the uncorrected and FWE‐corrected ICC values using a two‐tailed Wilcoxon signed rank test, P < 0.05. SD: standard deviation.
Table 3.
ICC values of mean diffusivity (MD), with (FWE) and without (DTI) free water elimination
| White‐matter ROIs | Mean diffusivity ICC | |
|---|---|---|
| DTI | FWE | |
| Uncinate fasciculus | 0.71 [0.54–0.83] | 0.59 [0.37–0.74] |
| Superior fronto‐occipital fasciculus | 0.69 [0.51–0.81] | 0.69 [0.51–0.81] |
| Tapetum | 0.89 [0.81–0.94] | 0.71 [0.53–0.82] |
| Fornix | 0.89 [0.82–0.94] | 0.88 [0.80–0.93] |
| Inferior cerebellar peduncle | 0.71 [0.54–0.83] | 0.63 [0.43–0.78] |
| Medial lemniscus | 0.62 [0.41–0.77] | 0.50 [0.26–0.68] |
| Superior cerebellar peduncle | 0.77 [0.63–0.87] | 0.59 [0.37–0.74] |
| Fornix (stria terminalis) | 0.86 [0.76–0.92] | 0.75 [0.60–0.85] |
| Cingulum (hippocampus) | 0.66 [0.47–0.79] | 0.72 [0.54–0.83] |
| Cingulum (cigulate gyrus) | 0.68 [0.50–0.81] | 0.70 [0.52–0.82] |
| Pontine crossing tract | 0.87 [0.78–0.93] | 0.82 [0.70–0.90] |
| Corticospinal tract | 0.78 [0.64–0.87] | 0.60 [0.38–0.75] |
| Sagittal stratum | 0.95 [0.91–0.97] | 0.86 [0.76–0.92] |
| Cerebral peduncle | 0.75 [0.60–0.85] | 0.79 [0.66–0.88] |
| Retrolenticular part internal capsule | 0.88 [0.79–0.93] | 0.84 [0.73–0.91] |
| Posterior corona radiata | 0.89 [0.81–0.94] | 0.82 [0.70–0.89] |
| Posterior thalamic radiation | 0.93 [0.88–0.96] | 1.00 [0.99–1.00] |
| Anterior limb internal capsule | 0.82 [0.70–0.89] | 0.82 [0.69–0.89] |
| Posterior limb internal capsule | 0.75 [0.60–0.85] | 0.87 [0.78–0.92] |
| Anterior corona radiata | 0.87 [0.79–0.93] | 0.88 [0.80–0.93] |
| Superior corona radiata | 0.78 [0.64–0.87] | 0.81 [0.69–0.89] |
| Superior longitudinal fasciculus | 0.88 [0.80–0.93] | 0.87 [0.78–0.93] |
| External capsule | 0.91 [0.84–0.95] | 0.89 [0.82–0.94] |
| Genu | 0.80 [0.68–0.89] | 0.86 [0.77–0.92] |
| Splenium | 0.93 [0.88–0.96] | 0.88 [0.79–0.93] |
| Middle cerebellar peduncle | 0.83 [0.72–0.90] | 0.74 [0.58–0.85] |
| Body | 0.80 [0.67–0.88] | 0.74 [0.58–0.84] |
| Average ICC across all ROIs (mean±SD) | 0.81 ± 0.09* | 0.77± 0.12* |
For each of the 27 ROIs of the JHU‐ICBM‐DTI‐81 white‐matter labels atlas (ordered by increasing volume size), the ICC values and the corresponding confidence interval (CI) [lower bound − upper bound] were quantified for uncorrected (DTI) and FWE‐corrected MD. The statistics of the last line is done on N = 27 ROIs comparing the uncorrected and FWE‐corrected ICC values using a two‐tailed Wilcoxon signed rank test, P < 0.05. *: P < 0.05. SD: standard deviation.
Table 4.
ICC values of axial diffusivity (AXD), with (FWE) and without (DTI) free water elimination
| White‐matter ROIs | Axial Diffusivity ICC | |
|---|---|---|
| DTI | FWE | |
| Uncinate fasciculus | 0.85 [0.75–0.91] | 0.85 [0.75–0.91] |
| Superior fronto‐occipital fasciculus | 0.87 [0.78–0.93] | 0.86 [0.76–0.92] |
| Tapetum | 0.84 [0.74–0.91] | 0.88 [0.80–0.93] |
| Fornix | 0.75 [0.60–0.85] | 0.77 [0.63–0.87] |
| Inferior cerebellar peduncle | 0.91 [0.84–0.95] | 0.89 [0.81–0.94] |
| Medial lemniscus | 0.86 [0.77–0.92] | 0.85 [0.75–0.91] |
| Superior cerebellar peduncle | 0.76 [0.61–0.86] | 0.76 [0.61–0.86] |
| Fornix (stria terminalis) | 0.69 [0.51–0.81] | 0.73 [0.57–0.84] |
| Cingulum (hippocampus) | 0.74 [0.59–0.85] | 0.80 [0.67–0.88] |
| Cingulum (cigulate gyrus) | 0.76 [0.61–0.86] | 0.73 [0.56–0.84] |
| Pontine crossing tract | 0.84 [0.73–0.91] | 0.86 [0.77–0.92] |
| Corticospinal tract | 0.88 [0.79–0.93] | 0.91 [0.85–0.95] |
| Sagittal stratum | 0.88 [0.80–0.93] | 0.93 [0.88–0.96] |
| Cerebral peduncle | 0.89 [0.82–0.94] | 0.89 [0.81–0.94] |
| Retrolenticular part internal capsule | 0.88 [0.80–0.93] | 0.93 [0.87–0.96] |
| Posterior corona radiata | 0.87 [0.78–0.92] | 0.93 [0.88–0.96] |
| Posterior thalamic radiation | 0.91 [0.84–0.95] | 0.94 [0.89–0.96] |
| Anterior limb internal capsule | 0.94 [0.89–0.96] | 0.98 [0.97–0.99] |
| Posterior limb internal capsule | 0.94 [0.89–0.96] | 0.92 [0.86–0.95] |
| Anterior corona radiata | 0.91 [0.85–0.95] | 0.91 [0.85–0.95] |
| Superior corona radiata | 0.79 [0.65–0.88] | 0.87 [0.78–0.92] |
| Superior longitudinal fasciculus | 0.72 [0.55–0.83] | 0.80 [0.67–0.88] |
| External capsule | 0.84 [0.72–0.90] | 0.91 [0.85–0.95] |
| Genu | 0.76 [0.62–0.86] | 0.85 [0.75–0.91] |
| Splenium | 0.77 [0.62–0.86] | 0.83 [0.72–0.90] |
| Middle cerebellar peduncle | 0.87 [0.79–0.93] | 0.84 [0.74–0.91] |
| Body | 0.83 [0.71–0.90] | 0.81 [0.68–0.89] |
| Average ICC across all ROIs (mean±SD) | 0.84 ± 0.07** | 0.86 ± 0.07** |
For each of the 27 ROIs of the JHU‐ICBM‐DTI‐81 white‐matter labels atlas (ordered by increasing volume size), the ICC values and the corresponding confidence interval (CI) [lower bound − upper bound] were quantified for uncorrected (DTI) and FWE‐corrected AXD. The statistics of the last line is done on N = 27 ROIs comparing the uncorrected and FWE‐corrected ICC values using a two‐tailed Wilcoxon signed rank test, P < 0.05. **: P < 0.001. SD: standard deviation.
Table 5.
ICC values of radial diffusivity (RD), with (FWE) and without (DTI) free water elimination
| White‐matter ROIs | Radial Diffusivity ICC | |
|---|---|---|
| DTI | FWE | |
| Uncinate fasciculus | 0.72 [0.55–0.83] | 0.75 [0.59–0.85] |
| Superior fronto‐occipital fasciculus | 0.74 [0.58–0.85] | 0.83 [0.72–0.90] |
| Tapetum | 0.90 [0.83–0.94] | 0.55 [0.32–0.72] |
| Fornix | 0.90 [0.83–0.94] | 0.89 [0.81–0.94] |
| Inferior cerebellar peduncle | 0.80 [0.66–0.88] | 0.78 [0.64–0.87] |
| Medial lemniscus | 0.65 [0.45–0.79] | 0.69 [0.51–0.81] |
| Superior cerebellar peduncle | 0.79 [0.65–0.88] | 0.35 [0.07–0.57] |
| Fornix (stria terminalis) | 0.88 [0.80–0.93] | 0.82 [0.70–0.90] |
| Cingulum (hippocampus) | 0.70 [0.52–0.82] | 0.80 [0.67–0.88] |
| Cingulum (cigulate gyrus) | 0.74 [0.58–0.85] | 0.90 [0.83–0.94] |
| Pontine crossing tract | 0.86 [0.77–0.92] | 0.78 [0.65–0.87] |
| Corticospinal tract | 0.81 [0.69–0.89] | 0.64 [0.44–0.78] |
| Sagittal stratum | 0.92 [0.87–0.96] | 0.87 [0.79–0.93] |
| Cerebral peduncle | 0.72 [0.55–0.83] | 0.70 [0.52–0.82] |
| Retrolenticular part internal capsule | 0.85 [0.75–0.91] | 0.85 [0.74–0.91] |
| Posterior corona radiata | 0.90 [0.83–0.94] | 0.94 [0.90–0.97] |
| Posterior thalamic radiation | 0.94 [0.89–0.96] | 1.00 [0.99–1.00] |
| Anterior limb internal capsule | 0.84 [0.73–0.91] | 0.91 [0.85–0.95] |
| Posterior limb internal capsule | 0.70 [0.52–0.82] | 0.85 [0.74–0.91] |
| Anterior corona radiata | 0.90 [0.83–0.94] | 0.93 [0.88–0.96] |
| Superior corona radiata | 0.81 [0.68–0.89] | 0.94 [0.90–0.97] |
| Superior longitudinal fasciculus | 0.94 [0.89–0.96] | 0.95 [0.92–0.97] |
| External capsule | 0.91 [0.85–0.95] | 0.92 [0.87–0.96] |
| Genu | 0.88 [0.79–0.93] | 0.89 [0.81–0.94] |
| Splenium | 0.94 [0.90–0.97] | 0.89 [0.81–0.93] |
| Middle cerebellar peduncle | 0.85 [0.75–0.91] | 0.71 [0.53–0.82] |
| Body | 0.89 [0.81–0.94] | 0.88 [0.79–0.93] |
| Average across all ROIs (mean±SD) | 0.83 ± 0.09 | 0.82 ± 0.14 |
For each of the 27 ROIs of the JHU‐ICBM‐DTI‐81 white‐matter labels atlas (ordered by increasing volume size), the ICC values and the corresponding confidence interval (CI) [lower bound − upper bound] were quantified for uncorrected (DTI) and FWE‐corrected RD. The statistics of the last line is done on N = 27 ROIs comparing the uncorrected and FWE‐corrected ICC values using a two‐tailed Wilcoxon signed rank test, P < 0.05. SD: standard deviation.
Supporting Information Tables III–VI show the within and across subject variances that were used to compute the ICC scores in each condition (DTI and FWE) and ROI. The results show that FWE can give significant reductions in within and across subject variance, thereby sometimes maintaining a comparable ICC across DTI and FWE conditions, despite a reduction of variability in FWE. With the FWE model, within‐subject variances were significantly reduced for FA (P = 0.0021), MD (P = 9.9401e‐05), AXD (P = 8.3937e‐04), and RD (P = 9.9401e‐05). Similarly, across‐subject variances were significantly reduced for MD (P = 9.9681e‐04), AXD (P = 0.0019), and RD (P = 9.9681e‐04).
Free Water Elimination: Effects on Sample Size Calculations
The practical effect of improvement in reproducibility can be described in terms of the sample size required to identify group effects. As an example we show in Figure 3 this relation in the three regions of the corpus callosum: genu, body, and splenium (complete sample size calculation for all the ROIs and scalar maps are in Supporting Information, Table I). The figure shows the percentage of subjects needed when applying FWE to have the same statistical power as DTI maps without FWE. The analysis shows that the improved reproducibility of FWE dramatically reduces sample size requirements for FA, MD, and RD maps. To achieve the same statistical power as DTI, the FWE method requires 38%, 46%, and 21% of the subjects, to identify group effects in the genu, body, and splenium of the corpus callosum, respectively. The reduction is less pronounced for AXD, where the two methods had similar reproducibility (Fig. 3).
Figure 3.
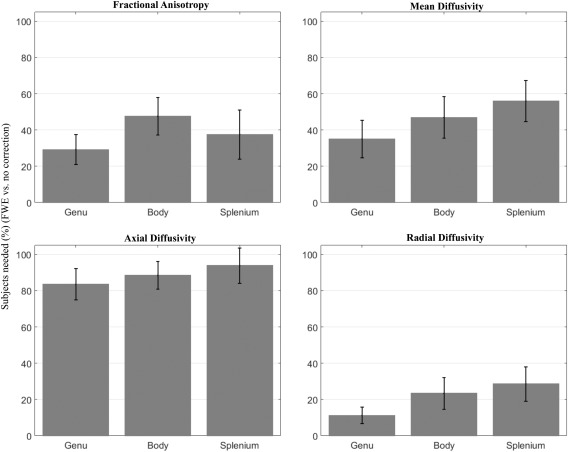
Sample size ratio needed to have the same analysis power using FWE instead of uncorrected data. Effects on diffusion metric (FA, MD, AXD, RD) from three corpus callosum ROIs (body, genu, splenium). Bars represent the percentage of subjects needed after FWE, with error bars showing standard deviations.
DISCUSSION
In this study, we evaluated and compared the test–retest reproducibility of diffusion MRI measures from multisite healthy elderly participants using two different diffusion models: standard single‐tensor DTI and bi‐tensor FWE. Our analysis is the first to provide information about the reproducibility of the FWE measures. The main finding is that FWE significantly improves test–retest reproducibility on all DTI metrics in most ROIs in the brain. The improved reproducibility suggests that FWE‐DTI measures have higher sensitivity than conventional DTI measures to detect both within and between‐group effects related to white matter changes. This improvement may explain the enhanced group difference detection reported in previous studies that used the FWE model comparing with the DTI model (Bergamino et al., 2014). At the same time the clinical specificity is improved, as the FWE measures remove partial volume effects with extracellular free water, thus revealing changes that occur to the tissue itself, such as neurodegeneration (Bergamino et al., 2015; Metzler‐Baddeley et al., 2012; Pasternak et al., 2014, 2012b). Moreover, the present results demonstrate a potential clinical relevance in terms of sample size reduction, proposing FWE as an effective processing step to decrease the number of subjects needed, comparing with DTI.
Overall, when applying FWE, we see a significant reduction in the test–retest reproducibility error of all 4 metrics studied (AXD, FA, MD, and RD) in most ROIs, and consistently across MRI sites. Of note, the reproducibility errors derived from single‐tensor DTI metrics are consistent with previous studies (Fox et al., 2011; Jovicich et al., 2014; Vollmar et al., 2010). The improved reproducibility following FWE may reflect the reduced contribution of partial volume effects, which is affected by variability in both subject positioning and extracellular components, such as ventricles size, hydration levels, and inflammation that could be changing across scanning sessions. Increased susceptibility to CSF contamination is often associated with voxels in periventricular regions and around the brain parenchyma (Concha et al., 2005; Jones and Cercignani, 2010; Metzler‐Baddeley et al., 2012). Similarly, atrophy and enlarged ventricles have been shown to consistently alter values of adjacent structures, such as the fornix and the genu of the corpus callosum (Jones and Cercignani, 2010; Metzler‐Baddeley et al., 2012; Sasson et al., 2010; Vos et al., 2011), confirming that shape and topological properties of the ROI affect partial volume artifacts (Vos et al., 2011). However, test–retest reproducibility error does not directly reflect across subject variability, which is instead included in the ICC measure.
The ICC analyses showed overall good consistency across test–retest MRI sessions relative to intra group variability. Regardless of the diffusion analyses, single tensor or FWE, the most reliable metric was FA (ICC: 0.87 ± 0.05) and least reliable was MD (ICC: 0.81 ± 0.09). The fact that FWE reduced the reproducibility error but did not change ICC is not contradictory. In fact, reproducibility error only reflects within‐subject (across session) variability, whereas ICC is sensitive to both within‐ and across‐subjects variability of diffusion estimates. For example, for some metrics (FA and RD), the ICC was not affected by FWE, because the reduced test–retest error was compensated by a reduced within group variability. These results are in good agreement with previous studies (Bergamino et al., 2015), which showed that FWE can reduce intra group variability, an effect that can help the increase of sensitivity to identify group differences.
The direct relation between the amount of partial volume effects and reproducibility is still not clear, as for example, a recent study that manipulated voxel‐sizes did not find reproducibility effects when considering standard DTI metrics (Papinutto et al., 2013). This, in part, may be explained by the complex relation between CSF‐contamination and diffusion indices, which depends on multiple sources (Metzler‐Baddeley et al., 2012). For instance, selection of b value affects CSF contamination (Metzler‐Baddeley et al., 2012), where more contamination effects are expected with lower b values (in this study b = 700 s/mm2). Alternatively, the extracellular component could be increasingly sensitive to biological noise (e.g., aging, neurodegeneration) and acquisition noises (e.g., motion, signal drops), both accounting to isotropic effects altering data variability. Based on our findings here, future studies utilizing phantoms in varying sizes may address the distinction between methodological and biological contributions to the variability and reproducibility of the diffusivity measures.
On three ROIs (tapetum, fornix, superior cerebellar peduncle), we found that FWE resulted with worse reproducibility (Table 1). This may be related to the fact that the fornix has the highest levels of CSF contamination (De Santis et al. 2014), where the uncorrected diffusion measures reflect more of the diffusivities of the ventricles, rather than those of the fornix itself. Consistent with the results of De Santis et al., 2014, we found the fornix had unusually high MD values (uncorrected MD: 2.0 ± 0.3; FWE‐corrected MD: 1.5 ± 0.4), AXD values (uncorrected AXD: 2.7 ± 0.3; FWE‐corrected AXD: 2.5 ± 0.3), and RD values (uncorrected RD: 1.6 ± 0.3; FWE‐corrected RD: 1.1 ± 0.4) (Supporting Information, Table II). The tapetum and superior cerebellar peduncle are also adjacent to the ventricles; however, their diffusivities are not as affected as the fornix. We note, that the tapetum and superior cerebellar peduncle are two of the smallest structures measured (172 ± 29 mm3, 111 ± 33 mm3, 203 ± 26 mm3, respectively), which may be related to increased susceptibility to partial volume effects (Duan et al., 2015; Metzler‐Baddeley et al., 2012; Vos et al., 2011).
Consistent with previous studies we found that test–retest reproducibility worsens with smaller ROI volume (Jovicich et al., 2014; Vollmar et al., 2010). This effect may be due to imperfections in the image registration process, mostly affecting smaller regions that are harder to register. This is in line with previous findings, where larger influence of partial volume effect on the accuracy of DTI indices were attributed to larger voxel sizes (Alexander et al., 2001). Nevertheless, most of the significant improvements in reproducibility following FWE were on smaller ROIs, reducing the bias between larger and smaller sized ROIs.
It is important to note that the FWE algorithm includes data regularization, which may reduce variability, and thus also explain the improvement in reproducibility. The current data used a single b value shell, where regularization is necessary for the model fit. To reduce the effect of regularization, the FWE algorithm continues the model fit without the regularization term following the identification of a regularized solution (Pasternak et al., 2009); however, the initial regularization may still bias the results to be less noisy, i.e., less variable. Other acquisitions that include a number of b value shells may require less spatial regularization of the data (Hoy et al., 2014; Pasternak et al., 2012a), and future studies should quantify reproducibility of multi‐shell FWE models. Such MRI acquisition protocols, however, require longer acquisition times and may not be easily available for multi‐site clinical studies. Additional limitations of the design were discussed in previous publications from the same consortium (Jovicich et al., 2013, 2014), the main of which is the relatively small sample size per site (5, scanned twice), which may not be sufficient to reliably detect site effects. Finally, as the population of the present study included healthy elderly subjects only, these results cannot be generalized to other populations.
A further limitation in our study is the choice of registration strategy in the TBSS analyses. In this study, we used the standard FSL TBSS procedure, which includes the option to automatically choose “the most representative subject” (MRS) as study‐specific target for image registration. The same registration options where kept for DTI and FWE, thus allowing us to assess the specific reproducibility effects of FWE. However, other registration approaches have been proposed aimed at optimizing and improving anatomical alignment, in some cases addressed to longitudinal studies (Bach et al., 2014, Bender et al., 2016, Engvig et al., 2012, Keihaninejad et al., 2013, 2012, Leming et al., 2016, Madhyastha et al., 2014, Schwarz et al., 2014). A comparison of these registration methods might help to study ways to further improve reproducibility. To promote the development and evaluation of such brain diffusion analysis tools, the multisite anonymous raw diffusion imaging data used in this test–retest study (48 healthy elderly subjects, each one with two repetitions) are publicly available (https://neugrid4you.eu/datasets).
CONCLUSIONS
Longitudinal diffusion MRI studies of the brain are of interest to characterize white‐matter changes related to disease progression, therapeutic treatment or the natural evolution of certain populations. One factor that limits the sensitivity of longitudinal studies is the reproducibility of measures between scans. In this multisite study of healthy elderly people, we show that the reproducibility of DTI metrics is improved when applying FWE. FWE is therefore recommended for multisite longitudinal studies, possibly increasing the power to detect white matter abnormalities. Diseases or treatments that do not affect white‐matter properties but rather the free water fractional volume may still be studied with FWE by evaluating the free water maps.
Supporting information
Supporting Information
Table supplementary 1
Table supplementary 2
Table supplementary 3
Table supplementary 4
Table supplementary 5
Table supplementary 6
ACKNOWLEDGMENTS
Pharmacog is funded by the EU‐FP7 for the Innovative Medicine Initiative. All members of the Pharmacog project deserve sincere acknowledgement for their significant efforts, but unfortunately, they are too numerous to mention. Thanks also to neuGRID platform, supported through the “neuGRID for users” project, by the European Commission's Seventh Framework Programme (FP7/2007‐2013). We also thank Klaus H. Maier‐Hein for useful discussions.
REFERENCES
- Alexander AL, Lee JE, Lazar M, Field AS (2007): Diffusion tensor imaging of the brain. Neurotherapeutics 4:316–329. [DOI] [PMC free article] [PubMed] [Google Scholar]
- Alexander AL, Hasan KM, Lazar M, Tsuruda JS, Parker DL (2001): Analysis of partial volume effects in diffusion‐tensor MRI. Magn Reson Med 45:770–480. [DOI] [PubMed] [Google Scholar]
- Assaf Y, Pasternak O (2008): Diffusion tensor imaging (DTI)‐based white matter mapping in brain research: A review. J Mol Neurosci 34:51–61. [DOI] [PubMed] [Google Scholar]
- Bach M, Laun FB, Leemans A, Tax CMW, Biessels GJ, Stieltjes B, Maier‐Hein KH (2014): Methodological considerations on tract‐based spatial statistics (TBSS). Neuroimage 100:358–369. [DOI] [PubMed] [Google Scholar]
- Baron CA, Beaulieu C (2014): Acquisition strategy to reduce cerebrospinal fluid partial volume effects for improved DTI tractography. Magn Reson Med 73:1075–1084. [DOI] [PubMed] [Google Scholar]
- Basser PJ, Jones DK (2002): Diffusion‐tensor MRI: Theory, experimental design and data analysis – a technical review. NMR in Biomed 15:456–467. [DOI] [PubMed] [Google Scholar]
- Basser PJ, Mattiello J, LeBihan D (1994): MR diffusion tensor spectroscopy and imaging. Biophys J 66:259–267. [DOI] [PMC free article] [PubMed] [Google Scholar]
- Basser PJ, Pierpaoli C (1996): Microstructural and physiological features of tissues elucidated by quantitative‐diffusion‐tensor MRI. J Magn Reson B 111:209–219. [DOI] [PubMed] [Google Scholar]
- Bender AR, Völkle MC, Raz N (2016): Differential aging of cerebral white matter in middle‐aged and older adults: A seven‐year follow‐up. Neuroimage 125:74–83. [DOI] [PMC free article] [PubMed] [Google Scholar]
- Benjamini Y, Hochberg Y (1995): Controlling the false discovery rate: A practical and powerful approach to multiple. J R Stat Soc B 57:289–300. [Google Scholar]
- Benjamini Y, Yekutieli D (2001): The control of the false discovery rate in multiple testing under depencency. Ann Statist 29:1165–1188. [Google Scholar]
- Bergamino M, Pasternak O, Farmer M, Shenton ME, Paul Hamilton J (2015): Applying a free‐water correction to diffusion imaging data uncovers stress‐related neural pathology in depression. Neuroimage Clin 10:336–342. [DOI] [PMC free article] [PubMed] [Google Scholar]
- Bonekamp D, Nagae LM, Degaonkar M, Matson M, Abdalla WM, Barker PB, Mori S, Horská A (2007): Diffusion tensor imaging in children and adolescents: Reproducibility, hemispheric, and age‐related differences. NeuroImage 34:733–742. [DOI] [PMC free article] [PubMed] [Google Scholar]
- Charlton RA, Barrick TR, McIntyre DJ, Shen Y, O'Sullivan M, Howe FA, Clark CA, Morris RG, Markus HS (2006): White matter damage on diffusion tensor imaging correlates with age‐related cognitive decline. Neurology 66:217–222. [DOI] [PubMed] [Google Scholar]
- Concha L, Gross DW, Beaulieu C (2005): Diffusion tensor tractography of the limbic system. AJNR Am J Neuroradiol 26 2267–2274. [PMC free article] [PubMed] [Google Scholar]
- Diggle PJ, Heagerty PJ, Liang KY, Zeger SL (2002): Analysis of Longitudinal Data. Oxford University Press. [Google Scholar]
- De Santis S, Drakesmith M, Bells S, Assaf Y, Jones DK (2014): Why diffusion tensor MRI does well only some of the time: Variance and covariance of white matter tissue microstructure attributes in the living human brain. Neuroimage 89:35–44. [DOI] [PMC free article] [PubMed] [Google Scholar]
- Duan F, Zhao T, He Y, Shu N (2015): Test‐retest reliability of diffusion measures in cerebral white matter: A multiband diffusion MRI study. J Magn Reson Imaging 42:1106–1116. [DOI] [PubMed] [Google Scholar]
- Engvig A, Fjell AM, Westlye LT, Moberget T, Sundseth Ø, Larsen VA, Walhovd KB (2012): Memory training impacts short‐term changes in aging white matter: A longitudinal diffusion tensor imaging study. Hum Brain Mapp 33:2390–2406. [DOI] [PMC free article] [PubMed] [Google Scholar]
- Fox RJ, Sakaie K, Lee JC, Debbins JP, Liu Y, Arnold DL, Melhem ER, Smith CH, Philips MD, Lowe M, Fisher E (2011): A validation study of multicenter diffusion tensor imaging: Reliability of fractional anisotropy and diffusivity values. AJNR Am J Neuroradiol 33:695–700. [DOI] [PMC free article] [PubMed] [Google Scholar]
- Galluzzi S, Marizzoni M, Babiloni C, Albani D, Antelmi L, Bagnoli C, Bartres‐Faz D, Cordone S, Del Percio C, Didic M, Farotti L, Fiedler U, Forloni G, Girtler N, Hensch T, Jovicich J, Leeuwis A, Marra C, Molinuevo JL, Frisoni G (2016): Clinical and biomarker profiling of prodromal Alzheimer's disease in IMI Pharmacog's WP5: A “European ADNI study”. J Intern Med 279:576–591. [DOI] [PubMed] [Google Scholar]
- Horn JV, Toga A (2009): Multi‐site neuroimaging trials. Curr Opin in Neurol 22:370–378. [DOI] [PMC free article] [PubMed] [Google Scholar]
- Hoy AR, Koay CG, Kecskemeti SR, Alexander AL (2014): Optimization of a free water elimination two‐compartment model for diffusion tensor imaging. Neuroimage 103:323–333. [DOI] [PMC free article] [PubMed] [Google Scholar]
- Jones DK, Cercignani M (2010): Twenty‐five pitfalls in the analysis of diffusion MRI data. NMR in Biomed 23:803–820. [DOI] [PubMed] [Google Scholar]
- Jovicich J, Marizzoni M, Bosch B, Bartrés‐Faz D, Arnold J, Benninghoff J, Wiltfang J, Roccatagliata L, Picco A, Nobili FM, Blin O, Bombois S, Lopes R, Bordet R, Chanoine V, Ranjeca JP, Didic M, Gros‐Dagnac H, Payoux P, Zoccatelli G, Alessandrini F, Beltramello A, Bargalló N, Ferretti A, Caulo M, Aiello M, Ragucci M, Soricelli A, Salvadori N, Tarducci R, Floridi P, Tsolaki M, Constantinidis M, Drevelegas A, Rossini PM, Marra C, Otto J, Reiss‐Zimmermann M, Hoffmann KT, Galluzzi S, Frisoni GB (2014): Multisite longitudinal reliability of tract‐based spatial statistics in diffusion tensor imaging of healthy elderly subjects. Neuroimage 101:390–403. [DOI] [PubMed] [Google Scholar]
- Jovicich J, Marizzoni M, Sala‐Llonch R, Bosch B, Bartrés‐Faz D, Arnold J, Benninghoff J, Wiltfang J, Roccatagliata L, Nobili FM, Hensch T, Tränkner A, Schönknecht P, Leroy M, Lopes R, Bordet R, Chanoine V, Ranjeva JP, Didic M, Gros‐Dagnac H, Payoux P, Zoccatelli G, Alessandrini F, Beltramello A, Bargalló N, Blin O, Frisoni GB (2013): Brain morphometry reproducibility in multi‐center 3T MRI studies: A comparison of cross‐sectional and longitudinal segmentations. Neuroimage 83:472–484. [DOI] [PubMed] [Google Scholar]
- Keihaninejad S, Zhang H, Ryan NS, Malone IB, Modat M, Cardoso J, Cash DM, Fox NC, Ourselin S (2013): An unbiased longitudinal analysis framework for tracking white matter changes using diffusion tensor imaging with application to Alzheimer's disease. Neuroimage 72:153–163. [DOI] [PubMed] [Google Scholar]
- Keihaninejad S, Ryan NS, Malone IB, Modat M, Cash D, Ridgway GR, Zhang H, Fox NC, Ourselin S (2012): The importance of group‐wise registration in tract based spatial statistics study of neurodegeneration: A simulation study in Alzheimer's disease. PLoS ONE 7:e45996. [DOI] [PMC free article] [PubMed] [Google Scholar]
- Le Bihan D, Mangin JF, Poupon C, Clark CA, Pappata S, Molko N, Chabriat H (2001): Diffusion tensor imaging: Concepts and applications. J Magn Reson Imaging 13:534–546. [DOI] [PubMed] [Google Scholar]
- Leming M, Steined R, Styner M (2016): A framework for incorporating DTI Atlas Builder registration into Tract‐Based Spatial Statistics and a simulated comparison to standard TBSS. Proc SPIE 9788. [DOI] [PMC free article] [PubMed] [Google Scholar]
- Liu Z, Wang Y, Gerig G, Gouttard S, Tao R, Fletcher T, Styner M (2010): Quality control of diffusion weighted images. Proc Soc Photo Opt Instrum Eng (SPIE) 7628: 17. [DOI] [PMC free article] [PubMed] [Google Scholar]
- Maier‐Hein KH, Westin CF, Shenton ME, Weiner MW, Raj A, Thomann P, Kikinis R, Stieltjes B, Pasternak O (2014): Widespread white matter degeneration preceding the onset of dementia. Alzheimers Dementia 11:485–493. [DOI] [PMC free article] [PubMed] [Google Scholar]
- Madhyastha T, Merillat S, Hirsiger S, Bezzola L, Liem F, Grabowski T, Jäncke L (2014): Longitudinal reliability of tract‐based spatial statistics in diffusion tensor imaging. Hum Brain 35:4544–4555. [DOI] [PMC free article] [PubMed] [Google Scholar]
- Mandl RCW, Pasternak O, Cahn W, Kubicki M, Kahn RS, Shenton ME, Hulshoff Pol HE (2015): Comparing free water imaging and magnetization transfer measurements in schizophrenia. Schizophr Res 161:126–132. [DOI] [PMC free article] [PubMed] [Google Scholar]
- McGraw KO, Wong SP (1996): Forming inferences about some intraclass correlation coefficients. Psychol Methods 1:30–46. [Google Scholar]
- Metzler‐Baddeley C, O'Sullivan MJ, Bells S, Pasternak O, Jones DK (2012): How and how not to correct for CSF‐contamination in diffusion MRI. Neuroimage 59:1394–1403. [DOI] [PubMed] [Google Scholar]
- Mori S, Wakana S, Nagae‐Poetscher LM, van Zijl PCM (2005): MRI Atlas of Human White Matter. Amsterdam: Elsevier; 284 p. [Google Scholar]
- Ofori E, Pasternak O, Planetta PJ, Burciu R, Snyder AF, Febo M, Golde TE, Okun MS, Vaillancourt DE (2015a): Increased free water in the substantia nigra of Parkinson's disease: A single‐site and multi‐site study. Neurobiol Aging 36:1097–1104. [DOI] [PMC free article] [PubMed] [Google Scholar]
- Ofori E, Pasternak O, Planetta PJ, Li H, Burciu RG, Snyder AF, Lai S, Okun MS, Vaillancourt DE (2015b): Longitudinal changes in free‐water within the substantia nigra of Parkinson's disease. Brain 138:2322–2331. [DOI] [PMC free article] [PubMed] [Google Scholar]
- O'Donnell LJ, Pasternak O (2015): Does diffusion MRI tell us anything about the white matter? An overview of methods and pitfalls. Schozophr Res 161:133–141. [DOI] [PMC free article] [PubMed] [Google Scholar]
- Papinutto ND, Maule F, Jovicich J (2013): Reproducibility and biases in high field brain diffusion MRI: An evaluation of acquisition and analysis variables. Magn Reson Med 31:827–839. [DOI] [PubMed] [Google Scholar]
- Pasternak O, Koerte IK, Bouix S, Fredman E, Sasaki T, Mayinger M, Helmer KG, Andrew MJ, Holmes JD, Forwell LA, Skopelja EN, Shenton ME, Echlin PS (2014): Hockey Concussion Education Project, Part 2. Microstructural white matter alterations in acutely concussed ice hockey players: A longitudinal free‐water MRI study. J Neurosurg 120:873. 81. [DOI] [PMC free article] [PubMed] [Google Scholar]
- Pasternak O, Shenton ME, Westin CF (2012a): Estimation of extracellular volume from regularized multi‐shell diffusion MRI. Med Image Comput Comput Assist Interv 15:305–312. [DOI] [PMC free article] [PubMed] [Google Scholar]
- Pasternak O, Sochen N, Gur Y, Intrator N, Assaf Y (2009): Free water elimination and mapping from diffusion MRI. Magn Reson Med 62:717–730. [DOI] [PubMed] [Google Scholar]
- Pasternak O, Westin CF, Bouix S, Seidman LJ, Goldstein JM, Woo TUW, Petryshen TL, Mesholam‐Gately RIM, Kikinis R, Shenton ME, Kubicki M (2012b): Excessive extracellular volume reveals a neurodegenerative pattern in schizophrenia onset. J Neurosci 32:17365–17372. [DOI] [PMC free article] [PubMed] [Google Scholar]
- Pasternak O, Westin CF, Dahlben B, Bouix S, Kubicki M (2015): The extent of diffusion MRI markers of neuroinflammation and white matter deterioration in chronic schizophrenia. Schizophr Res 161:113–118. [DOI] [PMC free article] [PubMed] [Google Scholar]
- Reuter M, Schmansky NJ, Rosas HD, Fischl B (2012): Within‐subject template esti‐ mation for unbiased longitudinal image analysis. Neuroimage 61:1402–1418. [DOI] [PMC free article] [PubMed] [Google Scholar]
- Sasson E, Doniger GM, Pasternak O, Assaf Y (2010): Structural correlates of memory performance with diffusion tensor imaging. Neuroimage 50:1231–1242. [DOI] [PubMed] [Google Scholar]
- Schwarz CG, Reid RI, Gunter JL, Senjem ML, Przybelski SA, Zuk SM, Whitwell JL, Vemuri P, Josephs KA, Kantarci K, Thompson PM, Petersen RC, Jack Jr CR, ADNI (2014): Improved DTI registration allows voxel‐based analysis that outperforms Tract‐Based Spatial Statistics. Neuroimage 94:65–78. [DOI] [PMC free article] [PubMed] [Google Scholar]
- Shrout PE, Fleiss JL (1979): Intraclass correlations: Uses in assessing rater reliability. Psychol Bull 86:420–428. [DOI] [PubMed] [Google Scholar]
- Smith SM (2002): Fast robust automated brain extraction. Hum Brain Mapp 17:143–155. [DOI] [PMC free article] [PubMed] [Google Scholar]
- Smith SM, Jenkinson M, Johansen‐Berg H, Rueckert D, Nichols TE, Mackay CE, Mackay A, Watkins KE, Ciccarelli O, Cader MZ, Matthews PM, Behrens TEJ (2006): Tract‐ based spatial statistics: Voxelwise analysis of multi‐subject diffusion data. Neuroimage 31:1487–1505. [DOI] [PubMed] [Google Scholar]
- Steventon JJ, Trueman RC, Rosser AE, Jones DK (2016): Robust MR‐based approaches to quantifying white matter structure/function alterations in Huntington's disease. J Neurosci Methods 265:2–12. [DOI] [PMC free article] [PubMed] [Google Scholar]
- Sullivan EV, Rohlfing T, Pfefferbaum A (2010): Longitudinal study of callosalmicrostructure in the normal adult aging brain using quantitative DTI fiber tracking. Dev Neuropsychol 35:233–256. [DOI] [PMC free article] [PubMed] [Google Scholar]
- Vollmar C, O'Muircheartaigh J, Barker GJ, Symms MR, Thompson P, Kumari V, Duncan JS, Richardson MP, Koepp MJ (2010): Identical, but not the same: Intra‐site and inter‐site reproducibility of fractional anisotropy measures on two 3.0T scanners. Neuroimage 51:1384–1394. [DOI] [PMC free article] [PubMed] [Google Scholar]
- Vos SB, Jones DK, Viergever MA, Leemans A (2011): Partial volume effect as a hidden covariate in DTI analyses. Neuroimage 55:1566–1576. [DOI] [PubMed] [Google Scholar]
- Zhang H, Schneider T, Wheeler‐Kingshott CA, Alexander DC (2012): NODDI: Practical in vivo neurite orientation dispersion and density imaging of the human brain. Neuroimage 61:1000–1016. [DOI] [PubMed] [Google Scholar]
Associated Data
This section collects any data citations, data availability statements, or supplementary materials included in this article.
Supplementary Materials
Supporting Information
Table supplementary 1
Table supplementary 2
Table supplementary 3
Table supplementary 4
Table supplementary 5
Table supplementary 6