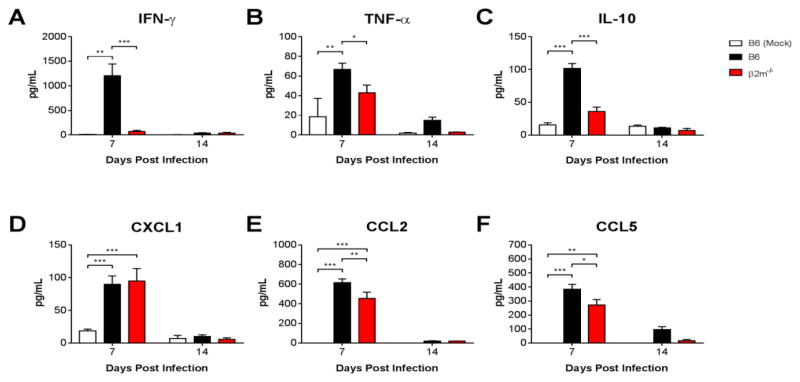
Figure 6.
Effects of CD8 T cells on MAV-1-induced cytokine production. B6 and β2m−/− mice were infected intranasally with MAV-1. B6 mice were mock-infected as controls. ELISA was used to quantify cytokine and chemokine protein concentrations in BALF obtained from infected and mock-infected mice at the indicated times. Data (n=3–12 mice per group combined from two independent experiments at each time point, except n=2 mock-infected mice at 7 dpi) are presented as means ± S.E.M. Statistical comparisons were made using two-way ANOVA followed by Bonferroni’s multiple comparison tests. ***P<0.001 **P<0.01, and *P<0.05.

