Figure 8.
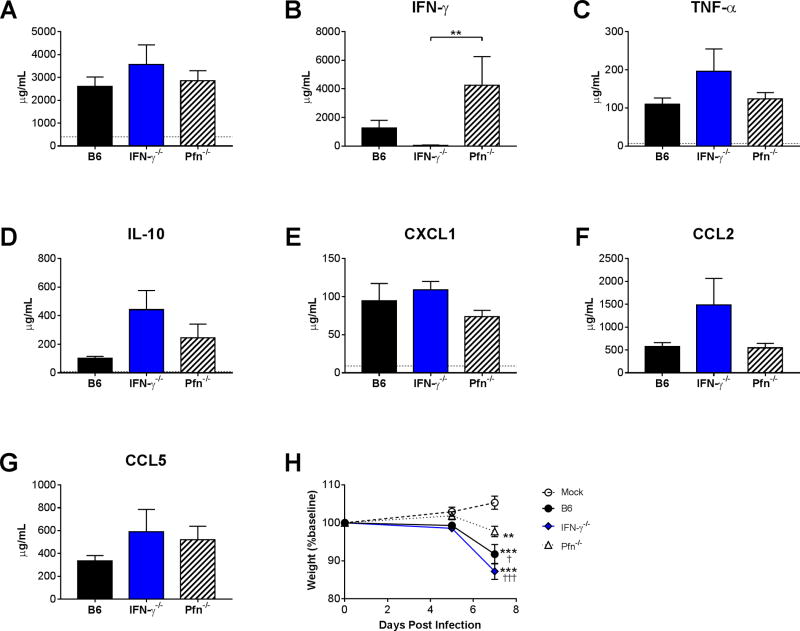
Effects of Pfn and IFN-γ on MAV-1-induced airway inflammation. B6, Pfn−/−, and IFN-γ−/− mice (n=3–5 per group combined from two independent experiments) were infected intranasally with MAV-1. B6 mice were mock-infected as controls. (A) Total protein concentration was measured in BALF. (B–G) ELISA was used to quantify BALF cytokine and chemokine protein concentrations. Horizontal dotted lines in A–G (in some cases not visible if close to the X axis) indicate background levels detected in mock-infected B6 mice. Data in B–H are presented as means ± S.E.M, and statistical comparisons were made using Kruskal-Wallis test followed by Dunn’s multiple comparisons test. ***P<0.001. (H) Body weights are expressed as the percentage of starting weight and presented as means ± S.E.M. Statistical comparisons were made using two-way ANOVA followed by Bonferroni’s multiple comparison tests. *P<0.05 and ***P<0.001 compared to mock-infected mice. †P<0.05 and †††P<0.001 compared to infected Pfn−/− mice.

