Abstract
Deep sea sediment samples of Bay of Bengal (Visakhapatnam) have been analyzed for actinomycetes as an elite source to screen for the production of bioactive metabolites. The actinomycetes strain VSM-30 has an exciting bioactivity profile and was isolated during our systemic screening of marine actinomycetes. It was identified as Streptomyces sparsus based on morphological, physiological, biochemical, and molecular approaches. Response surface methodology regression analysis was carried out to fit the experimental data of each response by the second-order polynomial. The results have proven right interaction among process variables at optimized values of incubation time at 12 days, pH at 8, temperature at 30 °C, concentrations of starch at 1%, and tryptone at 1% and the data have been adequately fitted into the second-order polynomial models. Under these conditions, the responses (zones of inhibition) of plant pathogenic fungi Aspergillus niger, Aspergillus flavus, Fusarium oxysporum, Fusarium solani, and Penicillium citrinum were also matched with experimental and predicted results. Chemotypic analysis of ethyl acetate extract of the strain was done using LC–Q-TOF–MS revealed the presence of bioactive compounds including tryptophan dehydrobutyrine diketopiperazine, maculosin, 7-o-demethyl albocycline, albocycline M-2, and 7-o-demethoxy-7-oxo albocycline in a negative ion mode. The ethyl acetate extract of actinobacterium has been subjected to gas chromatography and mass spectroscopy (GC–MS) revealed the presence of diverse compounds such as dotriacontane, tetracosane 11-decyl-, diheptyl phthalate, 1-hexadecanesulfonyl chloride, l-alanyl-l-tryptophan, phthalic acid ethyl pentyl ester, 4-trifluoroacetoxyhexadecane, and 1H-imidazole 4,5-dihydro-2,4-dimethyl. Hence, the ethyl acetate extract of Streptomyces sparsus VSM-30 may have antibacterial, antifungal, and antioxidant activities due to the presence of secondary metabolites in ethyl acetate extract. The study also supports marine sediment samples of Bay of Bengal, a promising marine ecosystem remained to be explored for new bioactive compounds.
Electronic supplementary material
The online version of this article (doi:10.1007/s13205-017-0835-1) contains supplementary material, which is available to authorized users.
Keywords: Actinobacterium, Streptomyces sparsus, Response surface methodology, Regression analysis, Bioactive metabolites
Introduction
Microbes residing in intense environments have an outstanding functionality and are luxuriant producers of several bioactive compounds, due to extreme environmental circumstances in terms of metabolic biochemistry (Shuvankar et al. 2015). Actinomycetes are stable and persistent microbes of the marine microbial groups that are well registered for their potency to produce bioactive metabolites with complex diversity and various potent biological activities. Discovery of novel actinobacterium has the potential to perform unusual metabolic pathways to produce complex chemical compounds of biotechnological significance. Due to the emergence of drug resistance pathogens, the global health is at great annoyance. Consequently, the society is at an alarming demand to discover new drugs that play a crucial role in the medicine (Subramani and Aalbersberg 2012; Shuvankar et al. 2015).
Marine actinomycetes are persistent in diverse marine ecosystems that are vital for the production of bioactive metabolites with novel structures exhibiting antibacterial, antifungal, anti-viral, cytotoxic, and antineoplastic activities. (Das et al. 2006; Jensen et al. 2007; Li et al. 2013). The exploitation of marine actinomycetes for novel secondary metabolites is in its infancy, and the invention rate of novel drugs from marine actinomycetes has currently surpassed that of their terrestrial counterparts, as obtrusive by means of the isolation of precise compounds such as salinosporamide and abyssomycin from marine actinomycetes genera Salinispora and Verrucosispora (Jensen et al. 2007; Skropeta 2008). Hence, there is a need to discover the unexplored marine ecosystems which might be a wealthy source of novel actinomycetes that are able to generate new essential bioactive compounds.
Traditional approach-based optimization includes the evaluation of one-factor-at-a-time method which is time consuming and laborious. Furthermore, the interactive effects of the variables are not analyzed and execute misleading conclusions. Hence, the optimization procedure has emerged as tiresome. It is, therefore, quiet essential to design the strategies to maximize the highest yielding quantities of bioactive metabolites. Hence, RSM is taken into consideration as a classical technique for the optimization. To establish the optimum processes with precise conditions and to reduce the cost of the production, RSM is applied as an efficient method for optimizing the process parameters (Vohra and Satyanarayana 2002).
As a part of our continuous screening for bioactive metabolites from actinobacterium resulted in the isolation of a promising stain VSM-30 with a good antimicrobial capacity was identified as Streptomyces sparsus. The strain was isolated from marine sediment samples of Bay of Bengal, Visakhapatnam, Andhra Pradesh, India, and its 16S rDNA sequence was deposited to GenBank under accession number KU507599. Cultural, morphological, and physiological properties of the strain were recorded. Hence, the objectives of the existing study include the polyphasic taxonomic characterization of the strain, effect of optimization of process parameters using RSM for maximizing the yield of the bioactive metabolites, and to evaluate the antimicrobial compounds by GC–MS analysis.
Materials and methods
Sampling
The deep sea marine sediment samples were collected at different depths of the Bay of Bengal of coastal Andhra Pradesh, India with the help of the National Institute of Ocean Technology (NIOT), Visakhapatnam. The collected sediment samples were transported to the laboratory in sterile bags and air-dried at room temperature for further isolation studies.
Isolation
The air-dried sediment sample was pre-treated with dry heat at 100 °C for 1 h (Nonomura and Ohara 1969). The treated sediment samples were suspended in sterile distilled water (1 g in 100 ml), homogenized through vortexing and 0.1 ml of serially diluted sample (10−4 dilution) was spread over the surface of starch-casein nitrate agar medium [1% soluble starch, 0.03% casein, 0.2% K2HPO4, 0.2% KNO3, 0.005% MgSO4, 0.002% CaCO3, 0.001% FeSO4, and 2% agar (pH 8) supplemented with nalidixic acid (50 µg ml−1) and secnidazole (50 µg ml−1) with 3% NaCl concentration]. The plates were incubated at 30 °C for 3 weeks. After incubation distinct, strains were selected and maintained by sub culturing on yeast extract malt extract dextrose agar (ISP-2) slants.
Polyphasic taxonomy
The morphological, cultural, physiological, and biochemical characterization of the isolate was carried out as described in the international Streptomyces project. The cultural traits of the strain were recorded on different media which include tryptone-yeast extract agar (ISP-1), YMD agar (ISP-2), oatmeal agar (ISP -3), starch inorganic salts agar (ISP-4), glycerol asparagine agar (ISP-5), peptone yeast extract iron agar (ISP-6), tyrosine agar (ISP-7), starch-casein agar, Czapek-Dox agar, and nutrient agar media (Shirling and Gottlieb 1966). The micromorphology of the strain was examined under scanning electron microscopy (model JOEL-JSM 5600) (Bozzola and Russell 1999). The utilization of carbohydrates by the strain was carried out in minimal medium containing different carbon sources at 1% concentration according to the method described by (Isik et al. 1999). Biochemical tests which include IMVIC, H2S production (Cowan 1974), nitrate reduction (Gordon 1966), urease, catalase, coagulase (Jones 1949), starch, and gelatine hydrolysis (Waksman 1961) were also evaluated. Physiological characterization such as the effect of pH (5–9), temperature (20–60 °C), and salinity was analyzed. NaCl tolerance of the strain was determined through the technique suggested by (Ellaiah et al. 2005).
Molecular identification of the strain through 16S rRNA sequencing
The genomic DNA used for the PCR was prepared from the single colonies grown on the yeast extract malt extract dextrose agar (ISP-2) medium for 3 days. The whole genomic DNA extracted from the potent strain (VSM-30) was isolated employing the DNA purification Kit (Pure Fast® Bacterial Genomic DNA purification kit, Helini Bio molecules, India) consistent with the manufacturer protocol. The 16S rRNA gene fragment was amplified using universal primers (forward primer—5′-GCCTAACACATGC-AAGTCGA-3′ and reverse primer—5′-CGTATTACCGCGGCTGCTGG-5′) (Nilsson and Strom 2002). The amplified fragment was analyzed using 1% agarose gel and the fragment was purified (Helini Pure Fast PCR clean up kit, Helini Bio molecules, India) according to the manufacturer instructions. The bands were analyzed under UV light and documented using Gel Doc. The direct sequencing of PCR products was performed by dideoxy chain termination approach using 3100-Avant Genetic Analyzer (Applied Bio systems, USA). The obtained sequences were analyzed for homology using BLASTN (Entrez Nucleotide database). The 16S rRNA gene (rDNA) sequence of the strain VSM-30 was registered in the GenBank database with the accession number.
Media optimization
RSM is an effective statistical tool for optimization of multiple variables to determine the optimum conditions of the variables with minimum number of runs. RSM helps in elimination of the traditional single parameter testing approaches that observe the effect of one factor at a time on the variable. In addition to lag in time for experimenting, these traditional strategies are unable to draw conclusion between the interactive effects of the variables on the responses (Ferreira et al. 2007). The central composite design is one of the tools in RSM and is used in this study, because it enables the determination of optimum parameters with a minimal number of experiments compared to other designs (Maelle et al. 2017).
RSM design
The central composite design (CCD) of RSM was implemented to optimize the process conditions and the effect of the interaction among the process variables for the yield of the bioactive metabolite production by VSM-30. The range and coded level of the process variables, time of incubation (Days) (A), pH (B), temperature (C), starch (D), and tryptone (E) studied are presented in Table 1.
Table 1.
Experimental range and level coded of independent variables
| Factors | Symbols | Actual levels of coded factors | ||
|---|---|---|---|---|
| −1 (Low) | 0 (Middle) | +1 (High) | ||
| Time of incubation (days) | A | 11 | 12 | 13 |
| pH | B | 7 | 8 | 9 |
| Temperature (°C) | C | 25 | 30 | 35 |
| Conc of starch (% w/v) | D | 0.5 | 1.0 | 1.5 |
| Conc of tryptone (% w/v) | E | 0.5 | 1 | 1.5 |
A total of 50 experiments were calculated using following equation which have 25 full factorial CCD for five variables comprising 32 factorial points, 10 axial points, and 8 replicates:
| 1 |
where N is total number of experimental runs to be carried out, n is the number of variables (factors), and n c is the number of replicates at centre points. The complete design matrix of CCD and the experimental results are given in Supplementary Table 1.
All the experiments were executed in triplicate and effect of the bioactive metabolite (measured as zone of inhibition in mm) towards the responses was taken as the dependent variable or response (Y). The second-order polynomial coefficients were calculated and analyzed using the ‘Design Expert’ software (Version 6.0, Stat-Ease Inc., Minneapolis, USA) statistical package. The general form of the second degree polynomial equation is Eq. (1):
| 2 |
where Y is the anticipated response, β 0 is the intercept coefficient, β i is the linear coefficient, β ij is the interaction coefficients, β ii is the quadratic coefficients, and X i and X j are the coded values of the five additive variables under study (Katrin et al. 2012).
ANOVA variance analysis
ANOVA variance was used to study the statistical parameters for optimization of culture conditions and to determine the significance of the variables for the production of the bioactive compound by VSM 30 and its impact against the five responses (Gaddafi et al. 2017). The significance of the model was evaluated by Fisher’s satirical test (F test), where the F value is defined as the ratio of the mean square of regression (MRR) to the error (MRe) (Hamid et al. 2015). The statistical significance was supported by an F test and their corresponding P value at the 5% significance level. The goodness of the model fit was determined by the coefficient of determination (R 2). The values were considered to be significant when the p value <0.05. The quality of the fit of the polynomial model was expressed by value of correlation coefficient adjusted (R 2). The main indicators for determining the significance and the adequacy of the model applied include CV and adequate precision.
3D plots
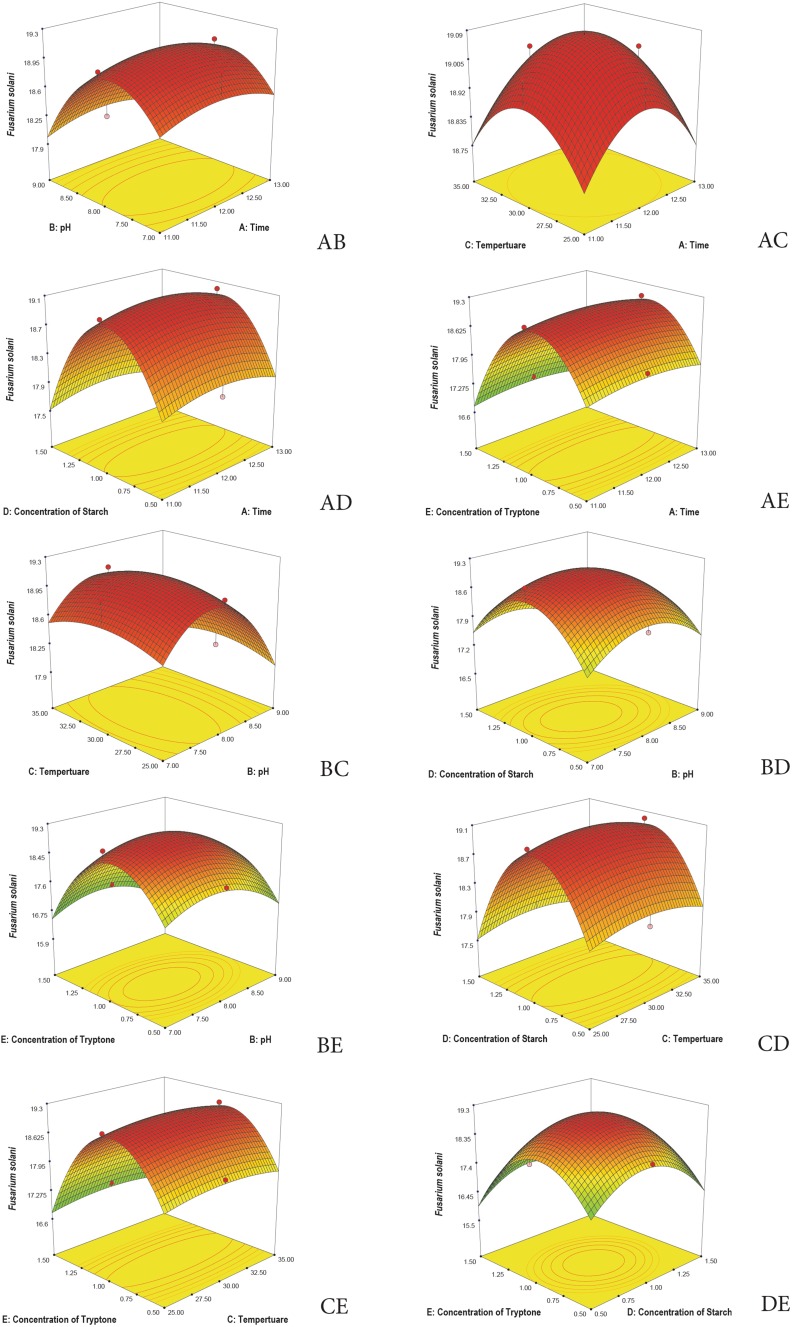
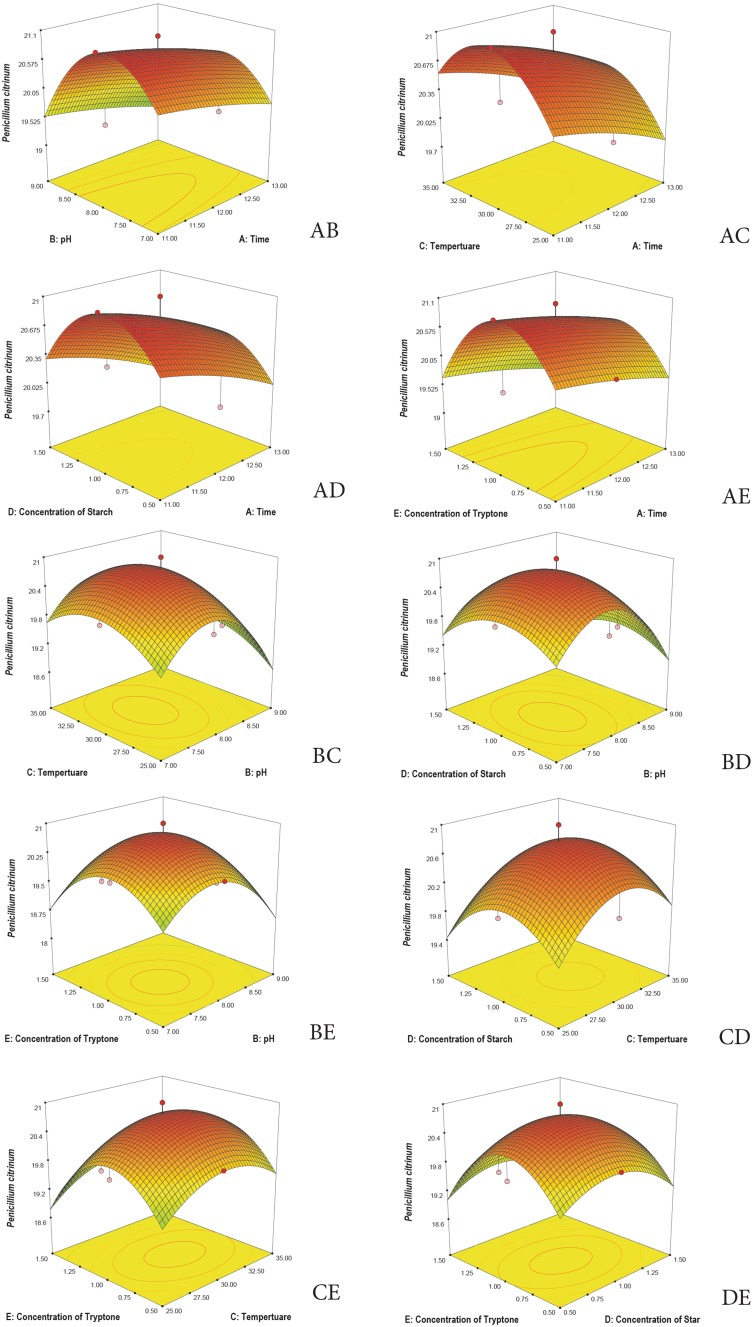
The data fitted in the polynomial equation were expressed as 3D plots to visualize the relationship between the experimental ranges of each factor (independent variables) and the responses (dependent Variables) employed in the design. The response surface and the counter plots obtained from the model are used for analysis of various interactive effects among the independent variables while keeping the value of the third variable constant. Such 3D plots give accurate geometrical representation and offer useful data about the system behavior (Bipasha et al. 2015).
Fermentation and extraction
A loopful of properly sporulated culture of S. sparsus VSM-30 was inoculated into 100 ml of seed medium composed of yeast extract 0.4%, malt extract 1%, dextrose 0.4% (YMD broth), and incubated on a rotary shaker at 30 °C for 48 h. Seed culture at the rate of 10% was transferred to the optimized production medium consisting of 1% starch, 1% tryptone, and 3% NaCl with pH 8. The inoculated flasks were incubated on rotary shaker at 30 °C and incubated for 12 days. The fermented broth collected at the end of 12 days was centrifuged and the culture filtrate obtained was extracted with ethyl acetate. The solvent extracts were pooled and concentrated in vacuum to dryness and the resultant crude extract was subjected to Gas chromatography and mass spectroscopy.
ESI-LC–MS/MS analysis
LC-ESI–MS/MS analysis of SSEE (Streptomyces sparsus ethyl acetate extract) was carried out on 6520 Accurate Q-TOF (Agilent Santa Clara, CA) mass spectrometer coupled to HPLC equipped with UV–VIS detector. The column was Zorbax-Eclipse XDB-C 18, 4.6 × 50 mm, 1.8 µ; other conditions: (A) acetic acid (0.1% v/v) and (B) acetonitrile; gradient (in solvent B): (i) 20–55% from 0 to 15 min, (ii) 55–90% from 15–20 min, (iii) isocratic 90% from 20 to 23 min, (iv) 90–20% from 23 to 26 min, and (v) isocratic 20% from 26 to 35 min; flow rate: 0.2 ml/min; injection volume 2 µl; ESI parameters: both positive and negative ion mode; mass range 100–1700 m/z; spray voltage 4 kV; gas temperature 325 °C; gas flow 8 l/min; and nebulizer 35 psi.
Identification of antimicrobial metabolites by GC–MS
The identification of the chemical compounds present in the crude ethyl acetate extract (EAE) was accomplished with the aid of GC–MS. Analysis was carried out on Agilent GC–MS machine (GC: 5890 series II; MSD 5972). The fused silica HP-5 capillary column (30 m × 0.25 mm, ID, film thickness of 0.25 µm) was directly coupled to the MS. The carrier gas was helium with a flow rate of 1.2 ml min−1. Oven temperature was programmed (50 °C for 1 min, then 50–280 °C at a rate of 5 °C/min) and subsequently, held isothermally for 20 min. The temperature of the injector port was maintained at 250 °C and that of detector at 280 °C (Boussaada et al. 2008). The peaks of the obtained compounds in the gas chromatography were subjected to mass-spectral analysis. The spectra have been analyzed from the library data, NIST-MS search (version 2.0) (included with NIST’02 mass-spectral library, Agilent p/n G1033 A).
Results and discussion
The prevailing study was designed to analyze the deep sea marine sediment samples of the Bay of Bengal (Visakhapatnam) of coastal Andhra Pradesh, India for novel actinomycetes and their antimicrobial properties. Our continuous search for novel antimicrobial metabolites led to the isolation of 57 morphologically distinct isolates of actinobacterial population (VSM-1 to VSM-57) on different media by employing soil dilution plate technique. Screening of the isolates for potent actinobacterium brought about the isolation of morphologically distinct isolate VSM-30 on starch-casein nitrate agar medium. The polyphasic taxonomy of the strain was reported.
The strain VSM-30 exhibited typical morphological characteristics of the genus Streptomyces (Hensyl 1994). The active strain was gram positive, non-acid fast, non-motile actinobacterium. The cultural characteristics of the strain are recorded in Table 2. The strain exhibited good growth on ISP-2, ISP-4, and starch-casein agar medium. Growth was moderate on ISP-1, ISP-3, ISP-5, ISP-6, ISP-7, and nutrient agar media, while it was poor on Czapek-Dox agar medium. The color of aerial mycelium varied from dark grey to greyish white, while the substrate mycelium varied from pale yellow to light brown. No pigment was observed on any of the tested medium including melanin pigmentation on ISP-7. Production of melanin pigment or inhibition of the same by the strains on ISP-7 medium could also be taken as a criterion for species identification (Baumann et al. 1976). Micromorphology of the strain was examined through scanning electron microscopy. The culture showed extensively branched substrate mycelium and flexuous spore chains were born on the aerial hyphae (Fig. 1). As its sporophore morphology is of flexuous type, the strain may be placed in the rectiflexibilis group of the family Streptomycetaceae and the genus Streptomyces (Pridham et al. 1958).
Table 2.
Cultural characteristics of the strain on various ISP and non-ISP media
| S. no | Medium | Growth | Aerial mycelium | Substrate mycelium | Pigmentation |
|---|---|---|---|---|---|
| 1 | Tryptone-yeast extract agar (ISP-1) | Moderate | Dark grey | Light grey | Nil |
| 2 | Yeast extract malt extract dextrose agar (ISP-2) | Good | Greyish white | Yellow | Nil |
| 3 | Oatmeal agar (ISP-3) | Moderate | Light grey | Greyish white | Nil |
| 4 | Inorganic salts starch agar (ISP-4) | Good | Grey | Pale yellow | Nil |
| 5 | Glycerol asparagine agar (ISP-5) | Moderate | Pale grey | Pale yellow | Nil |
| 6 | Peptone yeast extract iron agar (ISP-6) | Moderate | Grey | Greyish white | Nil |
| 7 | Tyrosine agar (ISP-7) | Moderate | Pale grey | Creamy white | Nil |
| 8 | Starch-casein agar | Good | Grey | Light brown | Nil |
| 9 | Nutrient agar | Moderate | Greyish white | Pale yellow | Nil |
| 10 | Czapek-Dox agar | Poor | – | – | – |
Fig. 1.
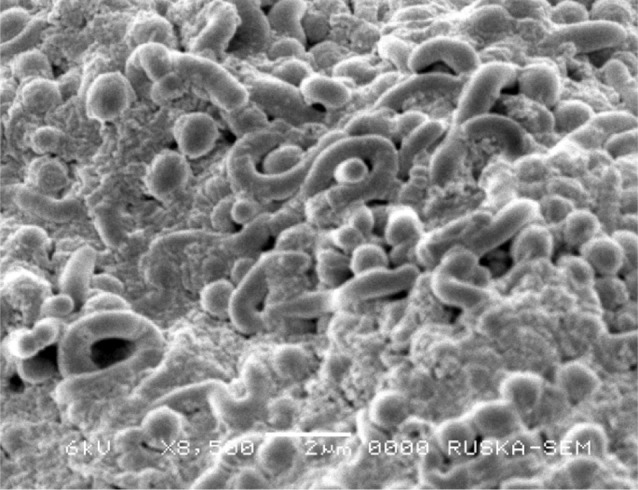
Scanning electron micrograph of the marine actinobacterium VSM-30 grown on ISP-2 medium
Physiological and biochemical characteristics of the strain VSM-30 are recorded in Table 3. Kampfer et al. (1991) recommended that physiological assessments are indispensible tools for classification and identification of actinomycetes. Growth of the strain occurred in the pH range of 6–9 with optimum growth at pH 7.5. The temperature range for growth was 25–40 °C with the optimum growth at 30 °C. Tolerance of the strain to NaCl concentration additionally serves as an important character for species identification. VSM-30 exhibited salt tolerance up to 9% with optimum growth at 3% NaCl; therefore, the strain may be located in intermediate salt tolerance group as advised by Tresner et al. (1968).
Table 3.
Morphological, physiological, and biochemical characteristics of strain VSM-30
| S. no | Morphological characters | Response |
|---|---|---|
| 1 | Cell shape | Mycelial |
| 2 | Sporophore morphology | Flexuous |
| 3 | Color of aerial mycelium (ISP-2) | Greyish white |
| 4 | Color of substrate mycelium (ISP-2) | Pale yellow |
| Physiological characters | ||
| 5 | Gram reaction | + |
| 6 | Acid-fast reaction | − |
| 7 | Production of melanin pigment | + |
| 8 | Range of temperature for growth | 25–40 °C |
| 9 | Optimum temperature for growth | 30 °C |
| 10 | Range of pH for growth | 6–9 |
| 11 | Optimum pH for growth | 7.5 |
| 12 | NaCl tolerance | 9% |
| Biochemical characters | ||
| 13 | Catalase production | + |
| 14 | Nitrate reduction | − |
| 15 | Hydrogen sulphide production | + |
| 16 | Starch hydrolysis | + |
| 17 | Gelatin liquefaction | − |
| 18 | Methyl red test | − |
| 19 | Vogues–Proskauer test | − |
| 20 | Indole production | − |
| 21 | Citrate utilization | + |
| 22 | Casein hydrolysis | + |
| 23 | Coagulase | + |
+, positive; −, negative
VSM-30 had the ability to hydrolyze starch, casein and exhibited positive response to citrate utilization, coagulase test, catalase production, and H2S production and, however, negative for indole, methyl red, Vogues–Proskauer tests, gelatin liquefaction, and nitrate reduction. The utilization of starch and casein confirmed that the isolate produced the extracellular enzymes amylase and protease to metabolize the polymeric components of nutrient mixture to monomeric form for growth. Positive response towards catalase enzyme revealed that the isolate can withstand the stress condition generated by reactive oxygen species (Table 3).
The utilization of diverse carbon sources by the strain indicated its wide pattern of carbon assimilation ability (Table 4). The strain efficiently utilized the carbon sources such as glucose, sucrose, fructose, xylose, raffinose, and inositol but not utilized mannose and rhamnose. Carbohydrate utilization plays a distinguished role in the taxonomic characterization of actinomycetes strains (Pridham and Gottlieb 1948).
Table 4.
Utilization of the carbon sources by the strain VSM-30
| S. no | Carbon source | Response |
|---|---|---|
| 1 | Glucose | + |
| 2 | Sucrose | + |
| 3 | Fructose | + |
| 4 | Arabinose | + |
| 5 | Mannose | − |
| 6 | Xylose | + |
| 7 | Rhamnose | − |
| 8 | Raffinose | + |
| 9 | Inositol | + |
+, positive; −, negative
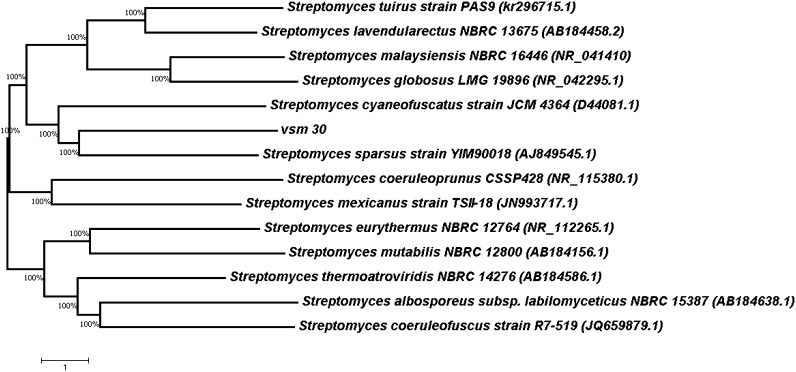
Gene sequence of 16S rRNA of VSM-30 was blasted against nucleotide database of the NCBI. The library search reported matching strains and the sequences had been aligned with the set of published sequence on the basis of the conserved primary sequence and additionally with the aid of nucleotide blast similarity search evaluation. The 16S rDNA gene sequence of the isolate VSM-30 showed a close relation with Streptomyces sparsus (Fig. 2). The rDNA sequence was deposited in the GenBank database of NCBI with an accession number KU507599.
Fig. 2.
Evolutionary relationships of taxa
The evolutionary history was inferred using the Neighbor-Joining method. The optimal tree with the sum of branch length =60.60888126 is shown. The evolutionary distances were computed using the maximum composite likelihood method and are in the units of the number of base substitutions per site. The analysis involved 14 nucleotide sequences. Codon positions included were 1st + 2nd + 3rd + Noncoding. All positions containing gaps and missing data were eliminated. There were a total of 885 positions in the final data set. The scale bar indicates a 1% sequence divergence. Evolutionary analyses were conducted in MEGA7.
Media optimization by RSM design
Impact of different variables which includes incubation time, pH, temperature, concentration of starch and tryptone on bioactive metabolite production by VSM 30, and its antimicrobial effect (measured as zone of inhibition in mm) against the five responses (Aspergillus niger, Aspergillus flavus, Fusarium oxysporum, Fusarium solani, and Penicillium citrinum) was carried out. In addition to the effect of the bioactive metabolite, the interactive effects of the process variables on the bioactive metabolite are also studied.
Application of RSM for optimization of bioactive metabolite production by VSM 30
Optimization of the process depends on the different parameters affecting the desired out put. Optimization of the process through traditional methods with one factor at a time (O-F-A-T) is time consuming and costly. Furthermore, the synergistic effect of various parameters cannot be determined through this lengthy procedure. Subsequently, the statistical design (RSM) is implemented to establish the relationship between variables and the responses and to design the models with minimum number of experiments (Adya and Susmita 2017). Response surface methodology has proved to be powerful and beneficial for the optimization of the target metabolites production (Deepak et al. 2008; Souagui et al. 2015).
CCD of RSM was employed to study the interactive effects of the significant variables and to determine the optimum values for the production of bioactive compound by VSM 30 considering the fact that CCD has been very decisive statistical tool in optimization (Gámiz-Gracia et al. 2003). Supplementary Table 1 illustrates the experimental conditions of the variables and the corresponding responses in conjunction with both the predicted and the experimental values against the five responses (Aspergillus niger, Aspergillus flavus, Fusarium oxysporum, Fusarium solani, and Penicillium citrinum) (effect of the bioactive metabolite is measured as zone of inhibition and represented in mm). Randomized 50 Experiments were carried out according to five factors and three-level factorial experiment designs with eight replications of the central point and ten axial points and 32 factorial points for bioactive metabolite production by VSM 30. The bioactive metabolite produced by VSM 30 under the optimized designed experiments and its affect against the five responses (Zone of inhibition measured in mm) was experimentally found to be 21 mm for Aspergillus niger, 19 mm for Aspergillus flavus, 18 mm for Fusarium oxysporum, 19 mm for Fusarium solani, and 21 mm for Penicillium citrinum. The optimized conditions of the independent variables were time of incubation (12 days), pH (8), temperature (30 °C), starch concentration (1%), and tryptone concentration (1%).
Coefficients of the second degree polynomial model evolved for the production of bioactive compounds by VSM 30. Equation 2 was evaluated and tested for their significance through linear regression analysis using Expert-Design version 6. The non-significant coefficients from second degree polynomial equation were eliminated on the basis of the obtained p value (>0.05). The final yield of the bioactive compound by VSM 30 after eliminating the non-significant terms is as follows and javascript: void(0), represented Eqs. 3, 4, 5, 6, and 7 confirmed that the zone of inhibition by the bioactive metabolite produced by VSM-30 was empirical functions of variables evaluated. Regression coefficient was determined with the least square method to develop the second-order quadratic polynomial models (Halil and Ilkay 2016).
Response 1 (Aspergillus niger)
| 3 |
Response 2 (Aspergillus flavus)
| 4 |
Response 3 (Fusarium oxysporum)
| 5 |
Response 4 (Fusarium solani)
| 6 |
Response 5 (Penicillium citrinum)
| 7 |
where Y1, Y2, Y3, Y4, and Y5 are responses (Aspergillus niger, Aspergillus flavus, Fusarium oxysporum, Fusarium solani, and Penicillium citrinum), whose growth is inhibited by the bioactive metabolite produced by VSM 30 (measured as zone of inhibition in mm) and A, B, C, D, and E are the coded forms of time of incubation, pH, temperature, concentration of starch, and concentration of tryptone, respectively (Amita et al. 2008).
Statistical ANOVA variance of the model
ANOVA variance of the model was analyzed to determine the significance of the fitness of the quadratic model in addition to the significance of the independent process variables and the interactive effects of process variables in opposition to the five responses (Aspergillus niger, Aspergillus flavus, Fusarium oxysporum, Fusarium solani, and Penicillium citrinum), whose growth is inhibited measured as zone of inhibition and represented in mm (Table 5).
Table 5.
Analysis of ANOVA variance to test the adequacy of the model
| Statistics | Response | ||||
|---|---|---|---|---|---|
| Aspergillus niger | Aspergillus flavus | Fusarium oxysporum | Fusarium solani | Penicillium citrinum | |
| R 2 | 0.9775 | 0.9746 | 0.9874 | 0.9977 | 0.9682 |
| Adj-R 2 | 0.9620 | 0.9571 | 0.9787 | 0.9961 | 0.9462 |
| Pred-R 2 | 0.9211 | 0.9141 | 0.9578 | 0.9924 | 0.8880 |
| Adequate precession | 21.402 | 22.505 | 30.242 | 70.376 | 20.054 |
| CV (%) | 1.63 | 1.27 | 1.28 | 0.68 | 1.93 |
ANOVA, primarily based for the production of bioactive metabolite by VSM 30, revealed that the model for all the five responses had satisfactory levels of coefficient determination (R 2). Goodness fit of the version of the regression analysis is measured using coefficient determination (R 2) which implies that the estimated model fits the experimental data satisfactorily. The statistical regression analysis shows that coefficient determination R 2 is illustrated in Table 5. The R 2 values of the five responses display that the model is significantly explaining 95% of the variability in the production of the bioactive compound and its effect against the five responses. R 2 scale range for 0.1 and the value close to 1.0 signifies the fitness of the model (Yatisha et al. 2016). Adjusted R 2 and the predicted R 2 of all the five responses in the model were provided in Table 5, which indicate that the model is good. The values of R 2 and adjusted R 2 of the model evolved for the production of bioactive metabolites have been better than 0.8; as a consequence, there is a close agreement between the experimental and predicted results (Myers et al. 2009).
Coefficient variation (CV) of the model reveals better precision, flexibility, and reliability of the experiment (Majd et al. 2014). The higher the value of CV the lower is the reliability of the experiment. The CV of all the five responses is shown in Table 5 and found to be very low (Saranya and Sekaran 2016). Adequate precision ratios of the models for bioactive metabolite production by VSM 30 are given in the Table 5. Adequate precision measures the signal-to-noise ratio and the value greater than 4 indicates that the signal is adequate and the model can be used to navigate the design space (Chongqing et al. 2016). Non-significant lack of fit indicates that the model was a good fit.
The ANOVA p values are the key factors to estimate the coefficients of the model and to determine the significance of variables and to examine the interactive strength among each variable parameter. The p value of the model was less than <0.0001. The model with the p values less than 0.05 was considered statistically significant which implies that the model was acceptable for this experiment (Qixuan et al. 2017). As per the p value of the study (value less than 0.05), the variables which are significant for all the five responses are represented in Table 6.
Table 6.
Sequential model fitting for all the responses (in terms of inhibition zone from the bioactive metabolite production)
| Model parameter | Aspergillus niger | Aspergillus flavus | Fusarium oxysporum | Fusarium solani | Penicillium citrinum |
|---|---|---|---|---|---|
| Sequential model sum of squares—Quadratic vs 2FI (suggested) | |||||
| Sum of squares | 105.50 | 40.79 | 85.08 | 139.36 | 102.04 |
| d.f. | 5 | 5 | 5 | 5 | 5 |
| Mean square | 21.10 | 8.16 | 17.2 | 27.87 | 20.41 |
| F value | 222.22 | 161.66 | 397.72 | 2248.73 | 159.68 |
| p value (Prob > F) | <0.0001 | <0.0001 | <0.0001 | <0.0001 | <0.0001 |
| Lack of fit tests—Quadratic (suggested) | |||||
| Sum of squares | 2.75 | 1.46 | 1.24 | 0.36 | 3.71 |
| d.f. | 22 | 22 | 22 | 22 | 22 |
| Mean square | 0.13 | 0.067 | 0.056 | 0.016 | 0.17 |
| F value | – | – | – | – | – |
| p value (Prob > F) | – | – | – | – | – |
| Model summary statistics—Quadratic (suggested) | |||||
d.f. degrees of freedom
ANOVA variance analysis reveals that the significant factors affecting the inhibition of growth of the pathogenic microorganisms (five responses) by the bioactive compounds produced by VSM 30 are incubation time (days), pH, temperature, concentration of starch, and tryptone.
3D plots to study the interactions effect on responses
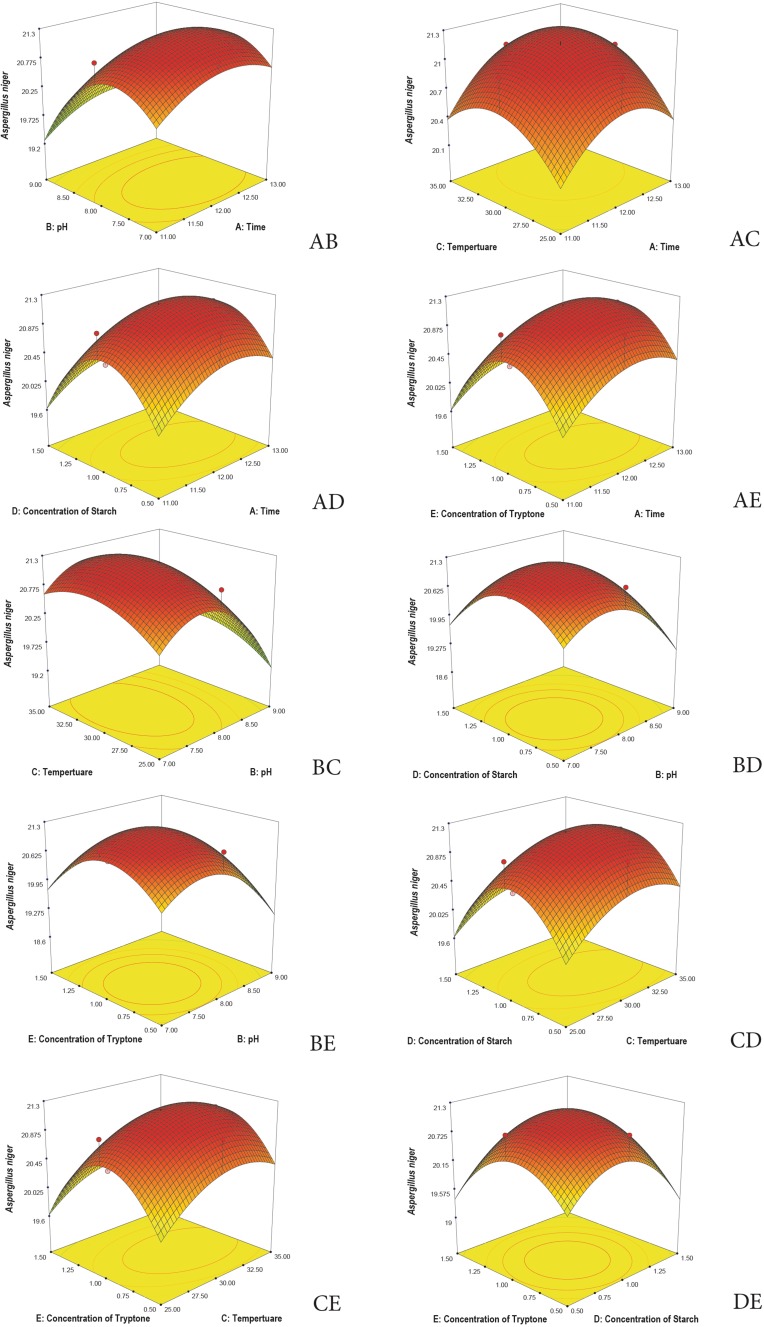
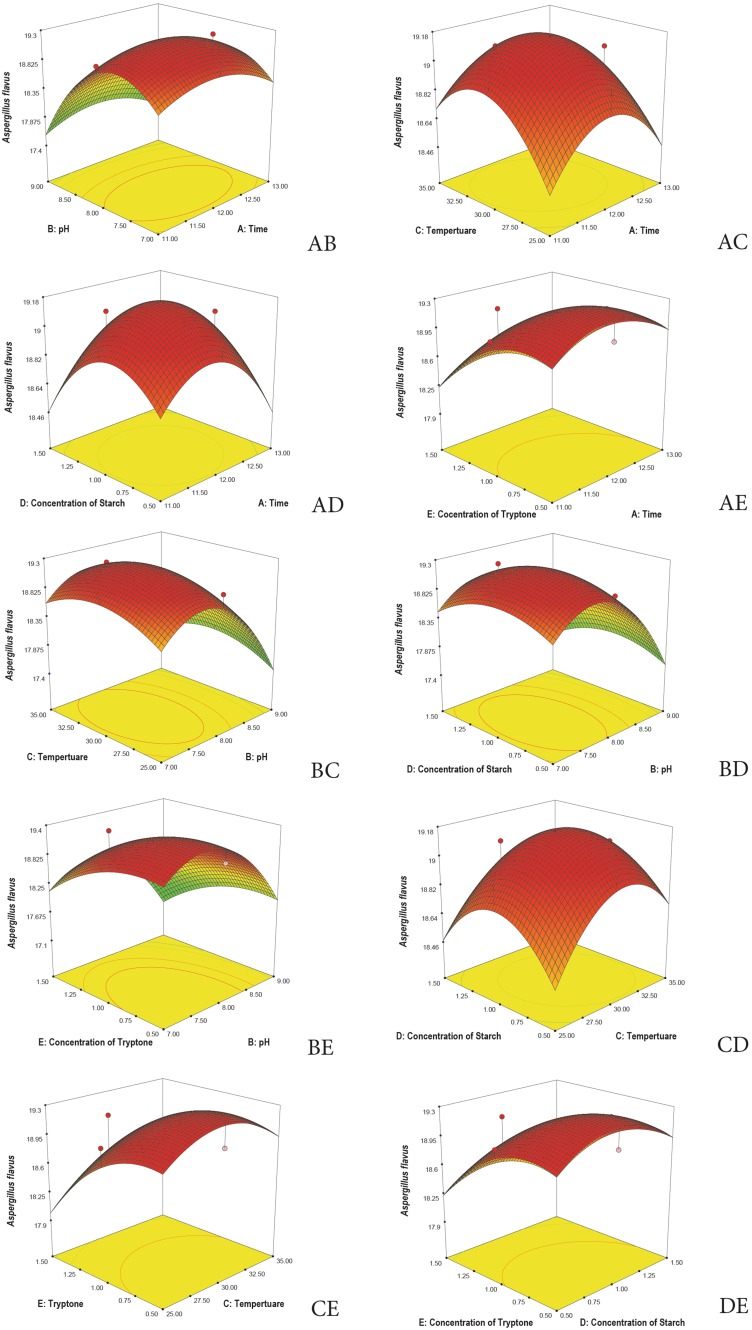
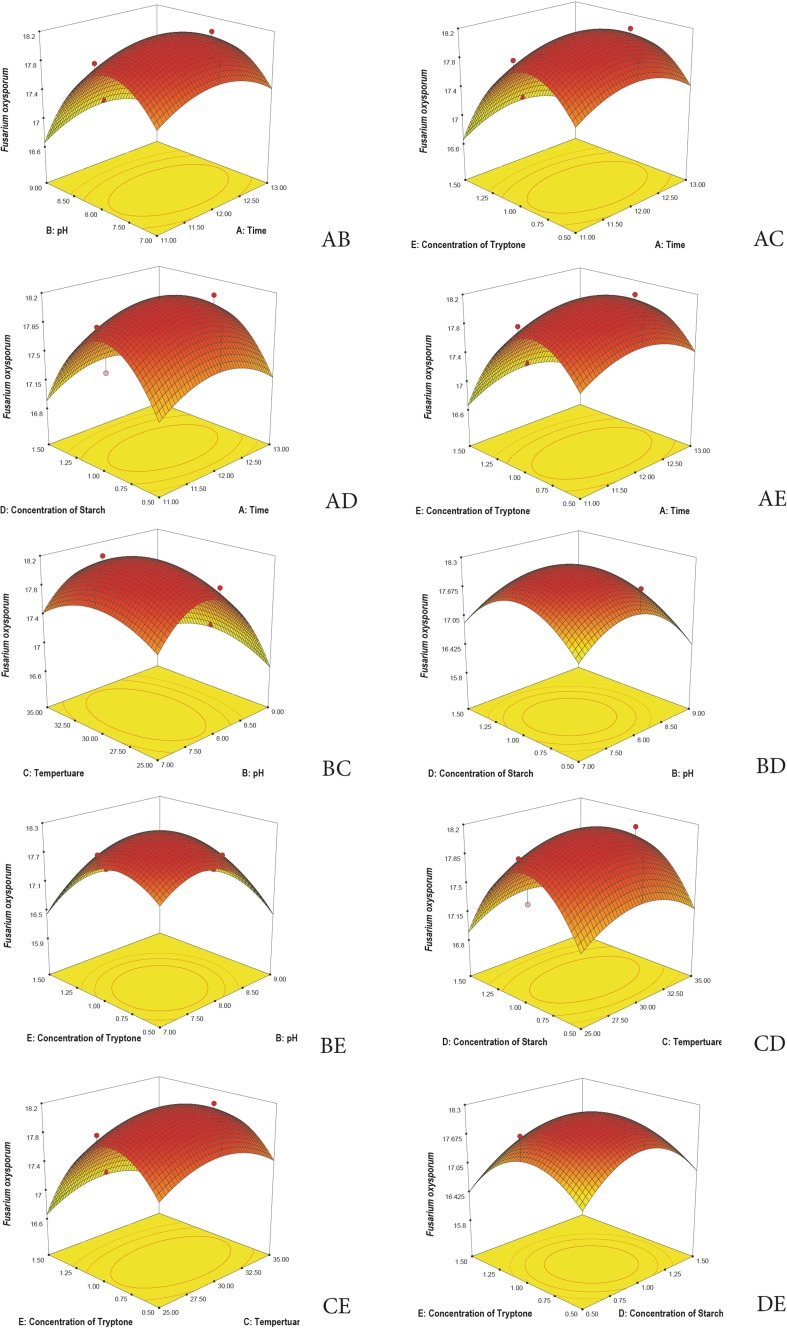
3D plots are generated to understand the interaction among the five variables and to determine the optimize level of each variable for maximum response. Response surface 3D plots show the interactions of the two independent variables, where the other variable is fixed at zero (Khaoula et al. 2016). Figures 3, 4, 5, 6, and 7 represent the reference surface 3D plots generated for the production of bioactive compounds by VSM 30 and its impact against the five responses. The values obtained from the 3D plots were found to be almost similar with optimum values.
Fig. 3.
3D plots showing the interactive effects of selective variables on the production of the bioactive metabolites by Streptomyces sparsus VSM-30 and its effect against the response Aspergillus niger (zone of inhibition in mm)
Fig. 4.
3D plots showing the interactive effects of selective variables on the production of the bioactive metabolites by Streptomyces sparsus VSM-30 and its effect against the response Aspergillus flavus (zone of inhibition in mm)
Fig. 5.
3D plots showing the interactive effects of selective variables on the production of the bioactive metabolites by Streptomyces sparsus VSM-30 and its effect against the response, Fusarium oxysporum (zone of inhibition in mm)
Fig. 6.
3D plots showing the interactive effects of selective variables on the production of the bioactive metabolites by Streptomyces sparsus VSM-30 and its effect against the response Fusarium solani (zone of inhibition in mm)
Fig. 7.
3D plots showing the interactive effects of selective variables on the production of the bioactive metabolites by Streptomyces sparsus VSM-30 and its effect against the response Penicillium citrinum (zone of inhibition in mm)
ESI-LC–MS/MS analysis
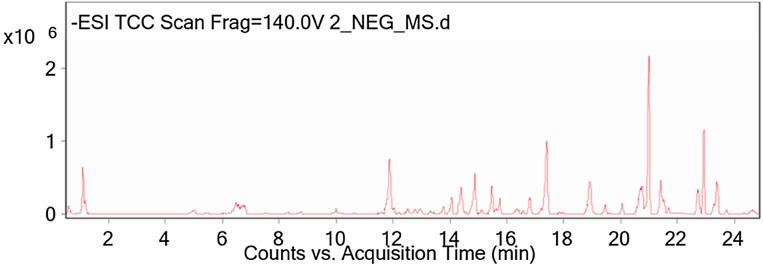
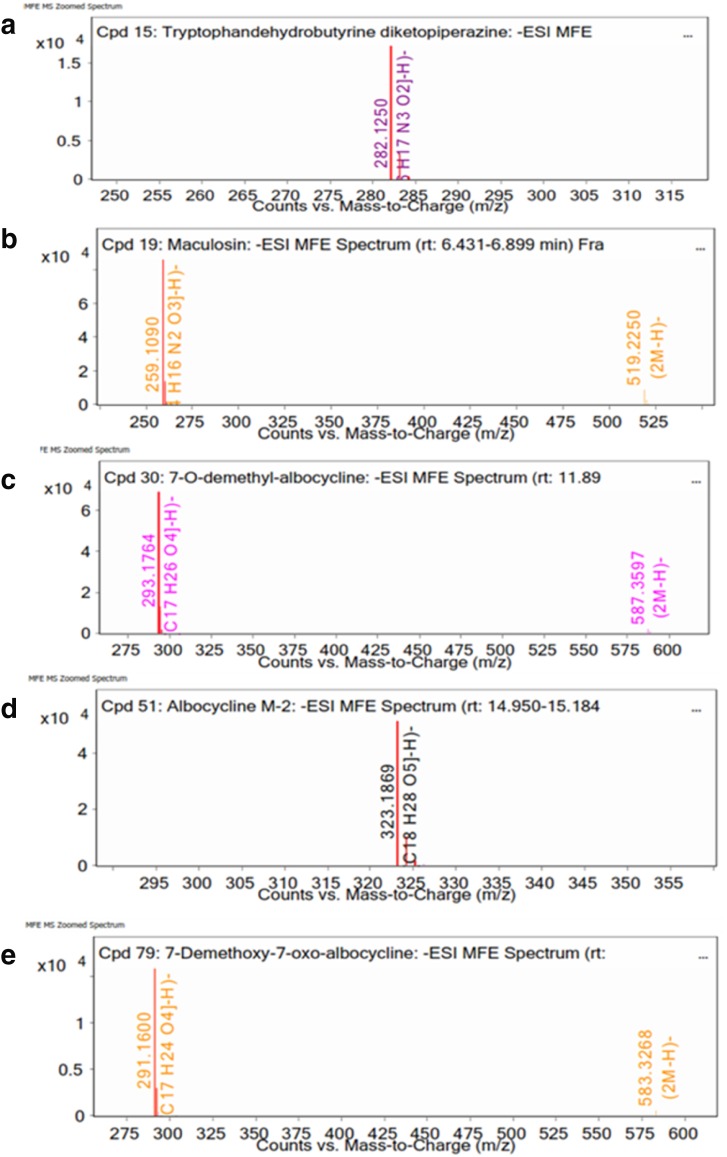
Chemotypic analysis of SSEE with LC–Q-TOF–MS was performed to obtain the metabolite profiles in the ethyl acetate extract of the strain. The LC–MS spectra of the compounds are shown in Fig. 8. The identity of the compounds was confirmed by mass fragmentation analysis (Fig. 9). Negative ion mode detected a total of five known metabolites from SSEE (Table 7). Positive ion mode did not yield any known compounds.
Fig. 8.
Negative ion (−) ESI–MS/MS analysis of ethyl acetate extract of strain VSM-30
Fig. 9.
Negative ion (−) ESI–MS/MS of ethyl acetate extract of strain VSM-30
Table 7.
Bioactive compounds identified in the ethyl acetate extract of the strain VSM-30 by LC–Q-TOF–MS
| Compound label | RT | Mass | Name | DB formula | DB diff (ppm) | Hits (DB) |
|---|---|---|---|---|---|---|
| Cpd15: tryptophan dehydrobutyrine diketopiperazine | 5.469 | 283.1323 | Tryptophan dehydrobutyrine diketopiperazine | C16 H17 N3 O2 | −0.69 | 1 |
| Cpd19: maculosin | 6.763 | 260.1163 | Maculosin | C14 H16 N2 O3 | −0.79 | 1 |
| Cpd 30:7-o-demethyl albocycline | 12.027 | 294.1836 | 7-O-demethyl albocycline | C17 H26 O4 | −1.68 | 1 |
| Cpd 51: albocycline M-2 | 15.109 | 324.1941 | Albocycline M-2 | C18 H28 O5 | −1.99 | 5 |
| Cpd 51: 7-o-demethoxy-7-oxo albocycline | 18.941 | 292.1673 | 7-O-demethoxy-7-oxo albocycline | C17 H24 O4 | 0.46 | 1 |
LC–Q-TOF–MS analysis of the strain VSM-30 indicated the presence of five potent bioactive compounds. Among the active compounds, tryptophan dehydrobutyrine diketopiperazine has antinematicidal properties (Li et al. 2012), while azido derivatives of maculosin was reported for its very strong antifungal activity against some plant pathogenic fungi, that may have practical application in agriculture as safe fungicide (Cimmino et al. 2014). Cain et al. (2003) stated that Maculosin exhibited MIC of >0.5 µg/µl against Candida albicans, while Kumar et al. (2013) found an MIC of 32 µg/µl against the same pathogen. 7-O-demethyl albocycline (cineromycin B), a 14-membered ring macrolide antibiotic, was reported bioactive against gram-positive bacteria by the inhibition of their protein synthesis by binding to the 50 s subunit of 70 s ribosomes (Elleuch et al. 2010). It also reported as an anti-adipogenesis agent (Matsuo et al. 2015). The compound albocycline was previously reported for antibacterial (Harada et al. 1984) and anti-mold properties (Zucchi et al. 2014), while 7-o-demethoxy-7-oxo albocycline (dehydro-cineromycin B) acts only on bacteria (Burkhardt et al. 1996).
Identification of antimicrobial metabolites by GC–MS
Identification of the compounds in crude extract was carried out using GC–MS evaluation. The GC–MS chromatogram of the ethyl acetate extract showed a total of 27 peaks (Fig. 10). When compared with NIST database, the nearest compound hits for those peaks were found. The peak area, molecular weight, and retention time of the compounds corresponding to the 27 peaks are reported (Supplementary Table 2). The peak area is directly proportional to the quantity of the compounds present in the ethyl acetate fraction (EAF). The fraction subjected to GC–MS analysis revealed the presence of 27 peaks noted at the retention time of 3.25 (C1), 10.634 (C2), 12.138 (C3), 12.666 (C4), 18.704 (C5), 18.819 (C6), 19.634 (C7), 21.051(C8), 23.685 (C9), 24.924 (C10), 25.515 (C11), 25.687 (C12), 25.912 (C13), 26.271 (C14), 27.386 (C15), 27.913 (C16), 28.388 (C17), 29.691 (C18), 30.076 (C19), 30.555 (C20), 31.883 (C21), 35.352 (C22), 37.018 (C23), 43.282 (C24), 47.59 (C25), 54.472 (C26), and 57.38 (C27). Further examination of these peaks by MS showed molecular ions M+ at m/z 98 (C1); 218 (C2); 172 (C3); 396 (C4); 278 (C5); 228 (C6); 214 (C7); 222 (C8); 338 (C9); 242 (C10); 380 (C11); 252 (C12); 174 (C13); 466 (C14); 224 (C15); 243 (C16); 264 (C17); 275(C18); 283 (C19); 223 (C20); 298 (C21); 326 (C22); 324 (C23); 362 (C24); 352 (C25); 450 (C26); and 478 (C27) of molecular weights, respectively (Supplementary Table 2). According to the available library data, NIST-MS search (ver.2) (included with NIST’02 mass-spectral library, Agilent p/n G1033 A) compounds C1, C2, C3, C4, C5, C6, C7, C8, C9, C10, C11, C12, C13, C14, C15, C16, C17, C18, C19, C20, C21, C22, C23, C24, C25, C26, and C27 were identified as 1H-imidazole 4,5-dihydro-2,4-dimethyl; neoisolongifolene 8,9-epoxy; 1-undecanol; 2-heptafluorobutyroxytridecane; phenol, 2,4-bis(1,1-dimethylethyl); 1-dodecanol 3,7,11-trimethyl; 2-hexyl-1-octanol; Sulfurous acid dipentyl ester; 4-trifluoroacetoxyhexadecane; 1-decanol 2-hexyl; butyl-4-amino-1-benzyl piperidine-4-carboxylate oxalic acid; 3-Octadecene (E); N-(4-ethoxy-2-nitrophenyl) acetamide; heptafluorobutanoic acid octadecyl ester; N-[4-cyclooctylaminobutyl] aziridine; benzo[c] phenanthen-5-amine; phthalic acid ethyl pentyl ester; l-alanyl-l-tryptophan; l-proline N-allyloxycarbonyl hexyl ester; 1-(triisopropylsilyl) pyrrole; butyric acid pentadecyl ester; isopropyl stearate; 1-hexadecanesulfonyl chloride; diheptyl phthalate; dihydrovallesiachotamine; and dotriacontane and tetracosane, 11-decyl—respectively. NCBI PubChem bioassay database (https://pubchem.ncbi.nlm.nih.gov) revealed that among the 27 peaks, 9 compounds indicating the presence of bioactive constituents have been previously reported for their antimicrobial activity (dotriacontane, tetracosane 11-decyl-, diheptyl phthalate, 1-hexadecanesulfonyl chloride, l-alanyl-l-tryptophan, phthalic acid, ethyl pentyl ester, 4-trifluoroacetoxyhexadecane, and 1H-imidazole 4,5-dihydro-2,4-dimethyl) and they were not isolated from actinomycetes earlier.
Fig. 10.
Gas-chromatography–mass spectrometry analysis of crude ethyl acetate extract of VSM-30
During the course of our screening programme for bioactive secondary metabolites from deep sea sediment samples of Bay of Bengal (Visakhapatnam), Streptomyces sparsus VSM-30 exhibited significant antimicrobial efficacy. The ethyl acetate extract of the isolate VSM-30 showed maximum activity against plant pathogenic fungi such as Aspergillus niger (21 mm), Penicillium citrinum (21 mm), Aspergillus flavus (20 mm) followed by Fusarium solani (19 mm), and Fusarium oxysporum (18 mm). The antibiotics isolated from marine Streptomyces were cyclomarin A (Renner et al. 1999), resistomycin (Shiono et al. 2002), glaciapyrroles A (Cho et al. 2006), actinofuranones A and B (Cho et al. 2006), piperazimycins (Miller et al. 2007), piericidins C7 and C8 (Hayakawa et al. 2007), and zorbamycin (Wang et al. 2007). Streptomyces from marine sediments were reported to be a producer of novel compounds such as production of cyclomarins A–C (Renner et al. 1999), while piperazimycins A–C are cytotoxic hexadepsipeptides that are obtained from Streptomyces sp. displayed cytotoxic and anti-viral activity (Miller et al. 2007; Shirling and Gottlieb 1966). Resistomycin, an antibiotic related to quinones, is produced by Streptomyces corchorusii, an inhibitor of HIV-1 protease (Shiono et al. 2002), whereas resistoflavine is produced by Streptomyces chibaensis which shows cytotoxic and antibacterial activity (Kock et al. 2005). mansouramycins A–D are isoquinoline quinone derivatives isolated from the extracts of Streptomyces sp. exhibited significant cytotoxicity with great degree of selectivity for lung cancer, breast cancer, melanoma, and prostate cancer cells (Hawas et al. 2009). The present findings support the view that bioactive metabolite profile of marine Streptomyces is very broad as it includes a variety of antibacterial, antifungal, antitumor, anti-inflammatory, cytotoxic, and immunosuppressive compounds.
Conclusion
A perusal of the literature clearly establishes that marine Streptomyces spp. as potential agents for screening of novel bioactive compounds. In the present study, an actinomycete strain Streptomyces sparsus VSM-30 was isolated from the deep sea marine sediment samples using dilution plate technique. The optimal conditions for the production of bioactive compounds by VSM 30 and its inhibitory effect against the responses using the RSM statistical design were determined. The CCD approach showed significant results for optimizing the process variables for maximal bioactive metabolite production and the metabolites thus extracted showed desirable antifungal activity against plant pathogenic fungi. The various bioactive compounds identified through LC–MS and GC–MS are ascertained to have wide spectrum of pharmacological activities. Further research concerning the purification and characterization of bioactive compounds produced by the strain is in progress.
Electronic supplementary material
Below is the link to the electronic supplementary material.
Acknowledgements
The first author U.K.M is grateful to University Grants commission (U.G.C), New Delhi, Government of India, for providing financial assistance in the form of fellowship to carry out this work.
Compliance with ethical standards
Conflict of interest
All authors declare that there is no conflict of interest.
Footnotes
Electronic supplementary material
The online version of this article (doi:10.1007/s13205-017-0835-1) contains supplementary material, which is available to authorized users.
References
- Adya D, Susmita M. Removal of textile dye reactive green-19 using bacterial consortium: process optimization using response surface methodology and kinetics study. J Environ Chem Eng. 2017;5:612–627. doi: 10.1016/j.jece.2016.10.005. [DOI] [Google Scholar]
- Amita J, Swati P, Manish N, Kamala V, Chamanlal S. Dissolution test for site-specific release of isoniazid pellets in USP apparatus 3 (reciprocating cylinder): optimization using response surface methodology. Eur J Pharm Biopharm. 2008;69:769–775. doi: 10.1016/j.ejpb.2007.11.020. [DOI] [PubMed] [Google Scholar]
- Baumann R, Ettlinger L, Hutter R, Kocher HP. Control of melanin formation in Strepromyces glaucescens. In: Arai T, editor. Actinomycetes: the boundary microorganisms. Toppan Co: Tokyo; 1976. pp. 55–63. [Google Scholar]
- Bipasha D, Ananda Prasad R, Sangita B, Sudip Ch, Chiranjib B. Lactose hydrolysis by β-galactosidase enzyme: optimization using response surface methodology. Ecotoxicol Environ Saf. 2015;121:244–252. doi: 10.1016/j.ecoenv.2015.03.024. [DOI] [PubMed] [Google Scholar]
- Boussada O, Ammar A, Saidana D, Chriaa J, Chraif I, Daami M, Helal AN, Mighri Z. Chemical composition and antimicrobial activity of volatile components from capitula and aerial parts of Rhaponticum acaule DC growing wild in Tunisia. Microbiol Res. 2008;163:87–95. doi: 10.1016/j.micres.2007.02.010. [DOI] [PubMed] [Google Scholar]
- Bozzola JJ, Russell LD. Electron microscopy principles and techniques for biologists. 2. Sudbury: Jones and Bartlett Publishers; 1999. [Google Scholar]
- Burkhardt K, Fiedler HP, Grabley S, Thiericke R, Zeeck A. New cineromycins and musacins obtained by metabolite pattern analysis of Streptomyces griseoviridis. Taxonomy, fermentation, isolation and biological activity. J Antibiot. 1996;49:432–437. doi: 10.7164/antibiotics.49.432. [DOI] [PubMed] [Google Scholar]
- Cain CC, Lee D, Waldo RH, Henry AT, Casida EJ, Wani MC, Wall ME, Oberlies NH, Falkinham JO. Synergistic antimicrobial activity of metabolites produced by a non obligate bacterial predator. Antimicrob Agents Chemother. 2003;47:2113–2117. doi: 10.1128/AAC.47.7.2113-2117.2003. [DOI] [PMC free article] [PubMed] [Google Scholar]
- Cho JY, Williams PG, Kwon HC, Jensen PR, Fenical W. Lucentamycins A-D, cytotoxic peptides from the marine-derived actinomycete Nocardiopsis lucentensis. J Nat Prod. 2006;70:1321–1328. doi: 10.1021/np070101b. [DOI] [PubMed] [Google Scholar]
- Chongqing W, Hui W, Younian L, Luoluo H. Optimization of surface treatment for flotation separation of polyvinyl chloride and polyethylene terephthalate waste plastics using response surface methodology. J Clean Prod. 2016;139:866–872. doi: 10.1016/j.jclepro.2016.08.111. [DOI] [Google Scholar]
- Cimmino A, Puopolo G, Perazzolli M, Andolfi A, Melck D, Pertot I, Evidente A. Cyclo (L-Pro-L-Tyr), the fungicide isolated from Lysobacter Capcici AZ78. A structure-activity relationship study. Chem Heterocycl Compd. 2014;50:317–323. doi: 10.1007/s10593-014-1475-6. [DOI] [Google Scholar]
- Cowan ST. Cowan and Steel’s manual for the identification of medical bacteria. 2. Cambridge: Univ. Press; 1974. [Google Scholar]
- Das S, Lyla PS, Khan SA. Marine microbial diversity and ecology: importance and future perspectives. Curr Sci. 2006;90:1325–1335. [Google Scholar]
- Deepak V, Kalishwaralal K, Ramkumarpandian S, Babu SV, Senthilkumar SR, Sangiliyandi G. Optimization of media composition for Nattokinase production by Bacillus subtilis using response surface methodology. Bioresour Technol. 2008;99:8170–8174. doi: 10.1016/j.biortech.2008.03.018. [DOI] [PubMed] [Google Scholar]
- Ellaiah P, Adinarayana G, Saisha V, Vasu P. An oligoglycosidic antibiotic from a newly isolated Streptomyces albovinaceus. Ind J Microbiol. 2005;45:33–36. [Google Scholar]
- Elleuch L, Shaaban M, Smaoui S, Mellouli L, Rebai IK, Ben Fguira LF, Shaaban KA, Laatsch H. Bioactive secondary metabolites from a new terrestrial Streptomyces sp. TN262. Appl Biochem Biotechnol. 2010;162:579–593. doi: 10.1007/s12010-009-8808-4. [DOI] [PMC free article] [PubMed] [Google Scholar]
- Ferreira SLC, Bruns RE, Ferreira HS, Matos GD, David JM, Brandão GC, da Silva EG, Portugal LA, dos Reis PS, Souza AS, dos Santos WN. Box-behnken design: an alternative for the optimization of analytical methods. Anal Chim Acta. 2007;597:179–186. doi: 10.1016/j.aca.2007.07.011. [DOI] [PubMed] [Google Scholar]
- Gaddafi ID, Tawfik AS, Shamsuddeen AA. Response surface methodology optimization of adsorptive desulfurization on nickel/activated carbon. Chem Eng J. 2017;313:993–1003. doi: 10.1016/j.cej.2016.10.141. [DOI] [Google Scholar]
- Gámiz-Gracia L, Cuadros-Rodríguez L, Almansa-López E, Soto-Chinchilla JJ, García-Campaña AM. Use of highly efficient draper-lin small composite designs in the formal optimisation of both operational and chemical crucial variables affecting a FIA-chemiluminescence detection system. Talanta. 2003;60:523–534. doi: 10.1016/S0039-9140(03)00107-3. [DOI] [PubMed] [Google Scholar]
- Gordon RE. Some criteria for the recognition of Nocardia madura (Vincent) Blanchord. J Gen Microbiol. 1966;45:355–364. doi: 10.1099/00221287-45-2-355. [DOI] [PubMed] [Google Scholar]
- Halil İbrahim O, Ilkay K. Application of response surface methodology for optimizing the recovery of phenolic compounds from hazelnut skin using different extraction methods. Ind Crops Pod. 2016;91:114–124. doi: 10.1016/j.indcrop.2016.05.033. [DOI] [Google Scholar]
- Hamid Shahbaz M, Seyede Samaneh M, Saeideh S, Maryam P, Anvarsadat K, Sajad B. Response surface methodology to optimize partition and purification of two recombinant oxidoreductase enzymes, glucose dehydrogenase and d-galactose dehydrogenase in aqueous two-phase systems. Protein Expr Purif. 2015;108:41–47. doi: 10.1016/j.pep.2015.01.002. [DOI] [PubMed] [Google Scholar]
- Harada K, Nishida F, Takagi H, Suzuki M, Iwashita T. Studies on an antibiotic, albocycline VII. Minor components of albocycline. J Antibiot. 1984;37:1187–1197. doi: 10.7164/antibiotics.37.1187. [DOI] [PubMed] [Google Scholar]
- Hawas UW, Shaaban M, Shaaban KA, Speitling M, Maier A, Kelter G, Fiebig HH, Meiners M, Helmke E, Laatsch H. Mansouramycins A-D, cytotoxic isoquinolinequinones from a marine Streptomycete. J Nat Prod. 2009;72:2120–2124. doi: 10.1021/np900160g. [DOI] [PubMed] [Google Scholar]
- Hayakawa Y, Shirasaki S, Kawasaki T, Matsuo Y, Adachi K, Shizuri Y. Structures of new cytotoxic antibiotics, piericidins C7 and C8. J Antibiot. 2007;60:201–203. doi: 10.1038/ja.2007.23. [DOI] [PubMed] [Google Scholar]
- Hensyl WR (1994) In: John GH, Stanley TW (eds) Bergey’s manual of systematic bacteriology, 9th edn. Williams and Wilkins, Baltimore
- Isik K, Chun J, Hah YC, Goodfellow M. Nocardia salmonicida nom. rev., a fish pathogen. Int J Syst Bacteriol. 1999;49:833–837. doi: 10.1099/00207713-49-2-833. [DOI] [PubMed] [Google Scholar]
- Jensen PR, Williams PG, Oh DC, Ziegler L, Fenical W. Species specific secondary metabolite production in marine actinomycetes of the genus Salinispora. Appl Environ Microbiol. 2007;73:1146–1152. doi: 10.1128/AEM.01891-06. [DOI] [PMC free article] [PubMed] [Google Scholar]
- Jones K. Fresh isolates of actinomycetes in which the presence of sporogenous aerial mycelia is a fluctuating characteristics. J Bacteriol. 1949;57:141–145. doi: 10.1128/jb.57.2.141-145.1949. [DOI] [PMC free article] [PubMed] [Google Scholar]
- Kampfer P, Kroppenstedt RM, Dott W. A numerical classification of the genera Streptomyces and Streptoverticillium using miniaturized physiological tests. J Gen Microbiol. 1991;137:1831–1891. doi: 10.1099/00221287-137-8-1831. [DOI] [Google Scholar]
- Katrin T, Philip L, Jürgen H. Application of genetic algorithms and response surface analysis for the optimization of batch chromatographic systems. Biochem Eng J. 2012;63:66–75. doi: 10.1016/j.bej.2012.02.003. [DOI] [Google Scholar]
- Khaoula MH, Majdi H, Christophe R, Didier LC, Riadh K, Hatem M. Optimization extraction of polysaccharide from Tunisian Zizyphus lotus fruit by response surface methodology: composition and antioxidant activity. Food Chem. 2016;212:476–484. doi: 10.1016/j.foodchem.2016.06.004. [DOI] [PubMed] [Google Scholar]
- Kock I, Maskey RP, Biabani MAF, Helmke E, Laatsch H. 1-Hydroxy-1-norresistomycin and resistoflavine methyl ether: new antibiotics from marine derived Streptomycetes. J Antibiot. 2005;58:530–534. doi: 10.1038/ja.2005.73. [DOI] [PubMed] [Google Scholar]
- Kumar N, Mohandas C, Nambisan B, Soban Kumar DR, Ravi SL. Isolation of proline based cyclic dipeptides from Bacillus sp. N strain associated with rhabitid entomopathogenic nematode and its antimicrobial properties. World J Microbiol Biotechnol. 2013;29:355–364. doi: 10.1007/s11274-012-1189-9. [DOI] [PubMed] [Google Scholar]
- Li Ping, Li Ma, Jia-qin XI, Dun-huang F, Fa-xiang Y, Ming-he MO. Studies on the biocontrol efficiencies of strain BJLSH9 towards nematode and Phytophthora nicotianae and the identification of the nematicidal metabolite. J Yunnan Univ. 2012;34:590–595. [Google Scholar]
- Li XG, Tang XM, Xiao J, Ma GH, Xu L, Xie SJ, Xu MJ, Xiao X, Xu J. Harnessing the potential of halogenated natural product biosynthesis by mangrove-derived actinomycetes. Mar Drugs. 2013;11:3875–3890. doi: 10.3390/md11103875. [DOI] [PMC free article] [PubMed] [Google Scholar]
- Maelle D, Ashraf B, Andre G, Yves D, Paul A. Optimization of a green process for the extraction of lutein and chlorophyll from spinach by-products using response surface methodology (RSM) LWT Food Sci Technol. 2017;79:170–177. doi: 10.1016/j.lwt.2017.01.010. [DOI] [Google Scholar]
- Majd MH, Ahmad R, Davoud S, Bashi S, Ali M, Shadi B. ptimization of ultrasonic-assisted extraction of phenolic compounds from bovine pennyroyal (Phlomidoschema parviflorum) leaves using response surface methodology. Ind Crop Prod. 2014;57:195–202. doi: 10.1016/j.indcrop.2014.03.031. [DOI] [Google Scholar]
- Matsuo H, Kondo Y, Kawasaki T, Imamura N. Cineromycin B isolated from S. cinerochromogenes inhibits adipocyte differentiation of 3T3-L1 cells via kruppel-like factors 2 and 3. Life Sci. 2015;135:35–42. doi: 10.1016/j.lfs.2015.05.020. [DOI] [PubMed] [Google Scholar]
- Miller ED, Kauffman CA, Jensen PR, Fenical W. Piperazimycins cytotoxic hexadepsipeptides from a marine derived bacterium of the genus Streptomyces. J Org Chem. 2007;72:323–330. doi: 10.1021/jo061064g. [DOI] [PubMed] [Google Scholar]
- Myers RH, Montgomery DC, Anderson-Cook CM. Response surface methodology: process and product optimization using designed experiments. Hoboken: Wiley; 2009. [Google Scholar]
- Nilsson WB, Strom MS. Detection and identification of bacterial pathogens of fish in kidney tissue using terminal restriction fragment length polymorphism (T-RFLP) analysis of 16S rRNA genes. Dis Aquat Org. 2002;48:175–185. doi: 10.3354/dao048175. [DOI] [PubMed] [Google Scholar]
- Nonomura H, Ohara Y. Distribution of actinomycetes in soil. VI. A culture method effective for both preferential isolation and enumeration of Microbispora and Streptosporangium strains in soil (Part 1) J Ferment Technol. 1969;47:463–469. [Google Scholar]
- Pridham TG, Gottlieb D. The utilization of carbon compounds by some actinomycetales as an aid for species determination. J Bacteriol. 1948;56:107–114. doi: 10.1128/jb.56.1.107-114.1948. [DOI] [PMC free article] [PubMed] [Google Scholar]
- Pridham TG, Hesseltine CW, Benedict RG. A guide for the classification of Streptomyces according to selected groups. Appl Microbiol. 1958;6:52–79. doi: 10.1128/am.6.1.52-79.1958. [DOI] [PMC free article] [PubMed] [Google Scholar]
- Qixuan L, Huiling L, Junli R, Aojie D, Weiying L, Chuanfu L, Runcang S. Production of xylooligosaccharides by microwave-induced, organic acid-catalyzed hydrolysis of different xylan-type hemicelluloses: optimization by response surface methodology. Carbohydr Polym. 2017;157:214–225. doi: 10.1016/j.carbpol.2016.09.091. [DOI] [PubMed] [Google Scholar]
- Renner MK, Shen YC, Cheng XC, Jensenm PR, Frankmoelle W, Kauffman CA, Fenical W, Lobkovsky E, Cladry J. Cyclomarins A-C, new anti-inflammatory cyclic peptides produced by a marine bacterium (Streptomyces sp.) J Am Chem Soc. 1999;121:11273–11276. doi: 10.1021/ja992482o. [DOI] [Google Scholar]
- Saranya P, Sekaran G. Statistical optimization of the enzymatic breakdown of 2-nitrophloroglucinol using thermo tolerant mixed intracellular enzymes from Serratia marcescens. J Taiwan Inst Chem Eng. 2016;59:152–164. doi: 10.1016/j.jtice.2015.09.014. [DOI] [Google Scholar]
- Shiono Y, Shiono N, Seo S, Oka S, Yamazaki Y. Effects of polyphenolic anthrone derivatives resistomycin and hypericin on apoptois in human megakaryoblastic leukemia CMK-7cell2. Z Natuforsch. 2002;57:923–929. doi: 10.1515/znc-2002-9-1028. [DOI] [PubMed] [Google Scholar]
- Shirling EB, Gottlieb D. Methods for characterization of Streptomyces species. Int J Syst Bacteriol. 1966;16:313–340. doi: 10.1099/00207713-16-3-313. [DOI] [Google Scholar]
- Shuvankar B, Savita K, Sabu T, Nimmy A. Halophilic and halotolerant actinomycetes from a marine saltern of Goa, India producing anti-bacterial metabolites. J Biosci Bioeng. 2015;119:323–330. doi: 10.1016/j.jbiosc.2014.08.017. [DOI] [PubMed] [Google Scholar]
- Skropeta D. Deep sea natural products. Nat Prod Rep. 2008;25:1131–1166. doi: 10.1039/b808743a. [DOI] [PubMed] [Google Scholar]
- Souagui Y, Tritsch D, Grosdemange-Billiard C, Kecha M. Optimization of antifungal production by an alkaliphilic and halotolerant actinomycete, Streptomyces sp. SY-BS5, using response surface methodology. J Med Mycol. 2015;25:108–115. doi: 10.1016/j.mycmed.2014.12.004. [DOI] [PubMed] [Google Scholar]
- Subramani R, Aalbersberg W. Marine actinomycetes: an ongoing source of novel bioactive metabolites. Microbiol Res. 2012;167:571–580. doi: 10.1016/j.micres.2012.06.005. [DOI] [PubMed] [Google Scholar]
- Tresner HD, Hayes JA, Backus EJ. Differential tolerance of Streptomyces to sodium chloride as a taxonomic aid. Appl Microbiol. 1968;16:1134–1136. doi: 10.1128/am.16.8.1134-1136.1968. [DOI] [PMC free article] [PubMed] [Google Scholar]
- Vohra A, Satyanarayana T. Statistical optimization of medium components by response surface methodology to enhance phytase production by Pichia anomala. Proc Biochem. 2002;37:999–1004. doi: 10.1016/S0032-9592(01)00308-9. [DOI] [Google Scholar]
- Waksman SA (1961) The actinomycetes. Vol. II. Classification, identification and descriptions of genera and species. The Williams and Wilkins Co, Baltimore
- Wang L, Yun BS, George NP, Wendt-Pienkowski E, Galm U, Oh TJ, Coughlin JM, Zhang G, Tao M, Shen B. Glycopeptide antitumor antibiotic zorbamycin from Streptomyces flavoviridis ATCC 21892: strain improvement and structure elucidation. J Nat Prod. 2007;7:402–406. doi: 10.1021/np060592k. [DOI] [PMC free article] [PubMed] [Google Scholar]
- Yatisha KV, Lalithambaa HS, Sureshb R, Arunb SB, Vinay Kumar P. Optimization of scum oil biodiesel production by using response surface methodology. Process Saf Environ Prot. 2016;102:667–672. doi: 10.1016/j.psep.2016.05.026. [DOI] [Google Scholar]
- Zucchi TD, Almeida LG, Moraes LAB, Consoli FL. Albocycline, the main bioactive compound from Propionicimonas sp. ENT-18 against Sclerotinia sclerotiorum. Ind Crops Prod. 2014;52:264–268. doi: 10.1016/j.indcrop.2013.10.033. [DOI] [Google Scholar]
Associated Data
This section collects any data citations, data availability statements, or supplementary materials included in this article.


