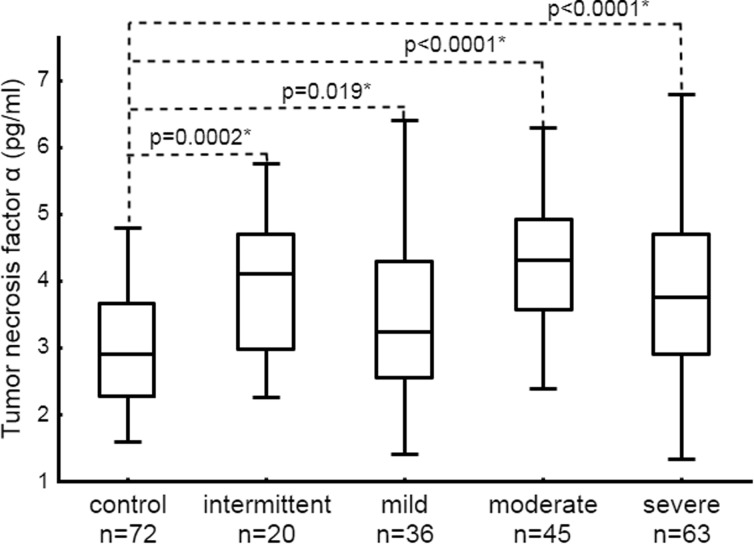
Fig. 2.
Distribution of tumor necrosis factor α in controls and patients with intermittent, persistent mild, moderate, and severe asthma. Data is presented as median, interquartile range, and maximum and minimum values. Numbers on the graph represent p values in comparison to control. Statistically significant differences are marked with an asterisk.

