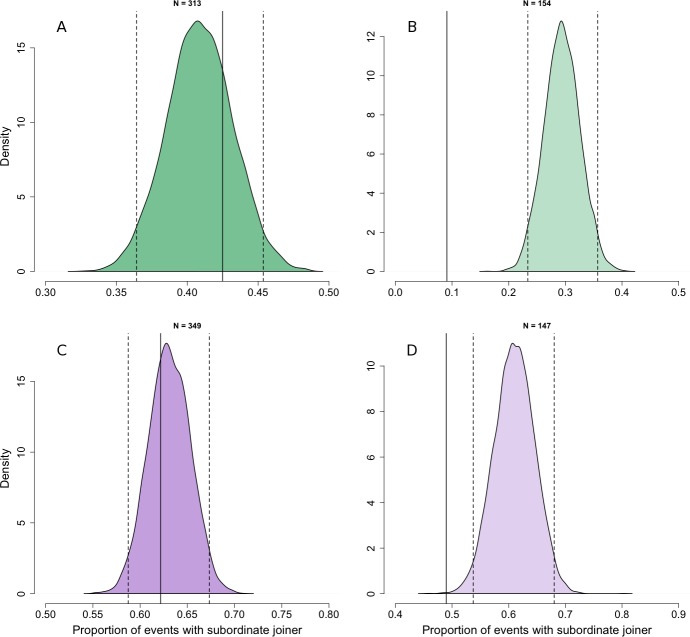
Figure 2. Comparison of observed dominance asymmetry during join events with simulated joining behaviour that is random with respect to rank difference.
Probability density distributions show expectations for the proportion of join events in which the joining individuals would be subordinate to the joined individual if their behaviour was random with respect to the rank of the joined individual. The distributions are for adults (A) and juveniles (B) at the patch level, and adults (C) and juveniles (D) at the sub-patch level, generated through 10,000 iterations of randomly selecting the individual to be joined at each join event. For each distribution, dotted vertical lines indicate the 95% tolerance intervals and solid vertical lines indicate our observed value.

