Abstract
Functional limitations and disability declined in the US during the 1980s and 1990s, but reports of early 21st century trends are mixed. Whether educational inequalities in functioning increased or decreased is also poorly understood. Given the importance of disability for productivity, independent living, and health care costs, these trends are critical to US social and health policies. We examine recent trends in functional limitations and disability among women and men aged 45–64. Using 2000–2015 National Health Interview Surveys data on over 155,000 respondents, semiparametric and logistic regression models visualize and test functioning trends by education. Among women and men with at least a college degree, there was no change in disability and mild increase in limitations over time. All other education levels experienced significant increases in functioning problems ranging from 18% higher odds of functional limitations in 2015 compared to 2000 among men with some college to about 80% increase in the odds of disability among women and men with less than high school education. The similar trends for both genders suggest common underlying causes, possibly including the worsening economic well-being of middle- and working-class families. The pervasive growth of functioning problems is a cause for concern that necessitates further scholarly investigation.
The high costs of disability to individuals, families, communities, and nationwide (Freedman, Martin, and Schoeni 2002; Fried et al. 2001) make it imperative that we carefully track the level and trends of functioning problems. Beyond aggregate patterns, understanding disability trends across different social groups is critical for health care and policy planning targeted optimally at the most vulnerable groups in the population.
Extensive literature has documented the aggregate US trends in functioning since the late 1960s (Verbrugge and Liu 2014). In general, functioning problems increased in the 1960s and 1970s (Crimmins, Saito, and Ingegneri 1997; Verbrugge 1989). This growth was followed by significant long-term improvements in physical limitations and disability in the 1980s and 1990s (Crimmins 2004; Crimmins and Saito 2001; Manton, Gu, and Vicki 2006; Schoeni, Freedman, and Wallace 2001). Findings on early 21st century trends have been mixed. Most studies found continued declines in disability or at worst no change among older adults and elderly (Freedman et al. 2013; Hung et al. 2011; Martin, Schoeni, and Andreski 2010; Martin et al. 2007; Schoeni et al. 2005; Seeman et al. 2010; Tsai 2016). In contrast, trends among non-elderly adults suggest stagnating or even increasing functional limitations and disability (Crimmins and Beltrán-Sánchez. 2011; Freedman et al. 2013; Martin and Schoeni 2014; Martin et al. 2010; Martin, Schoeni, and Andreski 2010; Seeman et al. 2010). It is important to gain a complete picture of functioning trends among non-elderly US women and men in order to track the emergence of the disablement process in the mid-adulthood (Verbrugge and Jette 1994), in order to target prevention and interventions appropriately across the population.
The increasing average educational attainment in the population is thought to be a key contributor to the functioning improvements of the late 20th century (Crimmins 2004; Crimmins and Saito 2001; Martin, Schoeni, and Andreski 2010; Schoeni, Freedman, and Martin 2008). Freedman and Martin (1999) even considered education the “most important” factor explaining the disability trends of the 1980s and 1990s. In addition to the increasing average attainment in the population, the effects of education for functioning and other health dimensions increased in recent decades (Chen and Sloan 2015;Goesling 2007; Mirowsky and Ross 2008). Despite the central role of education in population health, surprisingly little research assessed functioning trends across different levels of education (Freedman, Martin, and Schoeni 2002; Schoeni et al. 2005). The few exceptions included education as a covariate and noted persistent or increasing disparities in functioning and related outcomes (Crimmins and Saito 2001; Martin et al. 2007; Schoeni et al. 2005). This gap in the literature is all the more startling because research on mortality trends focused heavily on educational disparities and determined that the troubling aggregate trends (Crimmins and Beltrán-Sánchez 2011) are driven primarily by the increasing death rates of low-educated women (Montez and Zajacova 2013a, 2013b).
To address the gaps in the literature, the aim of this brief report is to document current trends in physical functioning among non-elderly US women and men by education level. The report contributes to our understanding of functioning trends by: (a) conducting an up-to-date assessment of the trends, (b) focusing on an age group that has experienced worrisome mortality trends in recent decades (Case and Deaton 2015), and (c) focusing on how functioning changed for adults with different levels of education as an increasingly important social determinant of health and mortality in the United States.
Data and Methods
Data
We used the National Health Interview Surveys (NHIS) 2000–2015. The NHIS is an annual cross-sectional, nationally representative survey of the noninstitutionalized US population. It is the best available source of data for this study because it includes a long series of identical questions on functional limitations and disability, ongoing data collection, and a large sample of mid-adulthood respondents. To document trends in early 21st century, we used all available relevant waves starting with the year 2000.
Sample is defined as “sample adult” women and men age 45–64 with nonmissing data on education and functioning. The “sample adult” is a random subsample of respondents who were administered all health measures. Out of 158,948 sample adults age 45–64, 1,303 (0.8%) did not have valid education information. An additional 38 respondents (0.02%) did not have valid disability information, and 2,176 were missing functional limitations. Our sample size is thus 157,607 for disability and 155,469 for limitations.
Variables
Key predictors are (1) time period and (2) educational attainment. Time is measured in quarter-years of interview, ranging from 2000 to 2014.75. In logistic models, it is centered on the mean year 2007 and divided by 16 (the length of the data series from 2000 to 2015) to obtain easily interpretable coefficients. Educational attainment is coded as less than high school, high school diploma, some college, and bachelor’s degree or higher. GED is coded with less than high school based on prior research (Zajacova and Everett 2014).
Basic control variables included in all estimation models are age and race/ethnicity. Age is included as a continuous variable measured in single years. Race/ethnic categories are non-Hispanic white (reference), non-Hispanic black, Hispanic, and other.
Outcomes comprises two measures, one that represents a lower threshold of functioning problems and one that represents more severe problems. The lower threshold measure is a binary indicator of “any functional limitations.” We classify respondents as having a functional limitation if they reported any difficulty with at least one of four functioning dimensions, including mobility, sensory, emotional, and cognitive. The high threshold measure is a binary indicator of needing help with activities of daily living (ADLs), such as dressing or bathing, or with instrumental activities of daily living (IADLs), such as household chores or shopping. In auxiliary analyses (available on request), we also estimated models for all the individual components comprising these summary outcomes. We found the component trends to be similar to the findings presented below for the summary measures.
Approach
The analyses were estimated on pooled 2000–2015 NHIS data stratified by gender. After descriptive analyses, we estimated aggregate and education-specific trends using semiparametric partial-linear models (Lokshin 2006) of each outcome as a function of flexibly estimated time trend net of basic controls. Next we estimated logistic regression models of the two outcomes as a function of (a) trends aggregated across all education levels, (b) trends stratified by education, and (c) education and time trend interaction to test whether the trends are converging, diverging, or remaining constant across education levels.
Sensitivity analyses included models where 1,182 (0.8%) proxy respondents were excluded (proxy information is available in years 2001–2015) and found results similar to those shown. We also estimated models with quadratic time trends but found the quadratic term was not significant in any models, indicating that linear trend is the optimal parametrization. We also tested for gender differences in the education-specific trends and found men and women statistically equivalent in seven of eight models, with the only difference a steeper trend in functional limitations among those with less than high school for women than for men. All auxiliary findings are available on request.
Results
Table 1 shows the distribution of key characteristics in the sample weighted to represent the noninstitutionalized US population age 45–64 years. The respondents were 54 years old on average. About 30% of the women and men had completed college and an additional 30% had some college but not a bachelor’s degree; 25% were high school graduates and 15% had not completed high school. Over 58% of female respondents and 53% of male respondents had some functional limitations. Nearly 6% of women and about 4% of men reported needing help with ADL or IADL tasks.
Table 1.
Sample descriptives, women and men aged 45-64, NHIS 2000–2015
| Women | Men | |
|---|---|---|
| Age (years) | 54.0 (.02) | 53.9 (.02) |
| Year | 2007.8 (.02) | 2007.8 (.03) |
| Race | ||
| Non-Hispanic White | 74.6% | 76.2% |
| Non-Hispanic Black | 12.7% | 10.9% |
| Hispanic | 8.6% | 8.7% |
| Other | 4.0% | 4.2% |
| Education | ||
| Less than high school | 14.8% | 16.1% |
| High school | 25.5% | 24.7% |
| Some college | 30.9% | 27.9% |
| College degree (bachelor’s) or more | 28.8% | 31.2% |
| Functional limitations and disability | ||
| Any functional limitations | 58.6% | 53.1% |
| Needs help with ADL/IADL | 5.8% | 4.2% |
| N | 86,039 | 71,568 |
Note. Adjusted for NHIS complex sampling design.
Figures 1a and 1b depict the aggregate age- and race-adjusted trends in functional limitations (Figure 1a) and disability (Figure 1b) for women and men. For both outcomes and both genders, functioning problems increased steadily during the 2000–2015 period. Statistical tests of the trends (Table 2, Panel A) indicate the increases are statistically significant at p < .001. From 2000 to 2015, the odds of any limitations grew by 19% among women and 15% among men, and the odds of disability increased by 24% for women and 45% for men.
Figure 1a.
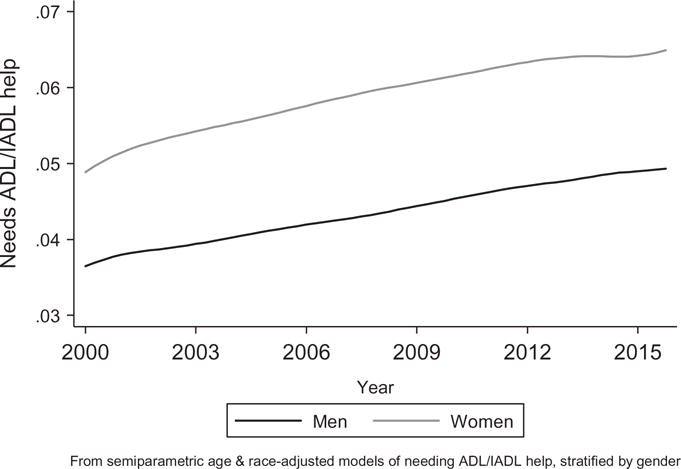
Aggregate trends in disability, women and men.
Figure 1b.
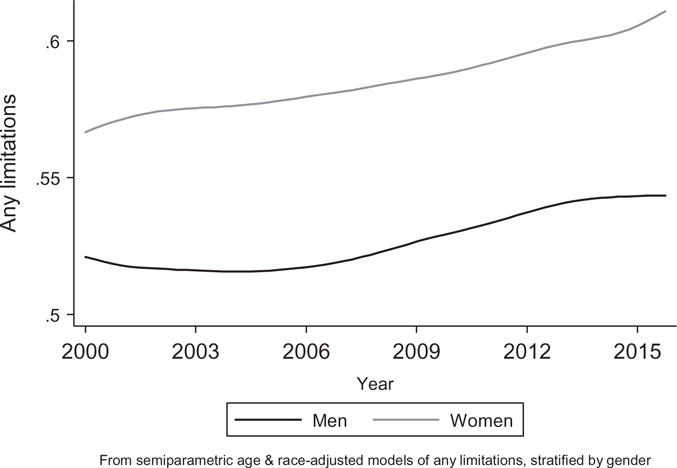
Aggregate trends in limitation, women and men.
Table 2.
Time trends in functioning, women and men aged 45–64 years, NHIS 2000–2015.
| Women
|
Men
|
|||
|---|---|---|---|---|
| Functional limitations | Need help with ADL/IADL | Functional limitations | Need help with ADL/IADL | |
| Panel A. Aggregate models (4 models) | ||||
| Time trenda | 1.19*** | 1.24*** | 1.15*** | 1.45*** |
| Panel B. Education-stratified models (16 models) | ||||
| Time trend for less than HS | 1.83*** | 1.78*** | 1.36*** | 1.82*** |
| Time trend for HS | 1.39*** | 1.39** | 1.23** | 1.72*** |
| Time trend for come college | 1.29*** | 1.42*** | 1.18** | 1.44** |
| Time trend for BA or more | 1.11* | 0.80 | 1.13* | 1.08 |
| Panel C. Trend by education interaction (4 models) | ||||
| Time trend for BA+ | 1.13* | 0.89 | 1.15* | 1.20 |
| Time trend for other educational levels | ||||
| Less than HS * Trend | 1.52*** | 1.93*** | 1.13 | 1.48 |
| HS * Trend | 1.22** | 1.60** | 1.07 | 1.45 |
| Some college * Trend | 1.15* | 1.61** | 1.03 | 1.22 |
| Education (BA = ref.) | ||||
| Less than HS | 3.13*** | 4.59*** | 2.83*** | 4.97*** |
| HS | 1.66*** | 2.11*** | 1.72*** | 2.46*** |
| Some college | 1.68*** | 2.41*** | 1.79*** | 2.39*** |
Note.
p < .05,
p < .01,
p < .001.
Time trend in all models, defined as (year—2007)/16, captures change in outcome during the 16-year period 2000–2015.
The table shows odds ratios from logistic regression models predicting “any functional limitations” and “needing help with ADL or IADL,” adjusting for age, race/ethnicity, flexible time trend. The models adjust for NHIS complex sampling design. Tables with all coefficients are available on request.
The second part of the analysis assessed education-specific trends. The findings for both outcomes are shown in Figure 2a and 2b for women and Figure 3a and 3b for men. In all four plots, the results show the following four patterns: (1) no education group experienced declines in functioning problems, (2) college-educated women and men had little change in functioning over time, (3) the increases in both outcomes and both genders over time are most evident for adults with the least education, yielding increasing educational inequalities in functioning over time, and (4) adults with “some college had similar functioning patterns as adults who only completed high school. Panel B and Panel C of Table 2 show statistical tests of these trends. The findings in Panel B show flat (not statistically significant) trends in disability for college graduates and marginally increasing trends in limitations. For all other educational-attainment levels, the increases over time in both outcomes are significant at p < .01. The least educated group—women and men with less than high school—experienced the steepest increases in functioning problems. Panel C further shows that relative to college graduates, the functioning trends for the three less-educated groups are significantly steeper among women and statistically equivalent but in the direction of steeper trends for men.
Figure 2a.
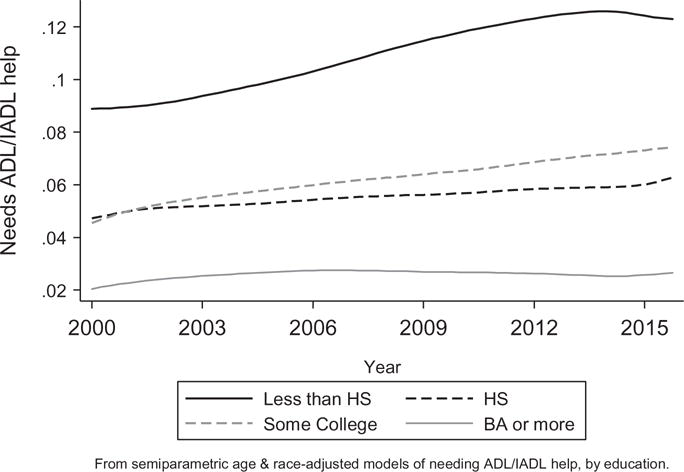
Trends in disability by education, women 45–64.
Figure 2b.
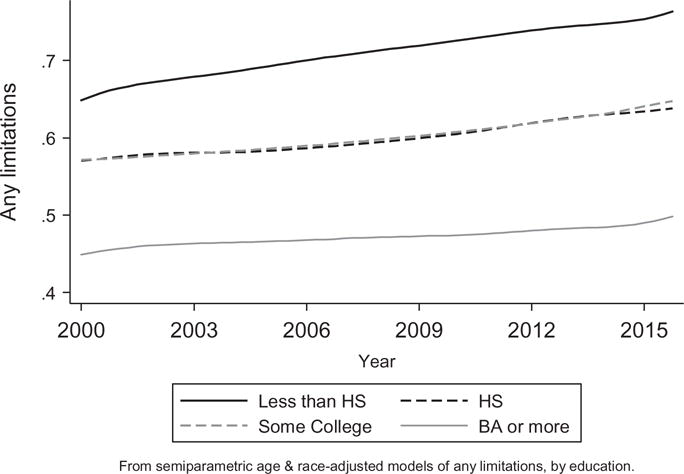
Trends in “Any Limitation by education, women 45–64.
Figure 3a.
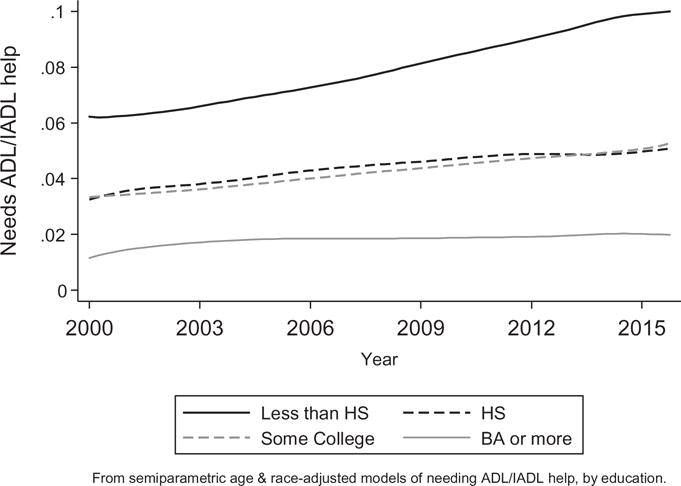
Trends in disability by education, men 45–64.
Figure 3b.
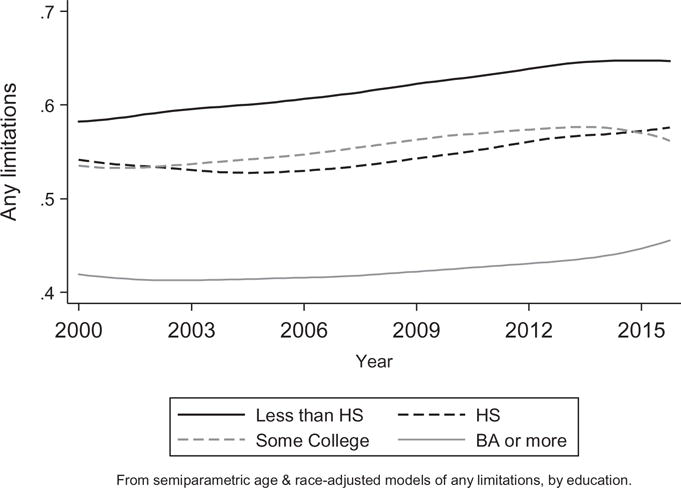
Trends in "Any Limitation" by education, men 45–64.
Discussion
In this brief report, we examined education-specific functioning trends among non-elderly American women and men. The study contributes to the literature in several ways: (1) we provide estimates through 2015, (2) we include two summary indices of functioning, "any functional limitations" as a low threshold of problems and "needing help with ADL/IADLs" as a high threshold capturing severe problems, (3) we analyze the non-elderly, which is both understudied with respect to functioning and also important for predicting future trends, and (4) we focus on trends by education as a factor widely considered to be a fundamental social determinant of health and functioning trends in particular (Freedman and Martin 1999).
Our findings show troubling trends in functioning problems: from 2000 to 2015, the odds of any functional limitation increased by 19% for women and 15% for men; disability increased by 24% in women and 45% in men. We also found that these trends are rather pervasive across the educational spectrum. The most educated women and men—those with at least a college degree—experienced no change in disability and a mild increase in limitations. All other education groups registered significant increases in both outcomes. The increases range from about 20–30% higher odds of any limitations in 2015 compared to 2000 among women and men with some college, up to around 80% higher odds of disability among women and men without a high school diploma.
The functioning patterns were similar for women and men. This suggests that the factors responsible for the observed trends in functioning problems are salient for both genders. The examination of possible explanatory factors of the trends is beyond the scope of this brief report. However, based on prior literature (Montez 2013; Schoeni et al. 2005) we speculate that economic well-being and possibly health behaviors may influence the trends. Economic well-being, including stable and meaningful employment with liveable income, has been compromised in recent decades and may play a role in these trends (Case and Deaton 2015; Montez and Zajacova 2013b). The worsening economic situation occurred for most Americans except the most advantaged, which fits the aggregate increases observed here. Moreover, the negative changes were most pronounced for the least educated, which could help explain the increasing inequalities in functioning problems, where less education is associated with double disadvantage of a higher prevalence of functioning problems alongside steeper increases over time. With respect to health behaviors, evidence for the role of obesity in functioning trends is mixed (Iezzoni, Kurtz, and Rao 2014; Martin and Schoeni 2014), as is the role of smoking. Some studies found smoking was important in the functioning trends in the late 20th century (Martin, Schoeni, and Andreski 2010) while other studies eliminated smoking as a cause (Schoeni, Freedman, and Martin 2008). Thus the question of potential causes of the recent increases is an important promising area for future research.
Some sampling and measurement issues limit the generalizability of the findings. The NHIS targeted noninstitutionalized adults, which excluded the severely disabled and thus underestimated the actual level of disability in the population. If the rate of institutionalization changed substantially over time, this could also influence our estimates of trends, especially for the disability outcome. However, the upward trend was observed also for functional limitations, which are only weakly related to institutionalization. Another limitation is that all our measures are self-reported. If there were systematic changes in reporting of functioning problems in the population over time, our findings could be biased. While it is unlikely that the substantial increases we observed could be due to reporting changes, this potential problem can be tested with other data where functioning is objectively measured. Finally, the average educational attainment of the target population increased significantly between 2000 and 2016, so the relative sizes and compositions of the educational groups changed. In particular, the lower-educated groups are more negatively selected and the higher-educated groups less positively selected, so nonrandom selection could play a role in the group-specific trends (Bound et al. 2015). However, we re-estimated all models using period-specific relative educational rank instead of standard educational categories (results available on request) and reached the same substantive conclusions: worsening functioning among most working-age Americans, with steeper increases in problems among the more disadvantaged.
Our findings add to a growing body of literature that has described recent increases in morbidity and mortality among middle-aged adults (e.g., Case and Deaton 2015). Even more alarming, the worsening trends in physical functioning have occurred for both sexes and are evident across most levels of schooling. These results are a call to action for a serious research agenda dedicated to understanding—and addressing—the underlying causes of these trends.
Acknowledgments
The authors thank Linda G. Martin and Robert F. Schoeni for their invaluable suggestions on conceptualizing this project, the anonymous reviewer for helpful questions, and Eileen Crimmins and Norella Putney for expert editorial assistance.
Funding
This project was supported by Pilot Grant from the Network on Life Course Health Dynamics and Disparities in 21st Century America, NIA R24AG045061 (PI: Zajacova; Co-PI: Montez; Network PI: House).
References
- Bound J, Geronimus AT, Rodriguez JM, Waidmann TA. Measuring recent apparent declines in longevity: The role of increasing educational attainment. Health Affairs. 2015;34:2167–73. doi: 10.1377/hlthaff.2015.0481. [DOI] [PMC free article] [PubMed] [Google Scholar]
- Case A, Deaton A. Rising morbidity and mortality in midlife among white non-Hispanic Americans in the 21st century. Proceedings of the National Academy of Sciences. 2015;112:15078–83. doi: 10.1073/pnas.1518393112. [DOI] [PMC free article] [PubMed] [Google Scholar]
- Chen Y, Sloan FA. Explaining disability trends in the U.S. elderly and near-elderly population. Health Services Research. 2015;50:1528–49. doi: 10.1111/1475-6773.12284. [DOI] [PMC free article] [PubMed] [Google Scholar]
- Crimmins EM. Trends in the health of the elderly. Annual Review of Public Health. 2004;25:79–98. doi: 10.1146/annurev.publhealth.25.102802.124401. [DOI] [PubMed] [Google Scholar]
- Crimmins EM, Beltrán-Sánchez H. Mortality and morbidity trends: Is there compression of morbidity? Journals of Gerontology Series B: Psychological Sciences and Social Sciences. 2011;66B:75–86. doi: 10.1093/geronb/gbq088. [DOI] [PMC free article] [PubMed] [Google Scholar]
- Crimmins EM, Saito Y, Ingegneri D. Trends in disability-free life expectancy in the United States, 1970–90. Population and Development Review. 1997;23:555–72. doi: 10.2307/2137572. [DOI] [Google Scholar]
- Crimmins EM, Saito Y. Trends in healthy life expectancy in the United States, 1970–1990: Gender, racial, and educational differences. Social Science & Medicine. 2001;52:1629–41. doi: 10.1016/S0277-9536(00)00273-2. [DOI] [PubMed] [Google Scholar]
- Freedman V, Spillman B, Andreski P, Cornman J, Crimmins E, Kramarow E, Lubitz J, Martin L, Merkin S, Schoeni R, Seeman T, Waidmann T. Trends in late-life activity limitations in the United States: An update from five national surveys. Demography. 2013;50:661–71. doi: 10.1007/s13524-012-0167-z. [DOI] [PMC free article] [PubMed] [Google Scholar]
- Freedman VA, Martin LG. The role of education in explaining and forecasting trends in functional limitations among older Americans. Demography. 1999;36:461–73. doi: 10.2307/2648084. [DOI] [PubMed] [Google Scholar]
- Freedman VA, Martin LG, Schoeni RF. Recent trends in disability and functioning among older adults in the United States: A systematic review. Journal of the American Medical Association. 2002;288:3137–46. doi: 10.1001/jama.288.24.3137. [DOI] [PubMed] [Google Scholar]
- Fried TR, Bradley EH, Williams CS, Tinetti ME. Functional disability and health care expenditures for older persons. Archives of Internal Medicine. 2001;161:2602–07. doi: 10.1001/archinte.161.21.2602. [DOI] [PubMed] [Google Scholar]
- Goesling B. The rising importance of education for health? Social Forces. 2007;85:1621–44. doi: 10.1353/sof.2007.0068. [DOI] [Google Scholar]
- Hung WW, Ross JS, Boockvar KS, Siu AL. Recent trends in chronic disease, impairment and disability among older adults in the United States. BMC Geriatrics. 2011;11:47. doi: 10.1186/1471-2318-11-47. [DOI] [PMC free article] [PubMed] [Google Scholar]
- Iezzoni LI, Kurtz SG, Rao SR. Trends in U.S. adult chronic disability rates over time. Disability and Health Journal. 2014;7:402–12. doi: 10.1016/j.dhjo.2014.05.007. [DOI] [PMC free article] [PubMed] [Google Scholar]
- Lokshin M. Semi-parametric difference-based estimation of partial linear regression models. Stata Journal. 2006;6:377–83. [Google Scholar]
- Manton KG, Gu X, Vicki LL. Change in chronic disability from 1982 to 2004/2005 as measured by long-term changes in function and health in the U.S. elderly population. Proceedings of the National Academy of Sciences. 2006;103:18374–79. doi: 10.1073/pnas.0608483103. [DOI] [PMC free article] [PubMed] [Google Scholar]
- Martin LG, Freedman VA, Schoeni RF, Andreski PM. Trends in disability and related chronic conditions among people ages fifty to sixty-four. Health Affairs. 2010;29:725–31. doi: 10.1377/hltthaff.2008.0746. [DOI] [PMC free article] [PubMed] [Google Scholar]
- Martin LG, Schoeni RF. Trends in disability and related chronic conditions among the forty-and-over population: 1997-2010. Disability and Health Journal. 2014;7:S4–S14. doi: 10.1016/j.dhjo.2013.06.007. [DOI] [PMC free article] [PubMed] [Google Scholar]
- Martin LG, Schoeni RF, Andreski PM. Trends in health of older adults in the United States: Past, present, future. Demography. 2010;47:S17–S40. doi: 10.1353/dfem.2010.0003. [DOI] [PMC free article] [PubMed] [Google Scholar]
- Martin LG, Schoeni RF, Freedman VA, Andreski P. Feeling better? Trends in general health status. Journals of Gerontology: Series B, Psychological and Social Science. 2007;62:S11–21. doi: 10.1093/geronb/62.1.S11. [DOI] [PubMed] [Google Scholar]
- Mirowsky J, Ross CE. Education and self-rated health: Cumulative advantage and its rising importance. Research on Aging. 2008;30:93–122. doi: 10.1177/0164027507309649. [DOI] [Google Scholar]
- Montez JK. The socioeconomic origins of physical functioning among older U.S. adults. Advances in Life Course Research. 2013;18:244–56. doi: 10.1016/j.alcr.2013.08.001. [DOI] [PubMed] [Google Scholar]
- Montez JK, Zajacova A. Explaining the widening education gap in mortality among U.S. white women. Journal of Health and Social Behavior. 2013a;54:166–82. doi: 10.1177/0022146513481230. [DOI] [PMC free article] [PubMed] [Google Scholar]
- Montez JK, Zajacova A. Trends in mortality risk by education level and cause of death among US white women from 1986 to 2006. American Journal of Public Health. 2013b;103:473–79. doi: 10.2105/AJPH.2012.301128. [DOI] [PMC free article] [PubMed] [Google Scholar]
- Schoeni RF, Freedman VA, Martin LG. Why is late-life disability declining? Milbank Quarterly. 2008;86:47–89. doi: 10.1111/j.1468-0009.2007.00513.x. [DOI] [PMC free article] [PubMed] [Google Scholar]
- Schoeni RF, Freedman VA, Wallace RB. Persistent, consistent, widespread, and robust? Another look at recent trends in old-age disability. Journals of Gerontology Series B: Psychological Sciences and Social Sciences. 2001;56:S206–S18. doi: 10.1093/geronb/56.4.S206. [DOI] [PubMed] [Google Scholar]
- Schoeni RF, Martin LG, Andreski PM, Freedman VA. Persistent and growing socioeconomic disparities in disability among the elderly: 1982-2002. American Journal of Public Health. 2005;95:2065–70. doi: 10.2105/AJPH.2004.048744. [DOI] [PMC free article] [PubMed] [Google Scholar]
- Seeman TE, Merkin SS, Crimmins EM, Karlamangla AS. Disability trends among older Americans: National health and nutrition examination surveys, 1988–1994 and 1999–2004. American Journal of Public Health. 2010;100:100–07. doi: 10.2105/AJPH.2008.157388. [DOI] [PMC free article] [PubMed] [Google Scholar]
- Tsai Y. Education and disability trends of older Americans, 2000–2014. Journal of Public Health. 2016 doi: 10.1093/pubmed/fdw082. [Epub ahead of print] [DOI] [PMC free article] [PubMed] [Google Scholar]
- Verbrugge LM. Recent, present, and future health of American adults. Annual Review of Public Health. 1989;10:333–61. doi: 10.1146/annurev.pu.10.050189.002001. [DOI] [PubMed] [Google Scholar]
- Verbrugge LM, Jette AM. The disablement process. Social Science & Medicine. 1994;38:1–14. doi: 10.1016/0277-9536(94)90294-1. [DOI] [PubMed] [Google Scholar]
- Verbrugge LM, Liu X. Midlife trends in activities and disability. Journal of Aging and Health. 2014;26:178–206. doi: 10.1177/0898264313508189. [DOI] [PubMed] [Google Scholar]
- Zajacova A, Everett BG. The nonequivalent health of high school equivalents. Social Science Quarterly. 2014;95:221–38. doi: 10.1111/ssqu.12039. [DOI] [PMC free article] [PubMed] [Google Scholar]


