Abstract
Gene expression analysis using microarrays of synthetic long oligonucleotides is limited in that it requires substantial amounts of RNA. To obtain these quantities from minute amounts of starting material, protocols were developed that linearly amplify mRNA by cDNA synthesis and in vitro transcription. Since orientation of the product is antisense (aRNA), it is inapplicable for dye-labelling by reverse transcription and hybridization to sense-oriented oligonucleotide arrays. Here, we introduce a novel protocol in which aRNA labelling is achieved by a combination of two reverse and one forward transcription reactions followed by dye-incorporation using Klenow fragment, generating fluorescent antisense cDNA. We demonstrate high fidelity in arrays using up to 105-fold amplification, starting from 2 ng total RNA. The generated data are highly reproducible and maintain relative gene expression levels between samples. These results demonstrate that our protocol describes an efficient and reliable technique to expand the applicability of oligonucleotide arrays to studies where RNA is the limited source material.
INTRODUCTION
A restricting aspect of any array-based expression profiling approach is the amount of RNA material needed for hybridization. cDNA arrays usually require at least 15 μg total RNA, and the preferred amount for spotted oligonucleotide arrays is increased to ∼50 μg, due to the decrease in possible base pairings. Hence, reliable transcriptome amplification is essential for many quantitative analytical approaches, such as RNA expression analysis of tumour biopsies (1), sorted cell populations (2), laser capture microdissected cells and tissues (3) or any other study based on small tissue samples or minute numbers of cells. Methods were developed that amplify initial poly(A) RNA and, thereby, increase detection sensitivity by orders of magnitude.
In principle, amplification can either be performed exponentially using PCR-based approaches (4–6), or in a linear fashion, mostly by the generation of cDNA followed by in vitro transcription with T7 RNA polymerase (7–10). However, the kinetics of PCR-based methods implies that both sequence-dependent and copy-number dependent bias will be amplified exponentially as well and accumulate. Another important issue is the influence of sampling errors when handling very limited amounts of RNA (11,12). For these reasons, exponential amplification protocols are generally considered less applicative for quantitative transcriptome analyses.
T7-based methods, on the other hand, are routinely used for the expression profiling studies in combination with cDNA microarrays, and several studies have demonstrated their reliability (9,10). Recently, large collections of long oligonucleotides (50–80 bases) have become increasingly popular as probes for spotted DNA arrays. Technical advantages of oligonucleotide arrays include a constant DNA concentration across all spots and biophysically optimized sequences, reducing secondary structures, avoiding repetitive sequences and providing a fixed range for both Tm and length. This accounts for more uniform, stable and predictable hybridization conditions. However, starting from cellular, sense-oriented mRNA, the orientation of T7-amplified RNA will be antisense (aRNA). Therefore, it cannot be used for reverse transcription labelling and hybridization to sense-oriented, gene-specific oligonucleotide libraries. Oligonucleotides of commercial libraries are sense-oriented to complement antisense targets produced by reverse transcription of unamplified RNA. Sense cDNA derived from aRNA is incompatible for hybridization to these sequences. Some approaches try to overcome this problem by producing labelled aRNA during in vitro transcription (13), but in our hands the yield of this procedure was insufficient.
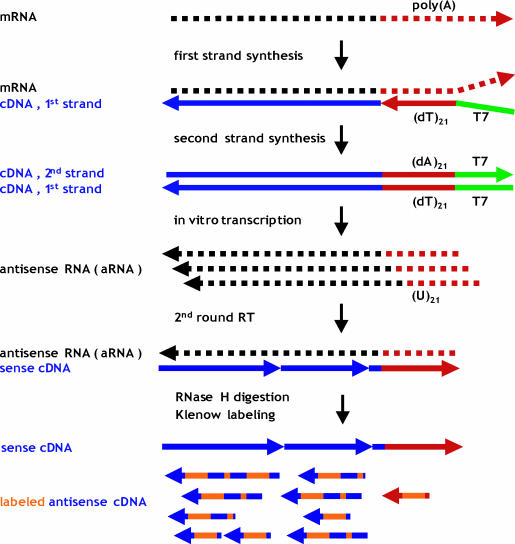
We developed and evaluated a new protocol that generates labelled antisense cDNA, termed Target Amplification and cDNA Klenow Labelling for Expression analysis (TAcKLE). TAcKLE utilizes mRNA amplification by in vitro transcription of cDNA, as first described by van Gelder et al. (7), and fluorescent labelling by Klenow fragment. Initial mRNA is copied by a RNase H− Moloney murine leukaemia virus reverse transcriptase (MMLV RT), using a modified oligo(dT)-primer to incorporate the promoter sequence of phage T7 RNA polymerase. RNase H treatment of the resulting heteroduplex creates RNA fragments that prime second-strand synthesis by Escherichia coli DNA polymerase I. Repeated transcription from the T7 promoter on the cDNA template results in multiple copies of aRNA, which may be reamplified as described previously (8). Finally, aRNA is reverse transcribed into sense cDNA and used as template for Klenow labelling, yielding mainly fluorescent antisense cDNA as a suitable target for oligonucleotide libraries in sense orientation (Figure 1).
Figure 1.
Schematic overview of the TAcKLE protocol. mRNA is linearly amplified by in vitro transcription (‘T7 amplification’). The resulting aRNA is subsequently converted to cDNA and labelled by dye-dUTP incorporation using Klenow fragment.
MATERIALS AND METHODS
RNA
High quality total RNA was purchased from Stratagene (Amsterdam, The Netherlands). Universal Human Reference RNA precipitate in ethanol was pelleted, washed in 70% (v/v) ethanol, air dried and dissolved in RNase-free water at 5 μg/μl, 500 ng/μl, 50 ng/μl, 5 ng/μl and 0.5 ng/μl. Human Adult Breast RNA was precipitated at −80°C for 30 min with 5 μg linear polyacrylamide (Ambion, Huntingdon, UK), 2.5 vol 100% (v/v) ethanol and 0.5 vol 7.5 M NH4OAc and subsequently processed as described for the Reference RNA. Integrity and purity of total RNA were assessed on a Bioanalyzer 2100 (Agilent Technologies, Boeblingen, Germany) using an RNA 6000 Nano LabChip Kit (Agilent) according to the manufacturer's instructions.
Target preparation
Preparation of labelled target cDNA for microarray hybridizations was performed according to either of the methods described below.
RT labelling
For the preparation of unamplified cDNA target, 40 μg of total RNA were heated for 4 min at 70°C in the presence of 2 μg oligo(dT21)VN in a total volume of 13.9 μl and chilled on ice. Labelling mixture was added, yielding final concentrations of 1× First-Strand Buffer (Invitrogen, Karlsruhe, Germany), 10 mM DTT (Invitrogen), 500 μM each of dATP, dGTP and dCTP, 200 μM dTTP (Amersham Biosciences, Freiburg, Germany), 100 μM Cy3- or Cy5-dUTP (Amersham Biosciences), 2 U/μl RNasin ribonuclease inhibitor (Promega, Mannheim, Germany) as well as 13.33 U/μl Superscript II reverse transcriptase (Invitrogen) in a total volume of 30 μl. Samples were incubated first at 25°C for 3 min and, thereafter, at 42°C for 2 h, with further 200 U Superscript II (200 U/μl) added after 1 h. Next, 15 μl 0.1 M NaOH, containing 2 mM EDTA, were added to stop the reaction. RNA was hydrolysed at 70°C for 20 min. Finally, the pH was neutralized by the addition of 15 μl 0.1 M HCl.
TAcKLE
For amplification and labelling using the TAcKLE protocol, 2000, 200, 20 or 2 ng total RNA were employed in the first- and second-strand cDNA synthesis as described previously (9), with minor modifications. Briefly, RNA was mixed with 100 ng (dT)-T7 primer [5′-GCATTAGCGGCCGCGAAATTAATACGACTCACTATAGGGAGA(T)21VN-3′] to a final volume of 5 μl, denatured 4 min at 70°C and chilled on ice. Aliquots containing 5 μl ice-cold RT mixture were added to the samples, yielding final concentrations of 1× First-Strand Buffer (Invitrogen), 10 mM DTT (Invitrogen), 500 μM of each dNTP (Amersham Biosciences), 400 ng/μl T4gp32 (USB, Cleveland), 2 U/μl RNasin ribonuclease inhibitor (Promega) as well as 10 U/μl Superscript II reverse transcriptase (Invitrogen). Reverse transcription was performed for 1 h at 50°C and reactions were stopped by heating to 65°C for 15 min. Following the addition of 65 μl ice-cold reaction mixture, second-strand synthesis was performed for 2 h at 15°C in 1× Second-Strand buffer (Invitrogen), 200 μM of each dNTP (Amersham Biosciences), 0.27 U/μl DNA polymerase I (Promega), 1 U RNase H (Epicentre, Madison) and 5 U E.coli DNA ligase (USB). Then, 10 U T4 DNA polymerase (3.33 U/μl; New England Biolabs, Frankfurt a.M., Germany) were added to the samples, and cDNA ends were polished for 15 min at 15°C. Enzymes were heat inactivated by 10 min incubation at 70°C. To extract double-stranded cDNA, samples were mixed with 75 μl phenol/chloroform/isoamylalcohol (pH 8.0; Sigma–Aldrich, Munich, Germany) and transferred to prespun 0.5 ml PLG heavy tubes (Eppendorf, Hamburg, Germany). After 5 min centrifugation at 13 000 r.p.m., the aqueous phase was further purified on a P-6 Micro BioSpin column (Bio-Rad, Munich, Germany) according to the manufacturer's instructions, followed by ethanol precipitation. The cDNA was dissolved in 10 μl nuclease-free water and employed in an in vitro transcription reaction using a RiboMAX Large Scale RNA Production System T7 (Promega) according to the manufacturer's recommendations, but in 40 μl reaction volume and regularly mixing the samples every 30 min for 6 h. Following purification on RNeasy Mini filters (Qiagen, Hilden, Germany) and ethanol precipitation, aRNA was dissolved in nuclease-free water, preferentially at 0.25 μg/μl.
Second round RT was performed on 1 μg aRNA (where available) as described above, but with the following modifications: 0.5 μg random hexamer primer (Roche Diagnostics, Mannheim, Germany) was used instead of (dT)-T7 primer. Samples were incubated 5 min at room temperature before the addition of RT mixture to allow for annealing of N6-primer. The following temperature profile was employed for reverse transcription: 20 min at 37°C, 20 min at 42°C, 10 min at 50°C, 10 min at 55°C and 15 min at 65°C. RNase H digestion (1 U per reaction) was carried out for 30 min at 37°C, followed by 2 min at 95°C to degrade enzymes.
When starting with 20 ng total RNA or less, two rounds of amplification were performed. For this purpose, purified aRNA samples were precipitated, dissolved in 4 μl nuclease-free water and subjected to second round reverse transcription as described above. First-strand cDNA was mixed with 100 ng (dT)-T7 primer in a final volume of 11 μl, incubated 10 min at 42°C and chilled on ice. Thereafter, second-strand synthesis, cDNA purification, in vitro transcription, aRNA clean-up and third round reverse transcription (primed with random hexamers) were performed as described above.
cDNA labelling by Klenow fragment was performed using the Bioprime Kit (Invitrogen), but with a modified protocol. Briefly, 10 μl cDNA sample were mixed with 90 μl Klenow mixture to yield a reaction mixture that contained 1× random primer solution (Invitrogen), 200 μM each of dATP, dCTP and dGTP, 50 μM dTTP (Amersham Biosciences), 30 μM Cy3- or Cy5-dUTP (Amersham Biosciences) and 1.0 U/μl Klenow fragment (Invitrogen). DNA polymerization was carried out at 37°C for 16 h.
Preparation and post-processing of microarrays
Synthetic 70mer oligonucleotides (‘Human Genome Oligo Set Version 2.1’; consisting of 21 329 oligonucleotides representing human genes and transcripts plus 24 controls, as well as ‘Human Genome Oligo Set Version 2.1 Upgrade’, consisting of 5462 human 70mer probes) were purchased from Operon Technologies (Cologne, Germany) and dissolved in FBNC spotting buffer (14) (formamide, betaine and nitrocellulose) at 40 μM, using a MiniTrak robotic liquid handling system (PerkinElmer, Rodgau-Juegesheim, Germany). DNA spotting was performed in duplicates on QMT epoxysilane coated slides (Quantifoil Micro Tools, Jena, Germany) using an OmniGrid Microarrayer (GeneMachines, San Carlos) equipped with Stealth SMP3 Micro Spotting Pins (Telechem, Sunnyvale). Spot centres were 129 μm apart. DNA adhesion to the glass surface was accomplished by 1 h incubation at 60°C, followed by ultraviolet (UV) irradiation (2 × 120 mJ/cm2 at 254 nm) in a Stratalinker Model 2400 UV illuminator (Stratagene). Just prior to hybridization, slides were washed for 2 min in 0.2% SDS (w/v), 2 min in ddH2O at room temperature and 2 min in boiling ddH2O (95°C), followed by 3 min centrifugation at 2000 r.p.m.
Microarray hybridization
Following completion of the labelling reactions, corresponding cDNA samples were combined and purified on Microcon YM-30 filter columns (Millipore, Eschborn, Germany), as described previously (15). For blocking of repetitive sequence elements, 25 μg C0t-1 DNA (Roche Diagnostics), 25 μg poly(A) RNA (Sigma) and 75 μg yeast tRNA (Sigma) were added before the final washing step. Purified, dye-labelled cDNA was mixed with 120 μl UltraHyb hybridization buffer (Ambion), agitated for 30–60 min at 60°C, then for 10 min at 70°C on a thermo mixer and subsequently applied to pre-heated (60°C) microarrays mounted in a GeneTAC Hybridization Station (Genomic Solutions, Ann Arbor). Hybridizations were performed for 16 h at 42°C with gentle agitation. Thereafter, the arrays were automatically washed at 36°C with (i) 0.5× SSC, 0.1% (w/v) SDS for 5 min; (ii) 0.05× SSC, 0.1% (w/v) SDS for 3 min; and (iii) 0.05× SSC for 2 min. Flow time was set to 40 s. Immediately after the completion of the final washing step, the arrays were unmounted, immersed in 0.05× SSC, 0.1% (w/v) Tween 20 and dried by centrifugation in 50 ml Falcon tubes (30 s at 500, 1000 and 1500 r.p.m., respectively, followed by a final step of 90 s at 2000 r.p.m.).
Data acquisition, processing and analysis
Hybridized microarrays were scanned at 5 μm resolution and variable PMT voltage to obtain maximal signal intensities with <0.1% probe saturation, a count ratio of 0.8–1.2 (Cy5/Cy3) and maximal congruence of histogram curves, using a GenePix 4000B microarray scanner (Axon Instruments, Union City). Subsequent image analysis was performed with the corresponding software GenePix Pro 5.0. Spots not recognized by the software were excluded from further considerations. Result files containing all relevant scan data were further processed using the statistical programming language R (http://www.r-project.org) (16) together with packages of the Bioconductor project (http://www.bioconductor.org) (16). For each hybridization, raw fluorescence intensities were normalized applying variance stabilization (17). To eliminate low quality data, the data points were ranked according to spot homogeneity, as assayed by the ratio of median to mean fluorescence intensity, the ratio of spot to local background intensity and the standard deviation of the logarithmic ratios (log2 Cy5/Cy3) between spot replicates. Those data points ranked among the lower 20% were removed from the data set. Genes that could not be quantified in more than 33% of all experiments after filtering were excluded as well. To combine the data of dye swap experiments, the log2-transformed intensity ratios of one array were inverted and averaged with the corresponding values of the other array. To investigate the linear relationship between data points in Figures 2–4, regression lines were determined by minimizing the sum of squares of the Euclidean distance of points to the fitted line (‘orthogonal regression’), as there is no clear assignment of dependent and independent variables. Correlations were estimated using the Pearson correlation coefficient together with its 95% confidence interval. To compare log2 ratios obtained by TAcKLE amplifications of 2000, 200, 20 and 2 ng starting material with those obtained by RT labelling, a linear model with RT labelling as reference was fitted separately for each gene. P-values were calculated using Wald statistics. This analysis was performed for all spots with quantified log2 ratios in at least 9 of the 10 arrays remaining after the exclusion of self–self and dye swap hybridizations (see Table 1); hence, the Wald statistics were checked for significance using a t-distribution with 4 or 5 degrees of freedom, respectively. An optional filtering procedure additionally excluded those data points considered unreliable (18,19) as they correspond to probe sets associated with low signal intensities less than two standard deviations above local background. The magnitude of the effects and the corresponding P-values are illustrated as volcano plots (20).
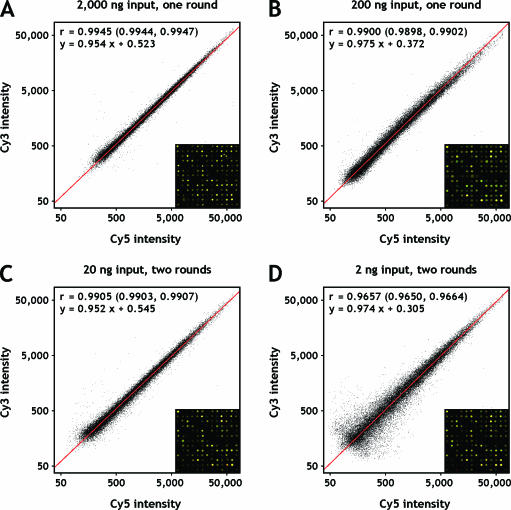
Figure 2.
Scatter plots of fluorescence intensities from replicate amplification and labelling reactions. Co-hybridizations of independently amplified reference RNA were used to assess the reproducibility of amplification under diverse conditions. (A) 2000 ng; (B) 200 ng; (C) 20 ng; (D) 2 ng starting material. Orthogonal regression lines are shown in red; the corresponding linear equations are given together with Pearson correlation coefficients and their 95% confidence intervals. A defined section of the respective microarray image is displayed in the lower right corner of each plot.
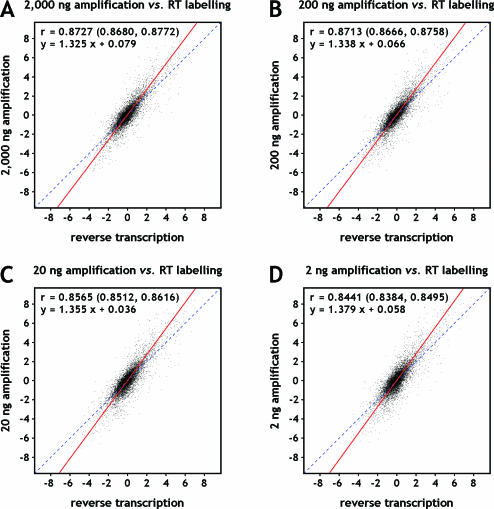
Figure 4.
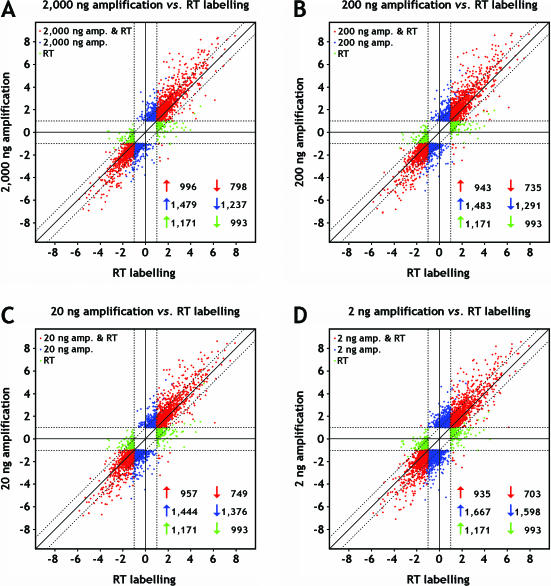
Scatter plots comparing log2-transformed expression ratios of amplified targets to ratios obtained with unamplified targets. Breast and reference RNA was used as starting material. Dye swap experiments were combined before plotting. Target amplified (TAcKLE) from (A) 2000 ng, (B) 200 ng, (C) 20 ng and (D) 2 ng starting material was compared with unamplified target prepared by reverse transcription labelling. Orthogonal regression analysis was preformed to derive the regression lines shown in red and their respective linear equations. Dashed lines through origin with slope 1 are displayed to accentuate the elevated slope. Pearson correlation coefficients and their associated 95% confidence intervals are listed as well.
Table 1.
Experimental design (n denotes the number of arrays)
| Group | Labelling method | Input/channel | Breast versus Ref. (n) | Ref. versus Breast (n) | Ref. versus Ref. (n) |
|---|---|---|---|---|---|
| 1 | TAcKLE | 2 ng | 2 | 1 | 1 |
| 2 | TAcKLE | 20 ng | 2 | 1 | 1 |
| 3 | TAcKLE | 200 ng | 2 | 1 | 1 |
| 4 | TAcKLE | 2000 ng | 2 | 1 | 1 |
| 5 | RT | 40 μg | 2 | 1 | 1 |
Accession numbers
All relevant data from this study are available from GEO (http://www.ncbi.nlm.nih.gov/geo) under the accession numbers GPL1384 (for the array platform), GSM27816–GSM27819, GSM27835, GSM27836 and GSM27915–GSM27928 (for expression data from individual arrays) as well as GSE1645 (for the experimental series).
RESULTS
Experimental design
A single source of reference (pooled from 10 human cell lines representing distinct tissues) and breast total RNA was used for all experiments to avoid variations in transcript abundance imposed by the RNA preparation. Each RNA pool was serially diluted to provide four distinct starting quantities equivalent to 2, 20, 200 and 2000 ng. In total, 20 two-colour hybridizations were performed, comprising 1 co-hybridization of reference RNA, 2 hybridizations of breast RNA versus reference RNA (Cy5/Cy3) and 1 hybridization of reference RNA versus breast RNA (dye swap), both for TAcKLE amplifications of all four amounts of input material and for reverse transcription labelling (Table 1). All dye-labelling reactions using Klenow fragment were made from separately amplified RNA aliquots. One round of linear RNA amplification resulted in ∼103-fold amplification of starting mRNA, and two rounds yielded 105-fold the starting amount. Labelled cDNAs were hybridized to microarrays containing 26 791 gene-specific 70mer oligonucleotide probes, each spotted in duplicate.
Reproducibility of amplification
A first assessment of random bias introduced by the amplification and labelling procedure was made by hybridizations of differentially labelled targets, independently prepared from the same dilutions of reference RNA. The Pearson correlation coefficient of fluorescence intensities (Figure 2) was high for all tested amounts of input RNA (r = 0.9945, r = 0.9900, r = 0.9905 and r = 0.9657 for 2000, 200, 20 and 2 ng starting material, respectively) and in good agreement with previously reported values for T7-based amplification protocols (9,10). This reflects a reliable amplification and consistent labelling with both Cy5- and Cy3-dUTPs. There is an increased scattering of low intensity data points for 2 ng of starting material, which might be attributed to sampling errors (11,12) (i.e. errors resulting from the stochastic distribution of low-copy-number templates) and represents a restricting aspect when depending on very strong amplifications. Yet, the reproducibility of the amplification is equivalent or even superior when compared with target preparation by reverse transcription (r = 0.989; data not shown).
Reproducibility of expression ratios with and without dye swap
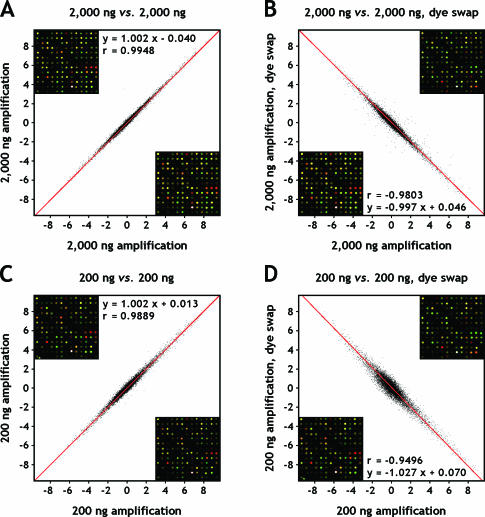
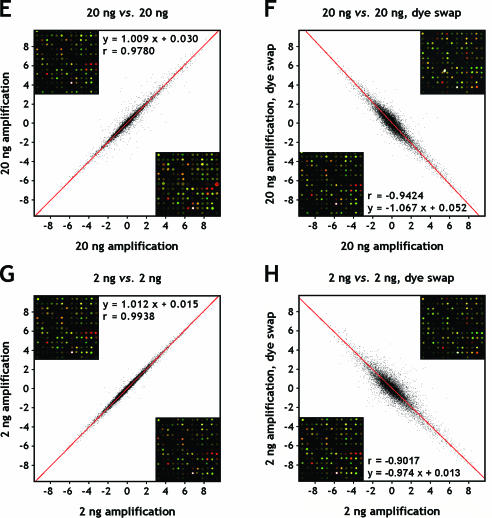
To determine the effect of our amplification procedure on the reproducibility of expression ratios, we compared hybridizations of targets derived from human reference RNA and RNA extracted from normal human breast tissue. The Pearson correlations of log2-transformed normalized expression ratios were r = 0.9948, r = 0.9889, r = 0.9780 and r = 0.9938 for identically repeated hybridizations as well as r = −0.9803, r = −0.9496, r = −0.9424 and r = −0.9017 for hybridizations repeated with inverse assignment of fluorophores (dye swap), starting from 2000, 200, 20 and 2 ng RNA material, respectively (Figure 3). Apparently, the concordance of expression ratios is stable and independent of the amount of input RNA for identically repeated experiments, but decreases considerably in the case of dye swap repeats as the amount of starting material is reduced. This might reflect differences in dye incorporation between Cy3- and Cy-5 labelled dUTP, a known bias previously reported for fluorescent cDNA prepared by reverse transcription labelling (21). The respective correlations for these unamplified targets were r = 0.983 and r = −0.873.
Figure 3.
Scatter plots of log2-transformed expression ratios (log2 Cy5/Cy3) from duplicate hybridizations. Amplified breast and reference RNA, with and without reversed assignment of fluorophores (dye swap) was employed to evaluate the accuracy and reproducibility of the experiment. Replicate spots were averaged. (A) 2000 ng; (B) 2000 ng, dye swap; (C) 200 ng; (D) 200 ng, dye swap; (E) 20 ng; (F) 20 ng, dye swap; (G) 2 ng; (H) 2 ng, dye swap. The data were subjected to orthogonal regression analysis (red lines), and associated linear equations are listed along with Pearson correlation coefficients. The 95% confidence intervals of the correlation coefficients are (0.9946, 0.9950), (−0.9809, −0.9796), (0.9885, 0.9892), (−0.9513, −0.9478), (0.9772, 0.9788), (−0.9444, −0.9404), (0.9936, 0.9940) and (−0.9050, −0.8983) for (A) through (H). Underlying microarray images are shown as fixed sections in an upper (ordinate) and lower (abscissa) corner of each plot.
Comparison of amplified and unamplified targets
The main practical application of microarray analysis is the identification of transcripts whose abundance differs between samples. To test the fidelity of target amplification, we determined the ratios of amplified breast cDNA versus amplified universal reference cDNA hybridizations, and examined how these correlated with the corresponding ratios obtained with unamplified targets. This analysis was used to test whether amplified targets would identify the same set of differentially expressed transcripts recognizable with unamplified targets. Not unexpectedly, Pearson correlations of the corresponding log2 ratios (r = 0.8727, r = 0.8713, r = 0.8565 and r = 0.8441 for the comparison of RT labelling with amplifications of 2000, 200, 20 and 2 ng starting material) were not as high as for the comparison of repeated experiments (Figure 4). The scattering of corresponding values increases towards higher absolute log2 ratios. Additionally, we observed an increase in the slope of the regression lines (m = 1.325, m = 1.338, m = 1.355 and m = 1.379; same order as above), demonstrating a common deviance in the absolute log2 ratios. On average, absolute ratios obtained with amplified targets were higher than those corresponding to the unamplified samples, prepared by reverse transcription labelling.
Linear modelling and statistical analysis
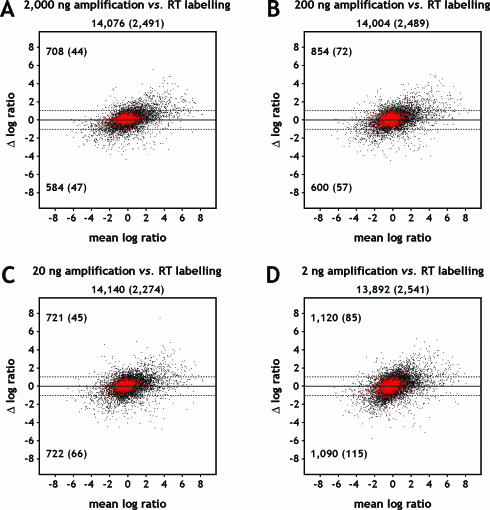
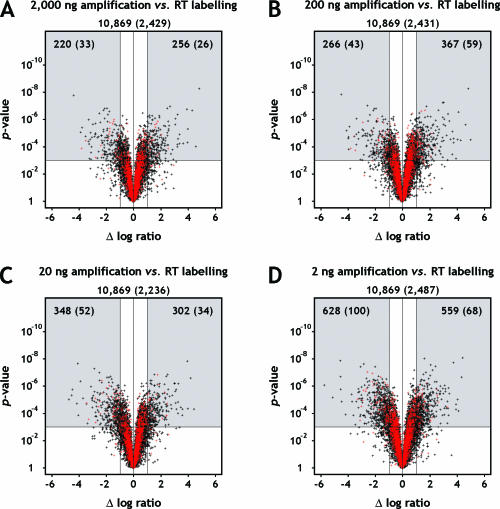
To determine whether the target amplification affected our ability to reliably profile gene transcription in the breast tissue, we analysed the relationship of the observed differences of log2 ratios between amplified versus unamplified targets and the degree of differential expression. We found 1479, 1483, 1444 and 1667 genes to be up-regulated, and 1237, 1291, 1376 and 1598 genes to be down-regulated in samples TAcKLE-amplified from 2000, 200, 20 and 2 ng RNA of healthy human breast tissue when compared with universal human reference RNA. A total of 1171 and 993 genes were identified as up- or down-regulated by reverse transcription labelling, respectively. Apparently, and in agreement with previous reports, target amplification yielded a slightly larger number of differentially expressed genes (22,23). The distribution of log2 ratios for the genes detected as differentially expressed in amplified and/or unamplified targets is depicted in Figure 5, which shows that a substantial number of those genes found by merely one method were close to reaching the threshold for differential expression (2-fold difference) with the other method as well. This observation is strengthened in Figure 6, where of the genes common to the data sets under comparison, only very few displayed a deviation of log2 ratios >1 or <−1 (44 and 47, 72 and 57, 45 and 66, and 85 and 115 genes, respectively, for the comparison of dye-labelling by reverse transcription with TAcKLE amplifications using 2000, 200, 20 and 2 ng starting material). Additionally, we applied a linear model to assign P-values to these differences. The results are displayed as volcano plots (20,24) of P-value against log2 ratio difference (Figure 7). Supporting the findings of Figure 6, similarly small numbers of genes (26 and 33, 59 and 43, 34 and 52, and 68 and 100) showed a significant (P < 0.001) difference of log2-transformed ratios when comparing across the target preparation techniques. In Figure 6, the intersection of the ‘outliers’ from all amounts of starting material contains 275 genes for the unfiltered data sets and is empty for the filtered data sets. For Figure 7, the respective numbers of genes are 246 for the unfiltered data sets and 18 for the filtered data sets. No more than 1–4% of the considered probes were affected by a ≥2-fold difference. Accordingly, there is strong concordance between expression ratios obtained with amplified and unamplified targets.
Figure 5.
Scatter plots showing log2 ratios of the genes detected as differentially expressed between breast and reference RNA by either one or both target preparation techniques (reverse transcription labelling and amplification via the TAcKLE protocol). Data are shown for the comparisons of RT labelling versus targets prepared from (A) 2000 ng, (B) 200 ng, (C) 20 ng and (D) 2 ng starting material. Genes showing differential expression with both methods are shown as red dots, while blue and green dots denote genes only found by amplification or RT labelling, respectively. The numbers of genes found up- or down-regulated with either one or both methods are given in the lower right corners of the plots.
Figure 6.
Mean difference (MA) plots displaying the difference of log2 ratios against the mean of log2 ratios. M is a measure for the difference of log2 ratios observed between amplified and unamplified targets, prepared from breast and universal human reference RNA (log2 [breast/reference]TAcKLE − log2 [breast/reference]RT). A is a measure for the average differential expression (1/2 [log2 [breast/reference]TAcKLE + log2 [breast/reference]RT]). Ratios of targets amplified from (A) 2000 ng, (B) 200 ng, (C) 20 ng and (D) 2 ng starting material were compared with ratios of unamplified targets. Replicated experiments were averaged before calculating the differences and means of log2 ratios. Black dots correspond to probes detected on at least one array of each considered target preparation approach, probes shown as red dots additionally reached fluorescence intensities at least two standard deviations above local background. The respective quantities are specified underneath the panel headings, values for red dots given in parentheses. Values in the upper and lower left corners of each plot indicate genes that show at least a 2-fold change of expression ratios to either direction, as illustrated by horizontal dashed lines.
Figure 7.
Volcano plots of P-values against the difference of log2-transformed expression ratios. The difference of log2 ratios observed between amplified and unamplified targets (log2 [breast/reference]TAcKLE − log2 [breast/reference]RT) is shown on the x-axis. The corresponding P-value of significance, derived by linear modelling, is shown on the y-axis. Ratios of targets amplified from (A) 2000 ng, (B) 200 ng, (C) 20 ng and (D) 2 ng starting material were compared with ratios of unamplified targets. Black dots correspond to probes detected on all or all but one arrays of all target preparation approaches, red dots indicate probes which additionally reached fluorescence intensities at least two standard deviations above local background on the arrays under consideration. The associated numbers of genes are given underneath the panel headings, values for red dots printed in parentheses. The plots were segmented to illustrate the relation of statistical significance (P < 0.001) to significance based on a 2-fold change criterion. Only genes indicated by spots in the upper left and right segments of the plots satisfy both criteria, their numbers explicitly shown. Genes located in the lower left and right segments display a large fold-change difference between amplified and unamplified targets but fail to achieve statistical significance. Genes found in the middle segments show no relevant difference of expression ratios, with (upper segments) or without (lower segments) additional statistical significance associated with this observation.
DISCUSSION
RNA amplification by in vitro transcription has been applied for microarray studies of differential gene expression for several years. This technique yields up to 105-fold linear amplification of high quality aRNA starting from nanogram quantities of total RNA (9). In this study, a newly developed protocol broadens the utility of this approach to the application with spotted oligonucleotide microarrays and, thus, expands the utilization of these microarrays to the analysis of rare cell populations. These could be derived by fine-needle aspiration or microdissection of clinical specimens, by cell sorting or micromanipulation of single cells. Utilizing elements of the approved Eberwine procedure (7,8), the TAcKLE protocol can easily be implemented, and even aRNA, produced for other applications, can be made accessible for oligonucleotide arrays by adding another reverse transcription and labelling step.
The amplification itself does not increase the overall variability above that encountered during cDNA synthesis. This is clearly demonstrated by the co-hybridization of material independently amplified from the same source. The reproducibility of a single round and even two rounds of amplification, estimated by the correlation coefficient, is comparable or even superior with that obtained with unamplified targets and possibly more biased by the variability of the chip hybridization and readout procedure than by the enzymatic manipulations.
The strong strand displacement activity of Klenow fragment, combined with random priming of DNA polymerization, adds a further level of amplification (25,26) and, thereby, decreases the amount of RNA necessary for labelling, facilitating the conduction of additional experiments even with marginal amounts of starting material. We estimated this amplification to be ∼5-fold in our case by spectrophotometrically measuring the amount of cDNA subsequent to the labelling reaction. This value seems reasonable since we can use as little as 1 μg Klenow-labelled material (500 ng still work fine) for hybridization, whereas protocols using labelled aRNA or RT-labelled cDNA require as much as 3–6 μg. Additionally, Klenow fragment is known to have a superior efficiency with modified nucleotides compared with any known RT.
Our data demonstrate that the ability to reproducibly identify differentially expressed genes after amplification is retained compared with conventional labelling by reverse transcription. This is true even when using as little starting material as 2 ng total RNA. We detect some differences between transcription profiles generated from 2000 and 2 ng of total RNA, probably due to additional bias introduced by a second round of amplification, which includes a randomly primed RT reaction. But even after two rounds of amplification, reproducibility is sufficiently high for reliable quantification of differences between samples. Furthermore, and equally important, there is no compression of differences between RNA samples with either one or two rounds of amplification. In contrast, there is a systematic and reproducible expansion of expression ratios in amplified targets. A possible explanation is differences in RT efficiency, depending on the template concentration.
Our analyses also indicate that reverse transcription labelling represents a significant source of variation between identical RNA samples and reaffirm the need for dye swap replicates. A part of the deviating ratios detected when comparing amplified and unamplified targets can probably be attributed rather to the inaccuracy of reverse transcription labelling than to systematic bias or random errors of the amplification procedure.
A different approach to overcome the problem of strand orientation is the addition of fluorescent nucleotide derivatives to the in vitro transcription reaction. Barczak et al. (19) reported decreased signal intensities of fluorescent aRNA targets, compared with cDNA prepared by reverse transcription labelling. We could confirm this effect (data not shown). Apparently, RNA polymerase is not a favourable enzyme for the incorporation of dye-labelled nucleotides. As it clearly discriminates bulky nucleotide modifications, ratios of labelled to unlabelled nucleotides have to be optimized. It has been reported that the addition of dimethyl sulfoxide during in vitro transcription can improve incorporation rates (13), and that utilization of aminoallyl-dUTP, followed by chemical coupling of reactive dye derivatives, may overcome some of the problems connected to the bulky nature of dye-labelled nucleotides. Yet, there is no additional amplification by the labelling procedure. Another recent study (27) exploits the template-switching effect (28) of MMLV RT to incorporate an RNA polymerase promoter sequence upstream of the generated cDNA, producing sense-oriented RNA by subsequent in vitro transcription. In a similar approach, the method of terminal continuation has been used to generate amplified transcripts with either sense or antisense orientation (29).
Commercial solutions utilize novel signal amplification and/or detection procedures, as in the Qiagen HiLight Platform (http://www1.qiagen.com/Products/MicroArrayAnalysis/MicroArrayAnalysisSystems.aspx), which uses resonance light scattering, a technology based on the optical light scattering properties of nano-sized metal colloidal particles (30). The system requires 1–2 μg total RNA and generates biotinylated and/or fluorescein-labelled target cDNA, which can be hybridized to commercial or custom made arrays. Gold particles, coated with anti-biotin antibodies, and/or silver particles, coated with anti-fluorescein antibodies, are used to stain the targets after hybridization. Detection is performed on a specialized reader. The SensiChip System developed by Qiagen and Zeptosens AG (http://www.zeptosens.com) uses planar waveguide technology (31,32) and requires a minimum of 1 μg total RNA. Hybridizations are carried out on 70mer oligonucleotide arrays of a special format using the SensiChip HybStation. Future studies will show whether comparable results can be achieved with these alternative approaches.
In conclusion, we showed that TAcKLE can faithfully amplify and label as little as 2 ng of total RNA, an amount which can be obtained from a few hundred cells. It represents a robust method for the sensitive detection of expression profiles, which is particularly suited for the use with microarrays consisting of long sense-oriented oligonucleotides, which are currently gaining popularity.
Acknowledgments
We thank Axel Benner for helpful discussions and critical reading of the manuscript. Gunnar Wrobel and Felix Kokocinski are gratefully acknowledged for reliable and continuous IT support and management of the microarray database. Our study was supported by grants of the Bundesministerium für Bildung und Forschung (FKZ 01 KW 9937; NGFN, 01 GR 0101) as well as the EU MolTools project (LSHG-CT-2004-503155). Funding to pay the Open Access publication charges for this article was provided by German Cancer Research Center.
REFERENCES
- 1.Ellis M., Davis N., Coop A., Liu M., Schumaker L., Lee R.Y., Srikanchana R., Russell C.G., Singh B., Miller W.R., et al. Development and validation of a method for using breast core needle biopsies for gene expression microarray analyses. Clin. Cancer Res. 2002;8:1155–1166. [PubMed] [Google Scholar]
- 2.St Croix B., Rago C., Velculescu V., Traverso G., Romans K.E., Montgomery E., Lal A., Riggins G.J., Lengauer C., Vogelstein B., et al. Genes expressed in human tumor endothelium. Science. 2000;289:1197–1202. doi: 10.1126/science.289.5482.1197. [DOI] [PubMed] [Google Scholar]
- 3.Luzzi V., Mahadevappa M., Raja R., Warrington J.A., Watson M.A. Accurate and reproducible gene expression profiles from laser capture microdissection, transcript amplification, and high density oligonucleotide microarray analysis. J. Mol. Diagn. 2003;5:9–14. doi: 10.1016/S1525-1578(10)60445-X. [DOI] [PMC free article] [PubMed] [Google Scholar]
- 4.Klein C.A., Seidl S., Petat-Dutter K., Offner S., Geigl J.B., Schmidt-Kittler O., Wendler N., Passlick B., Huber R.M., Schlimok G., et al. Combined transcriptome and genome analysis of single micrometastatic cells. Nat. Biotechnol. 2002;20:387–392. doi: 10.1038/nbt0402-387. [DOI] [PubMed] [Google Scholar]
- 5.Makrigiorgos G.M., Chakrabarti S., Zhang Y., Kaur M., Price B.D. A PCR-based amplification method retaining the quantitative difference between two complex genomes. Nat. Biotechnol. 2002;20:936–939. doi: 10.1038/nbt724. [DOI] [PubMed] [Google Scholar]
- 6.Iscove N.N., Barbara M., Gu M., Gibson M., Modi C., Winegarden N. Representation is faithfully preserved in global cDNA amplified exponentially from sub-picogram quantities of mRNA. Nat. Biotechnol. 2002;20:940–943. doi: 10.1038/nbt729. [DOI] [PubMed] [Google Scholar]
- 7.Van Gelder R.N., von Zastrow M.E., Yool A., Dement W.C., Barchas J.D., Eberwine J.H. Amplified RNA synthesized from limited quantities of heterogeneous cDNA. Proc. Natl Acad. Sci. USA. 1990;87:1663–1667. doi: 10.1073/pnas.87.5.1663. [DOI] [PMC free article] [PubMed] [Google Scholar]
- 8.Eberwine J., Yeh H., Miyashiro K., Cao Y., Nair S., Finnell R., Zettel M., Coleman P. Analysis of gene expression in single live neurons. Proc. Natl Acad. Sci. USA. 1992;89:3010–3014. doi: 10.1073/pnas.89.7.3010. [DOI] [PMC free article] [PubMed] [Google Scholar]
- 9.Baugh L.R., Hill A.A., Brown E.L., Hunter C.P. Quantitative analysis of mRNA amplification by in vitro transcription. Nucleic Acids Res. 2001;29:e29. doi: 10.1093/nar/29.5.e29. [DOI] [PMC free article] [PubMed] [Google Scholar]
- 10.Wang E., Miller L.D., Ohnmacht G.A., Liu E.T., Marincola F.M. High-fidelity mRNA amplification for gene profiling. Nat. Biotechnol. 2000;18:457–459. doi: 10.1038/74546. [DOI] [PubMed] [Google Scholar]
- 11.Stenman J., Orpana A. Accuracy in amplification. Nat. Biotechnol. 2001;19:1011–1012. doi: 10.1038/nbt1101-1011b. [DOI] [PubMed] [Google Scholar]
- 12.Kenzelmann M., Klaren R., Hergenhahn M., Bonrouhi M., Grone H.J., Schmid W., Schutz G. High-accuracy amplification of nanogram total RNA amounts for gene profiling. Genomics. 2004;83:550–558. doi: 10.1016/j.ygeno.2003.09.026. [DOI] [PubMed] [Google Scholar]
- 13.'t Hoen P.A., de Kort F., van Ommen G.J., den Dunnen J.T. Fluorescent labelling of cRNA for microarray applications. Nucleic Acids Res. 2003;31:e20. doi: 10.1093/nar/gng020. [DOI] [PMC free article] [PubMed] [Google Scholar]
- 14.Wrobel G., Schlingemann J., Hummerich L., Kramer H., Lichter P., Hahn M. Optimization of high-density cDNA-microarray protocols by ‘design of experiments’. Nucleic Acids Res. 2003;31:e67. doi: 10.1093/nar/gng067. [DOI] [PMC free article] [PubMed] [Google Scholar]
- 15.Schena M., Shalon D., Heller R., Chai A., Brown P.O., Davis R.W. Parallel human genome analysis: microarray-based expression monitoring of 1000 genes. Proc. Natl Acad. Sci. USA. 1996;93:10614–10619. doi: 10.1073/pnas.93.20.10614. [DOI] [PMC free article] [PubMed] [Google Scholar]
- 16.R Development Core Team. 2004. R: A Language and Environment for Statistical Computing. R Foundation for Statistical Computing, Vienna, Austria, Vienna, Austria.
- 17.Huber W., Von Heydebreck A., Sultmann H., Poustka A., Vingron M. Variance stabilization applied to microarray data calibration and to the quantification of differential expression. Bioinformatics. 2002;18(Suppl. 1):S96–S104. doi: 10.1093/bioinformatics/18.suppl_1.s96. [DOI] [PubMed] [Google Scholar]
- 18.Yang M.C., Ruan Q.G., Yang J.J., Eckenrode S., Wu S., McIndoe R.A., She J.X. A statistical method for flagging weak spots improves normalization and ratio estimates in microarrays. Physiol. Genomics. 2001;7:45–53. doi: 10.1152/physiolgenomics.00020.2001. [DOI] [PubMed] [Google Scholar]
- 19.Barczak A., Rodriguez M.W., Hanspers K., Koth L.L., Tai Y.C., Bolstad B.M., Speed T.P., Erle D.J. Spotted long oligonucleotide arrays for human gene expression analysis. Genome Res. 2003;13:1775–1785. doi: 10.1101/gr.1048803. [DOI] [PMC free article] [PubMed] [Google Scholar]
- 20.Wolfinger R.D., Gibson G., Wolfinger E.D., Bennett L., Hamadeh H., Bushel P., Afshari C., Paules R.S. Assessing gene significance from cDNA microarray expression data via mixed models. J. Comput. Biol. 2001;8:625–637. doi: 10.1089/106652701753307520. [DOI] [PubMed] [Google Scholar]
- 21.Yang Y.H., Dudoit S., Luu P., Lin D.M., Peng V., Ngai J., Speed T.P. Normalization for cDNA microarray data: a robust composite method addressing single and multiple slide systematic variation. Nucleic Acids Res. 2002;30:e15. doi: 10.1093/nar/30.4.e15. [DOI] [PMC free article] [PubMed] [Google Scholar]
- 22.Polacek D.C., Passerini A.G., Shi C., Francesco N.M., Manduchi E., Grant G.R., Powell S., Bischof H., Winkler H., Stoeckert C.J., Jr, et al. Fidelity and enhanced sensitivity of differential transcription profiles following linear amplification of nanogram amounts of endothelial mRNA. Physiol. Genomics. 2003;13:147–156. doi: 10.1152/physiolgenomics.00173.2002. [DOI] [PubMed] [Google Scholar]
- 23.Feldman A.L., Costouros N.G., Wang E., Qian M., Marincola F.M., Alexander H.R., Libutti S.K. Advantages of mRNA amplification for microarray analysis. Biotechniques. 2002;33:906–912. doi: 10.2144/02334mt04. 914. [DOI] [PubMed] [Google Scholar]
- 24.Jin W., Riley R.M., Wolfinger R.D., White K.P., Passador-Gurgel G., Gibson G. The contributions of sex, genotype and age to transcriptional variance in Drosophila melanogaster. Nature Genet. 2001;29:389–395. doi: 10.1038/ng766. [DOI] [PubMed] [Google Scholar]
- 25.Walker G.T., Fraiser M.S., Schram J.L., Little M.C., Nadeau J.G., Malinowski D.P. Strand displacement amplification—an isothermal, in vitro DNA amplification technique. Nucleic Acids Res. 1992;20:1691–1696. doi: 10.1093/nar/20.7.1691. [DOI] [PMC free article] [PubMed] [Google Scholar]
- 26.Walker G.T., Little M.C., Nadeau J.G., Shank D.D. Isothermal in vitro amplification of DNA by a restriction enzyme/DNA polymerase system. Proc. Natl Acad. Sci. USA. 1992;89:392–396. doi: 10.1073/pnas.89.1.392. [DOI] [PMC free article] [PubMed] [Google Scholar]
- 27.Rajeevan M.S., Dimulescu I.M., Vernon S.D., Verma M., Unger E.R. Global amplification of sense RNA: a novel method to replicate and archive mRNA for gene expression analysis. Genomics. 2003;82:491–497. doi: 10.1016/s0888-7543(03)00115-0. [DOI] [PubMed] [Google Scholar]
- 28.Matz M., Shagin D., Bogdanova E., Britanova O., Lukyanov S., Diatchenko L., Chenchik A. Amplification of cDNA ends based on template-switching effect and step-out PCR. Nucleic Acids Res. 1999;27:1558–1560. doi: 10.1093/nar/27.6.1558. [DOI] [PMC free article] [PubMed] [Google Scholar]
- 29.Che S., Ginsberg S.D. Amplification of RNA transcripts using terminal continuation. Lab. Invest. 2004;84:131–137. doi: 10.1038/labinvest.3700005. [DOI] [PubMed] [Google Scholar]
- 30.Bao P., Frutos A.G., Greef C., Lahiri J., Muller U., Peterson T.C., Warden L., Xie X. High-sensitivity detection of DNA hybridization on microarrays using resonance light scattering. Anal. Chem. 2002;74:1792–1797. doi: 10.1021/ac0111964. [DOI] [PubMed] [Google Scholar]
- 31.Duveneck G.L., Abel A.P., Bopp M.A., Kresbach G.M., Ehrat M. Planar waveguides for ultra-high sensitivity of the analysis of nucleic acids. Anal. Chim. Acta. 2002;469:49–61. [Google Scholar]
- 32.Voeroes J., de Paul S.M., Textor M., Abel A.P., Kaufmann E., Ehrat M. Polymer cushions to analyze genes and proteins. BioWorld. 2003;4:16–17. [Google Scholar]


