Abstract
Although oligonucleotide probes complementary to single nucleotide substitutions are commonly used in microarray-based screens for genetic variation, little is known about the hybridization properties of probes complementary to small insertions and deletions. It is necessary to define the hybridization properties of these latter probes in order to improve the specificity and sensitivity of oligonucleotide microarray-based mutational analysis of disease-related genes. Here, we compare and contrast the hybridization properties of oligonucleotide microarrays consisting of 25mer probes complementary to all possible single nucleotide substitutions and insertions, and one and two base deletions in the 9168 bp coding region of the ATM (ataxia telangiectasia mutated) gene. Over 68 different dye-labeled single-stranded nucleic acid targets representing all ATM coding exons were applied to these microarrays. We assess hybridization specificity by comparing the relative hybridization signals from probes perfectly matched to ATM sequences to those containing mismatches. Probes complementary to two base substitutions displayed the highest average specificity followed by those complementary to single base substitutions, single base deletions and single base insertions. In all the cases, hybridization specificity was strongly influenced by sequence context and possible intra- and intermolecular probe and/or target structure. Furthermore, single nucleotide substitution probes displayed the most consistent hybridization specificity data followed by single base deletions, two base deletions and single nucleotide insertions. Overall, these studies provide valuable empirical data that can be used to more accurately model the hybridization properties of insertion and deletion probes and improve the design and interpretation of oligonucleotide microarray-based resequencing and mutational analysis.
INTRODUCTION
Oligonucleotide microarrays are a powerful technological platform for large-scale screens of common genetic variation and disease-causing mutations (1–5). In most published studies (6–21), oligonucleotide microarrays are designed to screen specific sequence tracts, up to megabases in length (11,15,22,23), for all possible single nucleotide substitutions. With some exceptions (24–31), the same emphasis was not placed on identifying all possible small insertions and deletions in the heterozygous state. Nevertheless, it is crucial to detect such small insertions and deletions since they can play a major role in inactivating or altering gene function by disrupting functional elements (e.g. splice junctions, cis-acting elements and open reading frames) and also represent another class of common genetic variation.
Two fundamental approaches are commonly used to analyze data sets from oligonucleotide microarrays tailored to identify genetic variation in specific DNA segments purely by hybridization (1,3–5,9). One approach involves identifying statistically significant gains of target hybridization signal to oligonucleotide probes complementary to specific sequence variants (9). In theory, the gain of signal approach has the advantage of both detecting the presence of genetic variation and identifying the nature of the sequence change in the target. However, it is not feasible to screen for virtually all possible insertions and deletions due to the overwhelming number of mutation-specific probes needed for this analysis. Furthermore, little effort has been made to systematically access the hybridization properties of probes complementary to these small insertions and deletions. The second approach involves identifying losses of hybridization signal to perfect match (PM) probes that are fully complementary to the DNA segment of interest (8,25,27,30,31). In theory, the loss of signal approach allows one to screen for all possible sequence changes, including insertions and deletions, that cause a given target nucleic acid sequence to contain mismatches with specific PM probes. However, this necessitates the sequencing of specific DNA regions to identify the nature of the sequence changes (8,25,27,30,31). Thus, a combination of the gain and loss of hybridization signal analysis could provide the most robust means of identifying and characterizing mutations using non-enzymatic oligonucleotide microarray assays.
Here, we analyze the specificity and reproducibility of nucleic acid hybridization to oligonucleotide microarrays used in the large-scale mutational analysis of the ATM (ataxia telangiectasia mutated) gene that is responsible for autosomal recessive disorder involving cerebellar degeneration, immunodeficiency, radiation sensitivity and cancer predisposition and is also commonly mutated in certain lymphoid malignancies (32,33). These microarrays include 25mer oligonucleotide probes complementary to all possible single base substitutions and insertions as well as one and two base deletions on both strands of the ATM coding region. This provides the first comparative analysis of the hybridization properties of substitution, insertion and deletion probes in an oligonucleotide microarray-based mutational analysis of a large gene.
MATERIALS AND METHODS
DNA sample selection
A series of 120 DNA samples derived from biopsies of lymphoma patients were previously screened for all possible ATM mutations using oligonucleotide microarrays (30). Here, we have selected a total of 68 samples that showed robust amplification signals in all 62 coding exons for further analysis (30). A total of 17 unique mutations, each in a one-to-one mixture with wild-type sequence, occurred once in these samples. The impact of any given mutation in a single sample is minimal given that 67 other samples with wild-type sequences in the region encompassing a given mutation are included in this analysis. Several single nucleotide polymorphisms (SNPs) were present multiple times: 735 C/T, 2572 T/C and 4258 C/T in two samples; 3161 C/G in four samples; and 5557 G/A in five samples. Likewise, these SNPs have a minimal effect on our global analyses given the large number of samples and bases interrogated in this study.
Target preparation
As previously described (30), individual ATM coding exons were amplified from genomic DNA using primers containing T3 and T7 RNA polymerase tails, pooled, and then in vitro transcribed using T3 or T7 RNA polymerase to create biotin-labeled sense and antisense strand targets, respectively. Fluorescein-labeled reference target was made using genomic DNA from an unaffected individual. Reference and test sample targets were fragmented, diluted in hybridization buffer [3 M TMA-Cl (tetramethylammonium chloride), 1× TE, pH 7.4, 0.001% Triton X-100] and hybridized to the ATM microarrays as described previously (30). Afterwards, the microarray was stained with a phycoerythrin–streptavidin conjugate and digitized hybridization images from both reference and test targets were acquired using the Gene Array Scanner (Hewlett Packard, Palo Alto, CA) equipped with the appropriate emission filters.
Data analysis
Custom software was used to quantify hybridization signals for each probe and subtract background hybridization signals. We exclusively focused on raw data from the biotin-labeled test targets since they provide approximately seven times the hybridization signal of the fluorescein-labeled wild-type reference target in this system (28). This enhanced signal provides greater sensitivity toward detecting weak hybridization.
For each sample, for each base and for each potential type of mutation (i.e. substitution, one or two base deletion or one base insertion), the specificity was calculated as the ratio of the PM probe hybridization signal of the wild-type target to their cognate insertion, deletion or single base substitution probes on each strand. The logarithm of these ratios was plotted as a function of the position within the gene. To illustrate the special patterns and to smooth out random variation, running averages of data from 10 bases were used. To capture the variability, at each base, the sample-to-sample standard deviation was again calculated using data derived from a running average of 10 bases for each sample.
To estimate the mean hybridization specificity for each type of mutation, the geometric mean (i.e. the antilog of the average of the logged ratios) over all bases and over all specimens was calculated (Table 1). To further examine the variability of the specificity ratios, the coefficient of variation (cv) was calculated in two ways. The cv is the ratio of the standard deviation divided by the mean; it is useful for understanding the amount of variability relative to the magnitude of the mean or typical value. For the intra-sample cv, the cv was calculated for each of the 68 samples (using the running average of 10 at each ATM base) and the average of the 68 coefficient of variations was taken. For the inter-sample cv, at each of the bases, the cv was calculated using the 68 samples, and the average of the coefficient of variations was taken. For both calculations, the moving average of 10 was used, instead of the original value, since the goal was to understand how the specificity varied over bases and across samples, rather than to estimate the experimental (or measurement) error.
Table 1.
Summary of hybridization specificities
| Strand | Probe type | Hybridization specificity ratiosa | Cvb | |
|---|---|---|---|---|
| Intra-sample | Inter-sample | |||
| Sense | Substitution | 2.79 | 0.31 | 0.05 |
| Deletion 1 | 1.97 | 0.37 | 0.14 | |
| Deletion 2 | 3.26 | 0.39 | 0.11 | |
| Insertion | 1.68 | 0.38 | 0.19 | |
| Anti-sense | Substitution | 3.29 | 0.23 | 0.05 |
| Deletion 1 | 2.33 | 0.26 | 0.12 | |
| Deletion 2 | 4.20 | 0.27 | 0.11 | |
| Insertion | 1.87 | 0.33 | 0.18 | |
aHybridization specificity ratio is defined as the ratio of PM probe hybridization signal to that of the brightest mismatch probe within a given category. The global average of all hybridization specificity ratios for each base in all samples for a given probe type is provided.
bDetermined for hybridization specificity ratios averaged across windows of 10 bases either within (intra) or across (inter) samples.
RESULTS AND DISCUSSION
Design of oligonucleotide probes
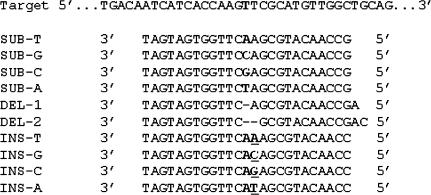
In order to determine the relative specificity of the hybridization of complex nucleic acid targets to oligonucleotide probes complementary to single base substitutions, insertions and deletions, we analyzed data generated from oligonucleotide microarray-based mutational analysis of the 9168 bp ATM coding region (30). These studies used a pair of oligonucleotide microarrays (Affymetrix, Santa Clara, CA) containing over 250 000 probes (25 nt in length) specifically designed to screen the sense and antisense strands of the ATM coding region for genetic variation (27,30). Collectively, the ATM sense and antisense microarrays contain 55 008 probes complementary to all possible single base substitutions, 73 344 probes complementary to all possible one base insertions, and 18 336 probes complementary to all possible one base deletions and 18 336 probes complementary to all possible two base deletions in the ATM coding sequence (Figures 1 and 2).
Figure 1.
Design of ATM oligonucleotide microarrays. Nucleotides 3237–3271 of the sense strand of the ATM coding region are depicted as target. Below are the four types of mismatch probes (substitution, one base deletion, two base deletion and one base insertion) evaluating the identity of nucleotide position 3255, highlighted in boldface. Note that all mismatch probes are 25mers and that the 13th position of the probe is the interrogation position. For one and two base deletion probes, one and two additional nucleotides are added to the 5′ end of the probes to preserve their length. For one base insertion probes, 1 nt is deleted from the 5′ end of the probes to preserve their length.
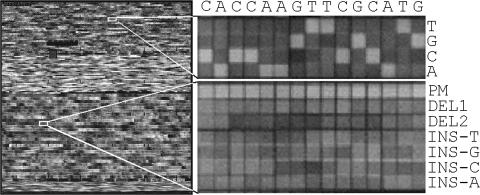
Figure 2.
Target image comparisons. Gray-scale raw images showing hybridization pattern of nucleic acid target to ATM sense microarray. The entire sense ATM microarray is shown on the leftmost side along magnified regions showing base substitution (top right) and insertion and deletion (bottom right) probes interrogating nucleotide positions 3247–3261 of the ATM gene. The identity of this sequence tract is provided above the base substitution probes. PM stands for perfect match probe.
These microarrays have been used to screen for sequence variation in the ATM gene in over 100 DNA samples (30). SNPs and gene inactivating mutations were uncovered by screening for localized losses of hybridization signal to PM probes complementary to every 25 nt segment of the ATM coding region (8,25,27,30). However, hybridization data from deletion and insertion probes were not relied upon in this analysis. Therefore, this data set provides a unique opportunity to examine the relative hybridization specificity of nucleic acid targets to each of these classes of mismatch probes.
Global hybridization properties of mutation-specific probes
In order to gain a global overview of hybridization specificity, we determined the average ratio of PM probe hybridization signal of wild-type target (see Materials and Methods) to their cognate insertion, deletion and single base substitution probes on each strand (Table 1). In these calculations, we considered data for all 9168 interrogated bases in all 68 DNA samples (see Materials and Methods). For example, we report the ratio of the PM probe signal to the signal from its cognate 1 or 2 bp deletion probe. However, for single base substitutions, we report the ratio of the PM probe signal to that of the cognate substitution probe with the highest hybridization signal. This provides the most rigorous assessment of cross-hybridization to single base substitution probes. Likewise, for single base insertion probes, we report the ratio of the PM probe signal to that of the cognate insertion probe with the highest hybridization signal.
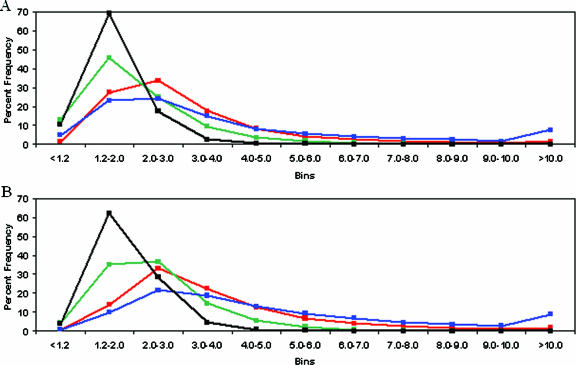
For both sense and antisense strands, we found that the two base deletion probes had the highest average PM to cognate MM hybridization specificity ratio (3.26-fold sense and 4.20-fold antisense) followed by single base substitution (2.79-fold sense, 3.29-fold antisense), one base deletion (1.97-fold sense and 2.33-fold antisense) and one base insertion (1.68-fold sense and 1.87-fold antisense) probes (Table 1). To provide a finer-scale analysis of hybridization specificity, we determined the relative frequencies of hybridization specificity ratios in defined bins. There was a similar distribution of specificity ratios for single base substitution and two base deletion probes on both strands (Figure 3). The overall lower hybridization specificities of single base deletion and insertion probes are reflected by the increased frequencies of probes within the lower specificity bins (i.e. <2-fold ratio) and decreased frequencies of probes within higher specificity bins (i.e. >3-fold ratio) on both strands.
Figure 3.
Distribution of binned hybridization specificity values. The relative percent frequencies of hybridization specificity ratios (y-axis) for substitution (red), one base deletion (green), two base deletion (blue) and one base insertion (black) probes present within distinct bins (x-axis) are provided for sense (A) and antisense (B) microarrays. Hybridization specificity ratios are averaged across 68 experiments on each strand.
Effects of sequence composition on hybridization specificity
Next, we sought to uncover underlying trends in the hybridization specificity of different classes of mismatch probes across the entire ATM coding region within a given sample (intra-sample variation). This provides insights into sequence context effects that may influence the hybridization specificity of each class of mismatch probe. To approach this problem, we plotted the average hybridization specificity ratios of substitution, deletion and insertion probes for all 1168 bases across the 68 samples (Figure 4 and Supplementary Figure 1). We analyzed data determined over running averages of 10 bases in order to maximize our ability to detect trends and minimize the effect of randomly dispersed confounding factors (e.g. intra- or intermolecular secondary structure) that may skew data for any given base.
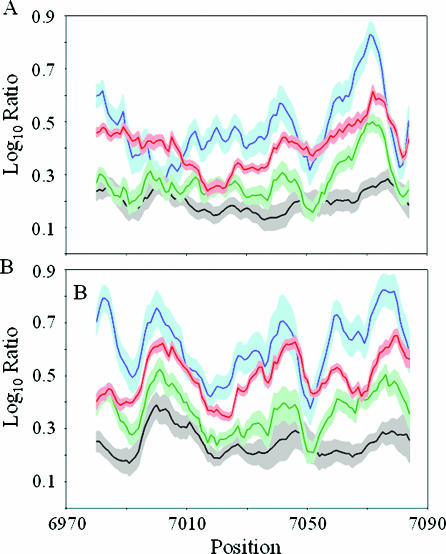
Figure 4.
Hybridization specificities of mismatch probes. A 10-base running window of the log10 hybridization specificity ratios of substitution (red), one base deletion (green), two base deletion (blue) and one base insertion (black) was plotted for the sense (A) and antisense (B) strands of ATM exon 50. The light red, light green, light blue and gray shaded areas represent ±1 SD of the log10 hybridization specificity ratios for the substitution, one base deletion, two base deletion and one base insertion probes, respectively.
As expected from Table 1 and Figure 3, the two base deletion probes consistently showed a higher average hybridization specificity ratio followed by single base substitution, single base deletion and single base insertion probes on both strands of exon 50 (Figure 4). Nevertheless, the hybridization specificity ratios for all classes of mismatch probes fluctuate across the exon 50 sequence (Figure 4). For example, two base deletion probes showed a peak value of 6.76 (unlogged) centered at base 7071 and a trough value of 1.90 (unlogged) centered at base 7002 on the sense strand. We also found similar fluctuations in specificity ratios for all mismatch probe types in the remaining 61 ATM coding exons (Supplementary Figure 1).
To assess intra-sample variability in hybridization specificity by a different means, we determined the average cv for substitution, deletion and insertion probes within a given experiment (Table 1). Again, we analyzed data from running average of 10 bases in order to maximize our ability to detect trends and maintain consistency in our data analysis. Substitution probes had the lowest average intra-sample cv, 0.31 and 0.23 for sense and antisense strands, respectively. One base deletion, two base deletion and insertion probes showed comparable intra-sample coefficients of variation on the sense strand, 0.37, 0.39, and 0.38, respectively. However, insertion probes showed relatively higher variability than the deletion probes on the antisense strand. Coupled with plots shown in Supplementary Figure 1, it is evident that of all the mismatch probe types, the hybridization specificities of base substitution probes were least affected by target sequence context.
Intrigued by the above observations, we next searched for specific target sequence tracts that produced the lowest hybridization specificity among and between the different classes of mismatch probes. To approach this problem, we determined how many mismatch probes within running windows of 10 bases gave poor hybridization specificity, previously defined as a hybridization specificity ratio <1.2 (26). In Table 2, we report nucleotide tracts where at least 8 probes within a given 10 base window showed poor hybridization specificity ratios. A comprehensive listing of probes with poor hybridization specificity is provided in Supplementary Table 1.
Table 2.
ATM sequence tracts with lowest mismatch hybridization specificity
| Positiona | Sequence | Structureb | Miscalled | ||
|---|---|---|---|---|---|
| Target | Probe | Repeat type | Probe typec | ||
| Sense | |||||
| 883–892 | GCCAAAACCC | S | W | Homopolymer | DEL1 |
| 2543–2552 | AGGTGGAGGA | M | W | (TGGAGG)2 | INS |
| 3589–3598d | GTTTCTGAAA | S | S | None | INS |
| 3699–3708d | TTTTCCTTTT | W | W | Homopyrimidine | INS |
| 3919–3928 | GGGATGGCAC | M | W | None | INS |
| 4354–4363 | GATATAAAAA | W | W | Homopolymer | DEL2 |
| 5752–5761 | AGACAAAAGA | M | W | Homopolymer | INS |
| 5972–5981 | AAAAAAGTAA | W | W | Homopolymer | DEL1 |
| 7261–7270 | AAAGAGGAAG | M | W | Homopurine | INS |
| 8274–8283 | TCCCCTCTCT | W | W | Homopyrimidine | DEL2 |
| 8339–8348 | TTGTTAACAA | M | W | None | DEL2 |
| 8405–8414 | AAAAGAAAAT | M | W | Homopurine | DEL1 |
| 9122–9131 | ACCCCAAAAA | S | W | Homopolymer | DEL1 |
| Antisense | |||||
| 633–642 | GGAAAAAAAG | S | W | Homopolymer | INS |
| 822–831 | TTCTTTTAAA | S | M | Homopolymer | INS |
| 2403–2412 | CAGGAAAAAG | M | W | Homopurine | INS |
| 3589–3598d | TTTCAGAAAC | M | S | None | SUB, DEL1, INS |
| 3699–3708d | AAAAGGAAAA | W | W | Homopurine | INS |
| 8088–8097 | TGGTAAATTT | M | W | Homopolymere | DEL1 |
aSequence tract where at least eight of 10 bases provided poor hybridization specificity ratios (<1.2-fold) on the indicated strand.
bStability of potential intramolecular structures that can be formed by the indicated sequence tracts. Mfold (38) was used to predict the intramolecular structures with the lowest Gibbs free energy (ΔG) for either the 25–30 base stretches that encompass each listed sequence tract in the target or for the PM probes complementary to each sequence tract. We use these ΔG values to predict the stability of these structures. ΔG > (−1 kcal/mmol) = weak (W); (−1 kcal/mmol) > ΔG > (−3 kcal/mmol) = medium (M); and ΔG < (−3 kcal/mmol) = strong (S).
cType of mismatch probe that provided poor hybridization specificity ratios.
dLow hybridization specificity found on both sense and antisense strands.
eImmediately following the 3′ end of this segment is a (T)5 sequence tract.
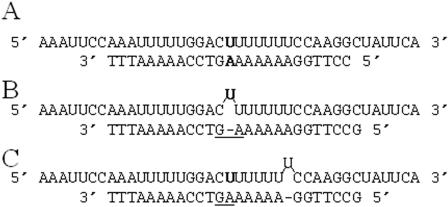
Repetitive sequence tracts, including homopolymer, homopurine and homopyrimidine, are highly represented in Table 2. Upon closer inspection, it became apparent why the cross-hybridization is strong for probes in homopolymeric regions. In these sequence contexts, substitution and deletion probes can form duplexes with wild-type target that are longer than 12 bp in length. For example, the probe designed to detect a single base deletion at position 633 is designed to form one 12 bp and one 13 bp duplex with wild-type target. However, this probe can form duplexes that range from 12 to 18 bp in length with wild-type sense strand target due to slippage (Figure 5). This type of ambiguity leads to increased stability of these DNA–RNA heteroduplexes (34).
Figure 5.
Insertion and deletion probes in homopolymeric sequence tracts. Predicted 25mer duplex formed between a (A) PM probe and (B and C) one base deletion interrogating nucleotide position 634 (boldface) of the ATM coding sequence and wild-type target. (B) A theoretical duplex designed to form between wild-type target and a single base deletion probe using our microarray design. (C) The most stable theoretical duplex formed between wild-type target and the one base deletion probe.
In principle, the homopurine and homopyrimidine tracts uncovered have the capacity to form higher order structures, such as triple helices (35). These tracts are known to alter the conformation and stabilities of RNA–DNA heteroduplexes (36,37), such as those formed between RNA targets and DNA probes in our system. Finally, we expect the ATM target to be especially rich in such sequence tracts given that both strands of the 3′-splice acceptor sequences, typically containing homopyrimidine tracts, for all 62 coding exons are included in the ATM target. This increases the likelihood that highly related sequence tracts in the ATM target can cross-hybridize to probes interrogating a particular homopurine or homopyrimidine sequence tract and reduce the overall hybridization specificity in this region.
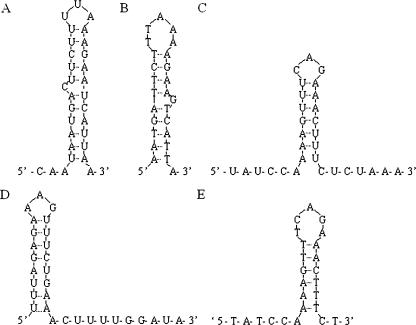
Next, we screened for potential structures that can form in the PM probes listed in Table 2 or their targets that could explain their poor hybridization specificity. To do this, we used Mfold (38) to calculate Gibbs free energies for intramolecular structures that can form in these PM probes and targets. Based on these Gibbs free energy values, we classified the probes and targets as having strong (S) [ΔG < (−3 kcal/mmol)], medium (M) [(−1 kcal/mmol) > ΔG > (−3 kcal/mmol)] and weak (W) [G > (−1 kcal/mmol)] potential for secondary structure. We found that several target and probe sequences could form substantial secondary structures, as displayed in Figure 6. This could artificially lower the affinity of target to PM probes and thus lower the hybridization specificity. It is more difficult to model intermolecular structure in the solution-phase complex target and in the solid-phase oligonucleotide probes. However, it appears likely that such structures could also have a similar negative impact on hybridization specificity.
Figure 6.
Possible intramolecular target and probe structures in low specificity sequence tracts. Results from Mfold analyses of specific regions of ATM target and probes that provide poor hybridization specificity, as indicated in Table 2. (A) Bases 812–841 of the antisense ATM target. (B) PM probe complementary to bases 815–839 of antisense ATM target. (C) Bases 3579–3608 of the antisense ATM target. (D) Bases 3579–3608 of the sense ATM target. (E) PM probe complementary to bases 3579–3603 of the sense ATM target.
Consistency of hybridization data from mismatch probes
The relative variability in hybridization specificity ratios across samples (inter-sample variability) represents another important issue that should be considered in resequencing analysis (9). To uncover general trends in inter-sample variability for each type of mismatch probe, we calculated an average cv for mismatch probe hybridization specificity ratios determined over running windows of 10 bases (Table 1). Interestingly, on both strands, the single base substitution probes showed the lowest inter-sample cv. The one and two base deletion probes showed at least 2-fold higher coefficients of variation on both strands, relative to the substitution probes. Surprisingly, the one base insertion probes showed significantly higher coefficient of variations than any of the other classes of mismatch probes across samples. In fact, they are 3.5-fold higher than the corresponding substitution probes on each strand.
The relative levels of inter-sample variation for all mismatch probes across exon 50 are displayed graphically in Figure 4. The error bars represent one standard deviation from the mean of the hybridization specificity ratio determined over a running window of 10 bases in each of the 68 samples. Note that the substitution probes show lower inter-sample variability than one base deletion, two base deletion and one base insertion probes, in agreement with Table 1. The variability in hybridization specificity measurements is consistent across all 62 ATM coding exons (Supplementary Figure 1).
Overall, our analyses indicate that, on average, single base insertion probes show substantially lower reproducibility across experiments than base substitution, one base deletion and two base deletion probes. The increased inter- and intra-sample variability in hybridization specificity of single base insertion and deletion probes relative to single base substitution and two base deletion probes should be considered when designing and interpreting microarray-based screens for genetic variation. For a given microarray design, substantially more control hybridization experiments may be needed to determine baseline fluctuations in the hybridization specificities of insertion and deletion probes relative to those of substitution probes.
Possible reasons for the hybridization properties of mismatch probes
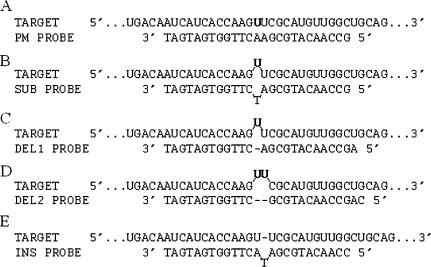
In contrast to single nucleotide mismatches, detailed thermodynamic analyses of double helical nucleic acids with bulged nucleotides have only recently been conducted (34,39–41). In such cases, the bulged nucleotide is unpaired on only one of the nucleic acid strands. These studies are relevant to understanding the properties of the deletion and insertion probes since they can form duplexes containing bulges with target nucleic acid. For deletion probes, the bulged nucleotide is located on the target strand (Figure 7). Conversely, the insertion probes contain the bulged nucleotide in duplexes with wild-type target (Figure 7).
Figure 7.
Possible duplexes formed between mismatch probes and wild-type target. Potential duplexes formed between PM (A), substitution (B), one base deletion (C), two base deletion (D) and one base insertion (E) probes interrogating nucleotide position 3255 [boldface in (A)] of the sense strand of the ATM gene.
Although subject to sequence context effects, duplexes containing a single base bulge are predicted to be more stable than those containing single nucleotide mismatches (34,39–41). This is reflected in the lower average hybridization specificity of single base deletion and insertion probes relative to that of substitution probes (Table 1 and Figure 4). Conversely, duplexes containing two base bulges are predicted to be generally less stable than those containing a single base mismatch (40,41). In part, this is due to the assumption that helical stacking is interrupted by bulges of two or greater bases in length while it is preserved for one base bulges (40,41). The higher average hybridization specificity ratios of two base deletion probes relative to substitution probes are in agreement with the predicted properties of these probes (Table 1).
The considerably lower average inter-sample variability of substitution probes relative to deletion and insertion probes was unexpected given that the same target was hybridized to all mismatch probes simultaneously in the same experiment. The sources of inter-sample variation include sample preparation, hybridization conditions and the microarrays themselves. It is reasonable to assume that the microarrays themselves are not the major source of variability since the combinatorial manufacturing processes should lead to roughly equivalent synthesis quality for all the arrayed probes (42,43). It seems more likely that the insertion and deletion probes are more sensitive to subtle changes in target preparation (e.g. amount of fragmentation and dye incorporation) and hybridization conditions (e.g. target concentration, temperature and wash conditions) than the substitution probes. However, a definitive explanation for our observations will require further investigations (44–52).
Caveats for the use of mismatch probes for mutation detection
In addition to their potential value, it is important to note some of the caveats when relying upon mismatch probes for mutation detection. For example, it is important to screen for all possible sequence changes, including multiple base insertions and deletions, in mutational analyses of disease-related loci, such as the ATM, BRCA1 and BRCA2 genes. Given that 4N probes per base per strand are needed to screen for insertions of length N in a mixed sequence, it is unlikely that oligonucleotides complementary to insertions of two or more base pairs will be represented on microarrays screening large sequence tracts for mutations in the near future. Deletions represent a more tenable situation since only one probe per base per strand is needed to screen for a deletion of a given length in a mixed sequence. Nevertheless, there will still be limitations as to the number of deletion probes that can be realistically represented in a given microarray.
Finally, it is often critical to precisely determine the nature of a sequence change within a given sample in order to properly assess its functional significance. Thus, it is important to consider error rates when assigning the identity of a mutation based on mismatch probe data. When dealing with clinical samples, it will be especially important to confirm the identity of specific sequence variants by sequencing even when dealing with slightly ambiguous hybridization data.
SUPPLEMENTARY MATERIAL
Supplementary Material is available at NAR Online.
Supplementary Material
Acknowledgments
We would like to thank Nathaniel Hunt at the National Institutes of Health for programming assistance in the early stages of the project and Juergen Reichardt at the University of Southern California for thoughtful discussion. This work was partially funded by National Institutes of Health Grants P50-HG002790 and P30-CA014089. Funding to pay the Open Access publication charges for this article was provided by a USC Institute for Genetic Medicine gift account.
REFERENCES
- 1.Mir K.U., Southern E.M. Sequence variation in genes and genomic DNA: methods for large-scale analysis. Annu. Rev. Genomics Hum. Genet. 2000;1:329–360. doi: 10.1146/annurev.genom.1.1.329. [DOI] [PubMed] [Google Scholar]
- 2.Kolchinsky A., Mirzabekov A. Analysis of SNPs and other genomic variations using gel-based chips. Hum. Mutat. 2002;19:343–360. doi: 10.1002/humu.10077. [DOI] [PubMed] [Google Scholar]
- 3.Hacia J.G., Collins F.S. Mutational analysis using oligonucleotide microarrays. J. Med. Genet. 1999;36:730–736. doi: 10.1136/jmg.36.10.730. [DOI] [PMC free article] [PubMed] [Google Scholar]
- 4.Hacia J.G. Resequencing and mutational analysis using oligonucleotide microarrays. Nature Genet. 1999;21:42–47. doi: 10.1038/4469. [DOI] [PubMed] [Google Scholar]
- 5.Warrington J.A., Shah N.A., Chen X., Janis M., Liu C., Kondapalli S., Reyes V., Savage M.P., Zhang Z., Watts R., et al. New developments in high-throughput resequencing and variation detection using high density microarrays. Hum. Mutat. 2002;19:402–409. doi: 10.1002/humu.10075. [DOI] [PubMed] [Google Scholar]
- 6.Ahrendt S.A., Halachmi S., Chow J.T., Wu L., Halachmi N., Yang S.C., Wehage S., Jen J., Sidransky D. Rapid p53 sequence analysis in primary lung cancer using an oligonucleotide probe array. Proc. Natl Acad. Sci. USA. 1999;96:7382–7387. doi: 10.1073/pnas.96.13.7382. [DOI] [PMC free article] [PubMed] [Google Scholar]
- 7.Cargill M., Altshuler D., Ireland J., Sklar P., Ardlie K., Patil N., Shaw N., Lane C.R., Lim E.P., Kalyanaraman N., et al. Characterization of single-nucleotide polymorphisms in coding regions of human genes. Nature Genet. 1999;22:231–238. doi: 10.1038/10290. [DOI] [PubMed] [Google Scholar]
- 8.Chee M., Yang R., Hubbell E., Berno A., Huang X.C., Stern D., Winkler J., Lockhart D.J., Morris M.S., Fodor S.P. Accessing genetic information with high-density DNA arrays. Science. 1996;274:610–614. doi: 10.1126/science.274.5287.610. [DOI] [PubMed] [Google Scholar]
- 9.Cutler D.J., Zwick M.E., Carrasquillo M.M., Yohn C.T., Tobin K.P., Kashuk C., Mathews D.J., Shah N.A., Eichler E.E., Warrington J.A., et al. High-throughput variation detection and genotyping using microarrays. Genome Res. 2001;11:1913–1925. doi: 10.1101/gr.197201. [DOI] [PMC free article] [PubMed] [Google Scholar]
- 10.Dong S., Wang E., Hsie L., Cao Y., Chen X., Gingeras T.R. Flexible use of high-density oligonucleotide arrays for single-nucleotide polymorphism discovery and validation. Genome Res. 2001;11:1418–1424. doi: 10.1101/gr.171101. [DOI] [PMC free article] [PubMed] [Google Scholar]
- 11.Frazer K.A., Sheehan J.B., Stokowski R.P., Chen X., Hosseini R., Cheng J.F., Fodor S.P., Cox D.R., Patil N. Evolutionarily conserved sequences on human chromosome 21. Genome Res. 2001;11:1651–1659. doi: 10.1101/gr.198201. [DOI] [PMC free article] [PubMed] [Google Scholar]
- 12.Kozal M.J., Shah N., Shen N., Yang R., Fucini R., Merigan T.C., Richman D.D., Morris D., Hubbell E., Chee M., et al. Extensive polymorphisms observed in HIV-1 clade B protease gene using high-density oligonucleotide arrays. Nature Med. 1996;2:753–759. doi: 10.1038/nm0796-753. [DOI] [PubMed] [Google Scholar]
- 13.Lindblad-Toh K., Winchester E., Daly M.J., Wang D.G., Hirschhorn J.N., Laviolette J.P., Ardlie K., Reich D.E., Robinson E., Sklar P., et al. Large-scale discovery and genotyping of single-nucleotide polymorphisms in the mouse. Nature Genet. 2000;24:381–386. doi: 10.1038/74215. [DOI] [PubMed] [Google Scholar]
- 14.Maitra A., Cohen Y., Gillespie S.E., Mambo E., Fukushima N., Hoque M.O., Shah N., Goggins M., Califano J., Sidransky D., et al. The Human MitoChip: a high-throughput sequencing microarray for mitochondrial mutation detection. Genome Res. 2004;14:812–819. doi: 10.1101/gr.2228504. [DOI] [PMC free article] [PubMed] [Google Scholar]
- 15.Patil N., Berno A.J., Hinds D.A., Barrett W.A., Doshi J.M., Hacker C.R., Kautzer C.R., Lee D.H., Marjoribanks C., McDonough D.P., et al. Blocks of limited haplotype diversity revealed by high-resolution scanning of human chromosome 21. Science. 2001;294:1719–1723. doi: 10.1126/science.1065573. [DOI] [PubMed] [Google Scholar]
- 16.Takahashi Y., Ishii Y., Nagata T., Ikarashi M., Ishikawa K., Asai S. Clinical application of oligonucleotide probe array for full-length gene sequencing of TP53 in colon cancer. Oncology. 2003;64:54–60. doi: 10.1159/000066510. [DOI] [PubMed] [Google Scholar]
- 17.Wang D.G., Fan J.B., Siao C.J., Berno A., Young P., Sapolsky R., Ghandour G., Perkins N., Winchester E., Spencer J., et al. Large-scale identification, mapping, and genotyping of single-nucleotide polymorphisms in the human genome. Science. 1998;280:1077–1082. doi: 10.1126/science.280.5366.1077. [DOI] [PubMed] [Google Scholar]
- 18.Wen W.H., Press M.F. Identification of TP53 mutations in human cancers using oligonucleotide microarrays. Methods Mol. Med. 2004;97:323–335. doi: 10.1385/1-59259-760-2:323. [DOI] [PubMed] [Google Scholar]
- 19.Wikman F.P., Lu M.L., Thykjaer T., Olesen S.H., Andersen L.D., Cordon-Cardo C., Orntoft T.F. Evaluation of the performance of a p53 sequencing microarray chip using 140 previously sequenced bladder tumor samples. Clin. Chem. 2000;46:1555–1561. [PubMed] [Google Scholar]
- 20.Yershov G., Barsky V., Belgovskiy A., Kirillov E., Kreindlin E., Ivanov I., Parinov S., Guschin D., Drobishev A., Dubiley S., et al. DNA analysis and diagnostics on oligonucleotide microchips. Proc. Natl Acad. Sci. USA. 1996;93:4913–4918. doi: 10.1073/pnas.93.10.4913. [DOI] [PMC free article] [PubMed] [Google Scholar]
- 21.Wong C.W., Albert T.J., Vega V.B., Norton J.E., Cutler D.J., Richmond T.A., Stanton L.W., Liu E.T., Miller L.D. Tracking the evolution of the SARS coronavirus using high-throughput, high-density resequencing arrays. Genome Res. 2004;14:398–405. doi: 10.1101/gr.2141004. [DOI] [PMC free article] [PubMed] [Google Scholar]
- 22.Frazer K.A., Chen X., Hinds D.A., Pant P.V., Patil N., Cox D.R. Genomic DNA insertions and deletions occur frequently between humans and nonhuman primates. Genome Res. 2003;13:341–346. doi: 10.1101/gr.554603. [DOI] [PMC free article] [PubMed] [Google Scholar]
- 23.Frazer K.A., Wade C.M., Hinds D.A., Patil N., Cox D.R., Daly M.J. Segmental phylogenetic relationships of inbred mouse strains revealed by fine-scale analysis of sequence variation across 4.6 mb of mouse genome. Genome Res. 2004;14:1493–1500. doi: 10.1101/gr.2627804. [DOI] [PMC free article] [PubMed] [Google Scholar]
- 24.Cronin M.T., Fucini R.V., Kim S.M., Masino R.S., Wespi R.M., Miyada C.G. Cystic fibrosis mutation detection by hybridization to light-generated DNA probe arrays. Hum. Mutat. 1996;7:244–255. doi: 10.1002/(SICI)1098-1004(1996)7:3<244::AID-HUMU9>3.0.CO;2-A. [DOI] [PubMed] [Google Scholar]
- 25.Hacia J.G., Brody L.C., Chee M.S., Fodor S.P., Collins F.S. Detection of heterozygous mutations in BRCA1 using high density oligonucleotide arrays and two-colour fluorescence analysis. Nature Genet. 1996;14:441–447. doi: 10.1038/ng1296-441. [DOI] [PubMed] [Google Scholar]
- 26.Hacia J.G., Woski S.A., Fidanza J., Edgemon K., Hunt N., McGall G., Fodor S.P., Collins F.S. Enhanced high density oligonucleotide array-based sequence analysis using modified nucleoside triphosphates. Nucleic Acids Res. 1998;26:4975–4982. doi: 10.1093/nar/26.21.4975. [DOI] [PMC free article] [PubMed] [Google Scholar]
- 27.Hacia J.G., Sun B., Hunt N., Edgemon K., Mosbrook D., Robbins C., Fodor S.P., Tagle D.A., Collins F.S. Strategies for mutational analysis of the large multiexon ATM gene using high-density oligonucleotide arrays. Genome Res. 1998;8:1245–1258. doi: 10.1101/gr.8.12.1245. [DOI] [PubMed] [Google Scholar]
- 28.Hacia J.G., Edgemon K., Sun B., Stern D., Fodor S.P., Collins F.S. Two color hybridization analysis using high density oligonucleotide arrays and energy transfer dyes. Nucleic Acids Res. 1998;26:3865–3866. doi: 10.1093/nar/26.16.3865. [DOI] [PMC free article] [PubMed] [Google Scholar]
- 29.Hacia J.G., Edgemon K., Fang N., Mayer R.A., Sudano D., Hunt N., Collins F.S. Oligonucleotide microarray based detection of repetitive sequence changes. Hum. Mutat. 2000;16:354–363. doi: 10.1002/1098-1004(200010)16:4<354::AID-HUMU8>3.0.CO;2-V. [DOI] [PubMed] [Google Scholar]
- 30.Fang N.Y., Greiner T.C., Weisenburger D.D., Chan W.C., Vose J.M., Smith L.M., Armitage J.O., Mayer R.A., Pike B.L., Collins F.S., et al. Oligonucleotide microarrays demonstrate the highest frequency of ATM mutations in the mantle cell subtype of lymphoma. Proc. Natl Acad. Sci. USA. 2003;100:5372–5377. doi: 10.1073/pnas.0831102100. [DOI] [PMC free article] [PubMed] [Google Scholar]
- 31.Lipkin S.M., Rozek L.S., Rennert G., Yang W., Chen P.C., Hacia J., Hunt N., Shin B., Fodor S., Kokoris M., et al. The MLH1 D132H variant is associated with susceptibility to sporadic colorectal cancer. Nature Genet. 2004;36:694–699. doi: 10.1038/ng1374. [DOI] [PubMed] [Google Scholar]
- 32.Shiloh Y. ATM and related protein kinases: safeguarding genome integrity. Nature Rev. Cancer. 2003;3:155–168. doi: 10.1038/nrc1011. [DOI] [PubMed] [Google Scholar]
- 33.Gumy-Pause F., Wacker P., Sappino A.P. ATM gene and lymphoid malignancies. Leukemia. 2004;18:238–242. doi: 10.1038/sj.leu.2403221. [DOI] [PubMed] [Google Scholar]
- 34.Znosko B.M., Silvestri S.B., Volkman H., Boswell B., Serra M.J. Thermodynamic parameters for an expanded nearest-neighbor model for the formation of RNA duplexes with single nucleotide bulges. Biochemistry. 2002;41:10406–10417. doi: 10.1021/bi025781q. [DOI] [PubMed] [Google Scholar]
- 35.Holland J.A., Hoffman D.W. Structural features and stability of an RNA triple helix in solution. Nucleic Acids Res. 1996;24:2841–2848. doi: 10.1093/nar/24.14.2841. [DOI] [PMC free article] [PubMed] [Google Scholar]
- 36.Gyi J.I., Lane A.N., Conn G.L., Brown T. Solution structures of DNA.RNA hybrids with purine-rich and pyrimidine-rich strands: comparison with the homologous DNA and RNA duplexes. Biochemistry. 1998;37:73–80. doi: 10.1021/bi9719713. [DOI] [PubMed] [Google Scholar]
- 37.Ratmeyer L., Vinayak R., Zhong Y.Y., Zon G., Wilson W.D. Sequence specific thermodynamic and structural properties for DNA.RNA duplexes. Biochemistry. 1994;33:5298–5304. doi: 10.1021/bi00183a037. [DOI] [PubMed] [Google Scholar]
- 38.Zuker M. Mfold web server for nucleic acid folding and hybridization prediction. Nucleic Acids Res. 2003;31:3406–3415. doi: 10.1093/nar/gkg595. [DOI] [PMC free article] [PubMed] [Google Scholar]
- 39.Zhu J., Wartell R.M. The effect of base sequence on the stability of RNA and DNA single base bulges. Biochemistry. 1999;38:15986–15993. doi: 10.1021/bi9916372. [DOI] [PubMed] [Google Scholar]
- 40.Mathews D.H., Sabina J., Zuker M., Turner D.H. Expanded sequence dependence of thermodynamic parameters improves prediction of RNA secondary structure. J. Mol. Biol. 1999;288:911–940. doi: 10.1006/jmbi.1999.2700. [DOI] [PubMed] [Google Scholar]
- 41.Dimitrov R.A., Zuker M. Prediction of hybridization and melting for double-stranded nucleic acids. Biophys. J. 2004;87:215–226. doi: 10.1529/biophysj.103.020743. [DOI] [PMC free article] [PubMed] [Google Scholar]
- 42.Fodor S.P., Read J.L., Pirrung M.C., Stryer L., Lu A.T., Solas D. Light-directed, spatially addressable parallel chemical synthesis. Science. 1991;251:767–773. doi: 10.1126/science.1990438. [DOI] [PubMed] [Google Scholar]
- 43.McGall G.H., Christians F.C. High-density genechip oligonucleotide probe arrays. Adv. Biochem. Eng. Biotechnol. 2002;77:21–42. doi: 10.1007/3-540-45713-5_2. [DOI] [PubMed] [Google Scholar]
- 44.Nagpal S., Karaman M.W., Timmerman M.M., Ho V.V., Pike B.L., Hacia J.G. Improving the sensitivity and specificity of gene expression analysis in highly related organisms through the use of electronic masks. Nucleic Acids Res. 2004;32:e51. doi: 10.1093/nar/gnh048. [DOI] [PMC free article] [PubMed] [Google Scholar]
- 45.Luebke K.J., Balog R.P., Garner H.R. Prioritized selection of oligodeoxyribonucleotide probes for efficient hybridization to RNA transcripts. Nucleic Acids Res. 2003;31:750–758. doi: 10.1093/nar/gkg133. [DOI] [PMC free article] [PubMed] [Google Scholar]
- 46.Matveeva O.V., Shabalina S.A., Nemtsov V.A., Tsodikov A.D., Gesteland R.F., Atkins J.F. Thermodynamic calculations and statistical correlations for oligo-probes design. Nucleic Acids Res. 2003;31:4211–4217. doi: 10.1093/nar/gkg476. [DOI] [PMC free article] [PubMed] [Google Scholar]
- 47.Rouillard J.M., Zuker M., Gulari E. OligoArray 2.0: design of oligonucleotide probes for DNA microarrays using a thermodynamic approach. Nucleic Acids Res. 2003;31:3057–3062. doi: 10.1093/nar/gkg426. [DOI] [PMC free article] [PubMed] [Google Scholar]
- 48.Zhang L., Miles M.F., Aldape K.D. A model of molecular interactions on short oligonucleotide microarrays. Nat. Biotechnol. 2003;21:818–821. doi: 10.1038/nbt836. [DOI] [PubMed] [Google Scholar]
- 49.Mei R., Hubbell E., Bekiranov S., Mittmann M., Christians F.C., Shen M.M., Lu G., Fang J., Liu W.M., Ryder T., et al. Probe selection for high-density oligonucleotide arrays. Proc. Natl Acad. Sci. USA. 2003;100:11237–11242. doi: 10.1073/pnas.1534744100. [DOI] [PMC free article] [PubMed] [Google Scholar]
- 50.Held G.A., Grinstein G., Tu Y. Modeling of DNA microarray data by using physical properties of hybridization. Proc. Natl Acad. Sci. USA. 2003;100:7575–7580. doi: 10.1073/pnas.0832500100. [DOI] [PMC free article] [PubMed] [Google Scholar]
- 51.Fidanza J.A., McGall G.H. High-density nucleoside analog probe arrays for enhanced hybridization. Nucleosides Nucleotides. 1999;18:1293–1295. doi: 10.1080/07328319908044695. [DOI] [PubMed] [Google Scholar]
- 52.Hoheisel J.D. Sequence-independent and linear variation of oligonucleotide DNA binding stabilities. Nucleic Acids Res. 1996;24:430–432. doi: 10.1093/nar/24.3.430. [DOI] [PMC free article] [PubMed] [Google Scholar]
Associated Data
This section collects any data citations, data availability statements, or supplementary materials included in this article.


