Abstract
How terminal cell fates are specified in dynamically renewing adult tissues is not well understood. Here we explore terminal cell fate establishment during homeostasis using the enteroendocrine cells (EEs) of the adult Drosophila midgut as a paradigm. Our data argue against the existence of local feedback signals, and we identify Numb as an intrinsic regulator of EE fate. Our data further indicate that Numb, with alpha‐adaptin, acts upstream or in parallel of known regulators of EE fate to limit Notch signaling, thereby facilitating EE fate acquisition. We find that Numb is regulated in part through its asymmetric and symmetric distribution during stem cell divisions; however, its de novo synthesis is also required during the differentiation of the EE cell. Thus, this work identifies Numb as a crucial factor for cell fate choice in the adult Drosophila intestine. Furthermore, our findings demonstrate that cell‐intrinsic control mechanisms of terminal cell fate acquisition can result in a balanced tissue‐wide production of terminally differentiated cell types.
Keywords: adult intestinal stem cell, Drosophila midgut, enteroendocrine cells, fate homeostasis, Numb
Subject Categories: Development & Differentiation, Signal Transduction
Introduction
During development, cell fate decisions result from a temporally and spatially controlled cascade of cell–cell interactions and cell‐autonomous signaling. However, in adult tissues, dynamic responses to systemic stress and external environmental agonists are required and therefore must be coordinated with the production of specialized terminally differentiated cells.
The adult Drosophila intestinal epithelium, like its mammalian counterpart, contains terminally differentiated secretory and absorptive cells that are renewed by intestinal stem cells (ISCs; Micchelli & Perrimon, 2006; Ohlstein & Spradling, 2006), providing a useful model to understand how correct proportions of cell types are achieved within renewing adult tissues. Both the mammalian and fly intestinal epithelia are largely composed of absorptive enterocyte cells (ECs) that are the most abundant cell type, representing approximately 80–90% of the terminally differentiated cells in the fly intestine (Micchelli & Perrimon, 2006; Ohlstein & Spradling, 2006). The fly intestine contains enteroendocrine cells (EEs) that comprise approximately 10–20% of the terminally differentiated cells (Ohlstein & Spradling, 2007; Perdigoto et al, 2011), whereas the mammalian intestine also harbors additional secretory cell populations (Jiang & Edgar, 2012). EE cells produce numerous peptide hormones, sense the nutritional status, and inhibit intestinal stem cell (ISC) proliferation through control of insulin and EGFR signaling (Miguel‐Aliaga, 2012; Amcheslavsky et al, 2014; Scopelliti et al, 2014). Importantly, EE‐less flies have reduced life span and are starvation sensitive, indicating that obtaining the correct balance of EE cells within the tissue is critical (Amcheslavsky et al, 2014). The mechanism controlling this balance is unknown.
Drosophila ISCs are multipotent, renewing both ECs and EEs cells during the adult life of the fly (Micchelli & Perrimon, 2006; Ohlstein & Spradling, 2006). The Notch receptor and its ligand Delta (Dl) are expressed in ISCs and inherited in newly born daughter cells. A majority of ISC divisions are thought to result in an asymmetric cell fate outcome of the daughter cells, with one cell retaining ISC fate. The other sister cell, termed the enteroblast (EB; Micchelli & Perrimon, 2006; Ohlstein & Spradling, 2006), then differentiates into either EE or EC cell fates. A recent study has also suggested that ISCs can produce EE cells via symmetric divisions or by direct differentiation (Zeng & Hou, 2015).
Enteroendocrine fate specification in Drosophila, like that in zebrafish and mouse, is limited by the activity of the Notch signaling pathway (Fre et al, 2011). Lineage tracing experiments also support the notion that most EE cells do not experience high level Notch signaling (Biteau & Jasper, 2014; Zeng & Hou, 2015), though a subpopulation may require Notch signaling (Beehler‐Evans & Micchelli, 2015). Therefore, Notch signaling in the stem cell daughter cell is important for EC fate but is kept off or low when EE fate specification occurs. How Notch activity is dynamically controlled to modulate EE versus EC fate is not currently understood.
In addition to regulation by Notch, a number of transcription factors have been implicated in EE fate specification. The chromatin modifier osa was demonstrated to be generally required for both EC and EE differentiation (Zeng et al, 2013), while additional transcription factors have more specific functions on EE fate including the bHLH transcription factor Scute, Prospero, and Tramtrack69 (Bardin et al, 2010; Amcheslavsky et al, 2014; Wang et al, 2015; Zeng & Hou, 2015). In addition to its expression in EE cells, Prospero has been detected in 5–8% of dividing ISCs and is asymmetrically segregated in 2% of dividing ISCs (Biteau & Jasper, 2014; Guo & Ohlstein, 2015). However, the functional relevance of asymmetric and symmetric distribution of Prospero is not known.
Controlling a balanced output of terminally differentiated cells in a tissue is an essential feature maintaining tissue architecture. In theory, the ratio of EE cells within the tissue may be controlled via extrinsic feedback signals, intrinsic regulation, or a combination of both. Extrinsic feedback to the ISC could occur locally to mediate the correct production of EE cells. Notably, local extrinsic feedback signals are critical within the fly intestine to regulate proliferation status of ISCs [reviewed in Jiang et al (2016)]. Conversely, cell‐ or lineage‐intrinsic programs might be required to establish the correct ratio of terminal cell fates, resulting in 10–20% of terminally differentiated cells being EEs. This type of stochastic fate choice operates in the fly retina resulting in a 30/70 ratio of Rh3/Rh4+ R7 photoreceptor subtypes, respectively (Wernet et al, 2006).
Recent studies provided some support for an extrinsic negative feedback model to limit EE production through production of a secreted ligand: terminally differentiated EE cells secrete a ligand, Slit and ISCs express the receptor, Robo2 (Biteau & Jasper, 2014; Zeng et al, 2015). Knockdown of Robo2 in ISCs and EBs or Slit, in EEs and neurons, led to a 1.3–2× increase in EE cell density (Biteau & Jasper, 2014; Zeng et al, 2015). As the local secretion of Slit can bind to Robo2 in ISCs (Biteau & Jasper, 2014; Zeng et al, 2015), this feedback would be predicted to act, at least in part, locally.
Here we tested roles for both extrinsic local feedback signals and for intrinsic regulation of EE cell fate. In contrast to the previous model, we found that the local depletion of EE cells did not result in a local compensatory EE cell production. Furthermore, creating a local accumulation of EE cells did not result in local or global alteration of EE density. Thus, our data argue against local feedback playing a major role in EE cell fate specification during tissue homeostasis. Instead, we identify the inhibitor of Notch signaling, Numb, as essential intrinsic regulator of EE cell fate acquisition. Genetic epistasis experiments suggested that numb functions upstream of, or in parallel to, known regulators of EE cell fate. Furthermore, our data indicate that Numb controls Notch via its trafficking function as mutation of the AP‐2 component alpha‐adaptin (Berdnik et al, 2002), also resulted in defective EE production. We find that Numb is segregated both asymmetrically and symmetrically during ISC division. Altering cell polarity affected the ratio of divisions with asymmetric versus symmetric Numb segregation and modified EE fate, suggesting that EE cell fate is regulated in part through control of Numb inheritance. In addition, we find that numb activity is also required in differentiating EE cells, indicating that de novo Numb synthesis is also important. Thus, our findings uncover a novel upstream mechanism of EE cell fate choice and explain how Notch signaling is inhibited promoting EE fate specification.
Results
Absence of a local feedback signal from differentiated EE cells to modulate compensatory EE production
In order to investigate the mechanisms controlling the cell fate decisions producing ECs versus EEs cells, we first explored the hypothesis that local signals emitted from EEs may limit their production by acting on nearby ISCs. Local signals could act either (i) through direct cell–cell contact or (ii) through production of a short‐range diffusible signal that could travel over several cell distances. In order to first address a role for direct cell–cell contact, we assessed whether EEs maintain direct contact with ISCs by visualizing CD8‐GFP expression in EE cells and ISCs. We observed that a majority of ISCs did not contact EE cells (Appendix Fig S1), arguing against a direct inhibitory cell–cell signaling event that actively blocks EE cell production.
Next, we tested a more general role of local feedback by determining whether the clonal loss of EEs could promote de novo EE production in neighboring tissue through removal of diffusible negative feedback signal. The prediction of this model would be that local perturbations in EE density within the intestinal epithelial tissue should lead to alterations in EE density of neighboring tissue: a local depletion of EEs may lead to a compensatory increase in EE density nearby, whereas an excess of EEs would be expected to result in decreased EE numbers in adjacent epithelia.
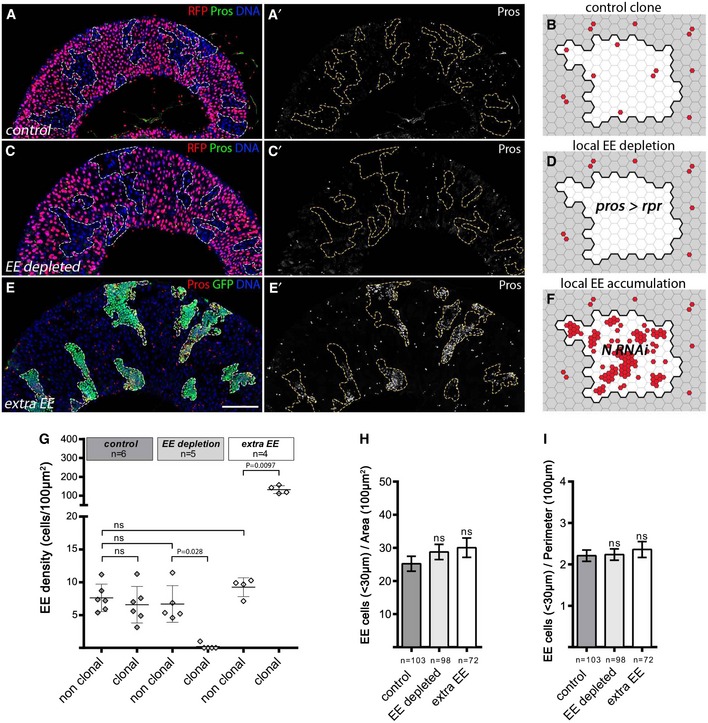
To test this concept experimentally, we genetically manipulated EE cell numbers in clones and measured non‐autonomous effects on EE densities locally as well as more globally at the tissue‐wide scale. First, as a control, we first measured the density of EE cells (#EE cells/surface area) in wild‐type clones in which mitotic recombination is induced via the FLP/FRT system (see Materials and Methods). Clones marked by the absence of RFP expression are exclusively induced in dividing ISCs, as this system requires cell division and ISCs are thought to be the primary, if not only, dividing cell type. We first assessed the combined density of EE cells (marked here by Prospero [Pros] expression) within wild‐type clones compared to the non‐clonal tissue and found no significant difference (Fig 1A–B and G), as expected for a tissue at homeostasis.
Figure 1. Enteroendocrine fate choice does not relies on a negative feedback loop from the differentiated enteroendocrine cells.
-
A–F(A, C, E) Adult posterior midguts containing control clones, those lacking EEs, or with extra EEs (clones outlined), observed 10 days after heat shock (AHS). Images are compiled tile scans stitched together in Zen software. In (A, C), we used a modified MARCM technique in which ProsGal4 was clonally activated when GAL80 was clonally lost through FLP/FRT‐mediated mitotic recombination. Clones were detected by the loss of RFP baring Gal80 chromosome. Scale bar = 100 μm. (A) Control wild‐type clones marked by lack of RFP expression, DNA in blue, and EE cells marked by Pros in green. (B) Schematic view of (A) with EE cells represented in red and clone delineated in black and shown in white. (C) EE depletion by clonal expression of rpr under the control of prosGal4 using the GAL80 system in negatively marked clones (lacking RFP expression and GAL80 expression). (D) Scheme of (C). (E) EE accumulation in MARCM clones (green) expressing RNAi against Notch. DAPI in blue, EE cells marked through Pros, in red. (F) Scheme of (E).
-
GGlobal EE density measured in clonal and non‐clonal compartments in control wild‐type clones, upon EE depletion and ectopic EE cells. The bars represent mean values ± SD.
-
H, INumber of EE cells located in a 30‐μm‐wide band around each individual clone normalized by clonal area (H) and clonal perimeter (I). The bars represent mean values ± SEM.
We next tested the effect of clonal EE loss on the density of EE cells in surrounding wild‐type tissue using a modified MARCM strategy (Lee & Luo, 1999) (see Materials and Methods), whereby clonal loss of GAL80 allows Gal4‐driven transgene expression. We used the EE cell‐specific driver Pros Voila ‐Gal4 to express the proapoptic gene reaper specifically in clones, which we detected by the absence of RFP expression (Fig 1C–D, see Materials and Methods). We then measured EE density in clonal and non‐clonal compartments both locally and globally. Analysis was restricted to intestines where clones were covering at least 10% of the total epithelium area. As expected, Pros>reaper clones were completely devoid of EEs (Fig 1C–D and G). Interestingly, adjacent non‐clonal compartments within 30 μm of the clone showed similar EE density to that of wild‐type control clones without any apparent compensatory production of EE cells (Fig 1C–D and G–I). Importantly, since clone size and clone shape may impact the measurement of EE density, we normalized EE counts by both clone area (Fig 1H) and clone perimeter length (Fig 1I); neither quantification method showed significant deviation from control clones, arguing against local compensatory feedback signals. In addition, global EE density throughout the non‐clonal tissue was comparable to wild‐type control tissues (Fig 1G).
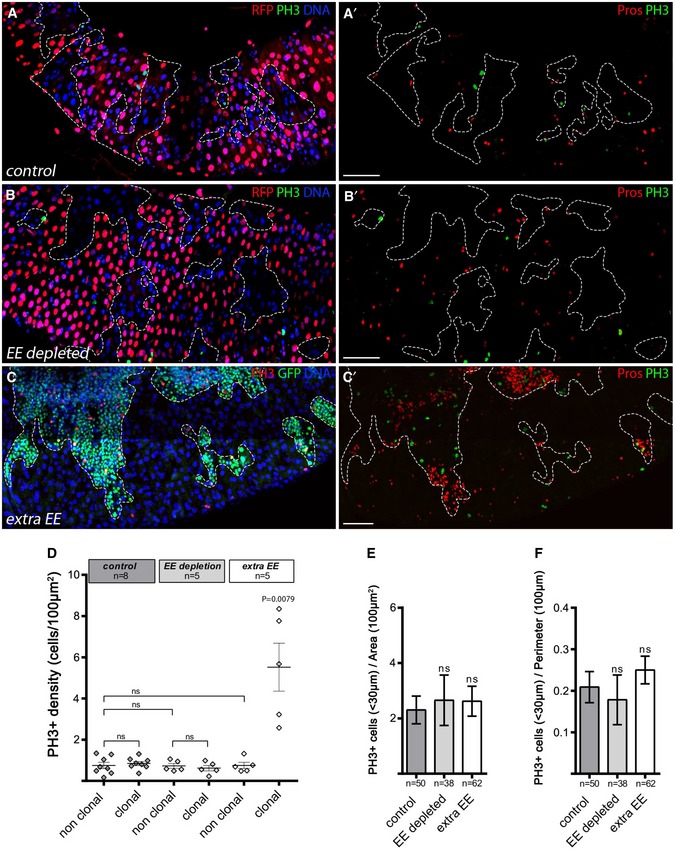
We then determined the effect of a local increase in EE density on EE cell production. To do so, we inactivated Notch signaling clonally which is known to create a surplus of EE cells using Notch RNAi via the MARCM technique, whereby clonal loss of GAL80 allows Gal4‐driven GFP and RNAi transgene expression (Fig 1E–F; Lee & Luo, 1999). Again, we observed no significant difference in EE density either locally in surrounding wild‐type tissue within 30 μm of the clone, or globally throughout the tissue in the non‐clonal compartment compared to the control clones or intestinal tissue (Fig 1G–I). Of note, we verified that extra EE cells produced upon Notch RNAi indeed expressed Slit protein (see below), a proposed feedback signaling ligand (Appendix Fig S2D and D′). In addition, we examined a potential indirect effect on alteration of ISC proliferation in surrounding tissue of controls, upon EE loss, or ectopic EEs and found none (Fig EV1). These results suggest that the ectopic EEs are not emitting signals that would prevent EE formation in surrounding tissue or more globally at the tissue level. Thus, we conclude that the gut epithelium does not respond in a compensatory fashion to local EE fate imbalances to modulate EE density and that maintenance of the EE cell proportion during homeostasis is not strongly influenced by terminally differentiated EEs.
Figure EV1. Local EE fate imbalance does not trigger proliferative response.
-
A–CAdult posterior midguts containing control clones, those lacking EEs, or with extra EEs (clones outlined), observed 10 days AHS. Images are compiled tile scans stitched together in Zen software. In (A, C), we used a modified MARCM technique in which ProsGal4 was clonally activated when GAL80 was clonally lost through FLP/FRT‐mediated mitotic recombination. Clones were detected by the loss of RFP baring Gal80 chromosome. (A, A′) Control wild‐type clones marked by lack of RFP expression, DNA in blue, dividing cells marked by PH3 in green and EE cells marked by Pros in red (right panel). (B, B′) EE depletion by clonal expression of rpr under the control of prosGal4 using the GAL80 system in negatively marked clones (lacking RFP expression and GAL80 expression). (C, C′) EE accumulation in MARCM clones (green) expressing an RNAi against Notch. DAPI in blue, EE cells marked through Pros, in red and dividing cells marked by PH3 in green and red as indicated. Scale bar = 100 μm.
-
DGlobal dividing cells (PH3) density measured in clonal and non‐clonal compartments in control wild‐type clones, upon EE depletion and ectopic EE cells . The bars represent mean values ± SD.
-
E, FNumber of dividing cells (PH3) cells located in a 30‐μm‐wide band around each individual clone normalized by clonal area (E) and clonal perimeter (F). Results were compared using a two‐tailed Mann–Whitney statistical test (ns = non‐significant, P‐value indicated). The bars represent mean values ± SEM.
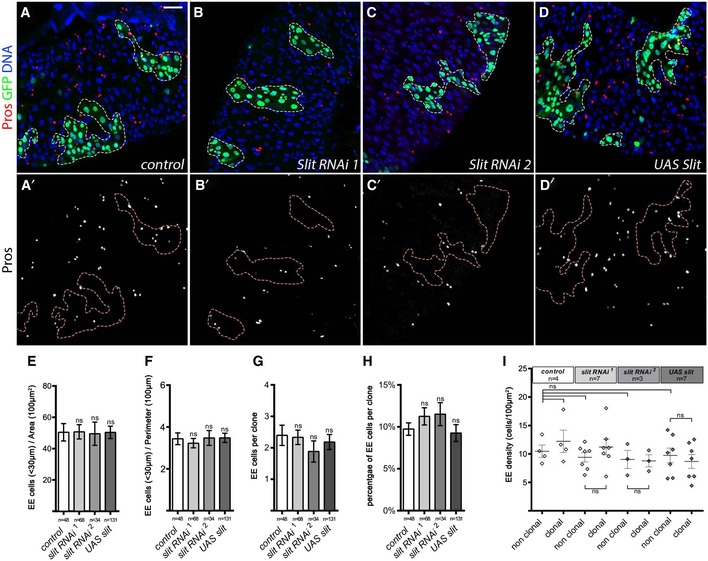
Recent reports proposed that Slit‐Robo signaling constitutes an EE feedback signal whereby Slit is secreted by EEs and binds to the receptor Robo2 in ISCs, inducing a signal that limits EE production (Biteau & Jasper, 2014; Zeng et al, 2015). In support of this, flies expressing RNAi in ISCs or EBs, or flies heterozygous for the Robo2 receptor, leak, were shown to have a roughly twofold increase in the number of EE cells (Biteau & Jasper, 2014; Zeng et al, 2015). In addition, the RNAi‐mediated knockdown of Slit using amonGal4 (Biteau & Jasper, 2014; Zeng et al, 2015) or pros Voila Gal4 (Appendix Fig S2A–C) slightly increased the density of EE cells within the posterior midgut by 1.3–1.5×. However, a direct test of non‐autonomous feedback signaling has not previously been performed. Therefore, we then further directly assessed the local and global effects in gut epithelium of clonal expression of UAS‐slit or two different slit RNAi lines that were previously used (Biteau & Jasper, 2014). Neither the local EE density in surrounding non‐clonal tissue nor the global EE density of non‐clonal tissue throughout the gut was affected in these conditions (Fig 2A–I). In addition, within the slit RNAi or slit overexpression clones, the average number of EE cells per clone was not significantly altered compared to control clones (Fig 2A–D′ and G). In full agreement with our clonal analysis above, local variation of Slit levels in the epithelia appears not to modulate EE cell fate production. It is likely that the observed increase of 1.3–1.5× of EE cell density in Slit knockdown by Pros Voila ‐Gal4 and amonGal4 requires a loss of Slit throughout EE cells of the gut, perhaps suggestive of some more global level control of EE cells. It is also possible that ISCs could be controlled through neuronal Slit ligand production rather than local EE‐produced Slit. Alternatively, Slit/Robo2 signaling may be promoting EE cell delamination and death as recently described for tumorous cells of the wing disk (Vaughen & Igaki, 2016). Altogether, these data suggest that cell non‐autonomous compensatory feedback mechanisms do not promote EE fate regulation during homeostatic renewal. We therefore wanted to explore further intrinsic mechanisms controlling EE fate choice and how such mechanisms can lead to 20% of terminal cell fate decisions producing EE cells.
Figure 2. Slit/Robo pathway is not involved on local EE cell fate regulation.
-
A–DPosterior midguts containing 10 days AHS MARCM clones outlined with dotted lines (GFP, green; EE cells, Pros, red; DAPI, blue). Scale bar = 30 μm. No variation of EE density was observed in the clonal periphery or within the clones when comparing (A, A′) control MARCM clones with (B–C′) clones expressing two different RNAis against slit or (D, D′) clones expressing UAS‐slit.
-
E, FNumber of EE cells located in 30 μm around each clone normalized by clonal area (E) and clonal perimeter (F).
-
G–IQuantification of (G) the average number of EE cells per clone, (H) the percent of EE cells per clone, and (I) the global EE density measured in clonal and non‐clonal compartments in the different clonal condition.
Numb is required specifically for EE fate determination
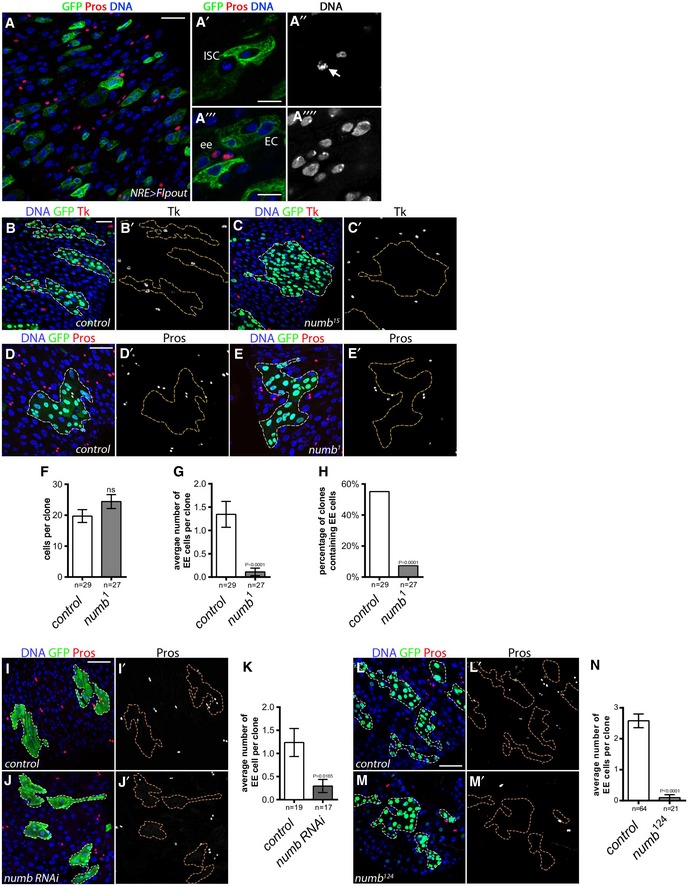
Notch pathway activation is thought to play a critical role in the choice between EC fate, requiring high Notch levels, and EE fate, which requires low or no Notch signaling (Micchelli & Perrimon, 2006; Ohlstein & Spradling, 2006, 2007; Perdigoto et al, 2011). We tested whether EE cells experience Notch activation using a “flip‐out” strategy to permanently mark cells that have activated the Notch pathway by using a Gal4 that responds to Notch transcriptional activity (NRE‐Gal4) (Zeng et al, 2010). In this system, Notch activation promotes Gal4‐driven expression of a Flippase, which then excises a transcriptional STOP cassette, thereby driving ubiquitous expression of GFP. We found that NRE‐Gal4 tracing with GFP marked EC cells, whereas EE cells were unmarked (Fig EV2A–A′′). Thus, we conclude that EE cells do not activate Notch transcriptional targets, which is consistent with the recently published work of others (Biteau & Jasper, 2014; Wang et al, 2014a; Beehler‐Evans & Micchelli, 2015). Our data are also consistent with previous genetic data showing that EE cells can be produced in the absence of Notch signaling and that activation of Notch signaling in ISCs drives their differentiation into EC cells (Micchelli & Perrimon, 2006; Ohlstein & Spradling, 2006). However, we cannot exclude that low levels of Notch activation are not detected by this reporter system or that there exists a rare subpopulation of EEs requiring Notch signaling, as previously reported (Beehler‐Evans & Micchelli, 2015). Interestingly, the mechanism keeping Notch signaling off when EE cells are produced and how this occurs in approximately 20% of terminally differentiating cells is unclear.
Figure EV2. Numb is required for EE fate.
-
ALineage tracing from Notch signaling‐activated cells using “Flp‐out” strategy: (A) UAS‐flippase under the control of a Notch response element (NRE)‐Gal4 triggered stable GFP expression from the “Flp‐out” cassette in cells where Notch pathway was active. After 5 days at 29°C, we observed that EE cells were never labeled by GFP suggesting that EE cells do not derive from a Notch active cell (GFP, green; EE cells marked by Pros, in red; DAPI, blue). (A′, A′′) Detail of a GFP‐negative dividing ISC. (A′′′, A′′′′) Detail of GFP‐negative EEs and GFP‐positive ECs. Scale bars = 20 μm (A), 10 μm (A′, A′′′).
-
B, C(B, B′) Tk‐positive cells were present in wild‐type clones at 10 days AHS MARCM (GFP, green; Tachykinin (Tk) staining, red; DAPI, blue, whereas (C, C′) Tk‐positive cells were absent in numb 15 mutant clones. Scale bar = 30 μm.
-
D, E(D, D′) EE cells were present in control clones at 5 days AHS, whereas (E, E′) EE cells are lost in numb 1 mutant clones (GFP, green; EE cells marked by Pros; DAPI, blue). Scale bar = 30 μm.
-
F–HQuantification of (F) the average clone size, (G) the average number of EE cells per clone, and (H) the percentage of clones that contained at least one EE cell. Results were compared using two‐tailed Mann–Whitney test for (F, G); and the Fisher's exact test for (H) (ns = non‐significant (P‐value indicated). The bars represent mean values ± SEM.
-
I, JControl (I) and numb RNAi (J) expressing clone made via heat‐shock‐induced excision of a stop cassette allowing Act‐Gal4‐driven RNAi expression (outlined GFP, green; EE cells marked by Pros; DAPI, blue). Scale bar = 30 μm.
-
KAverage number of EE cells per clone in wild‐type clones and clones expressing a numb RNAi. Results were compared using two‐tailed Mann–Whitney test (P‐value indicated). The bars represent mean values ± SEM.
-
L, M(L, L′) EE cells were present in control clones at 10 days AHS, whereas (M, M′) EE cells are lacking in numb 124 mutant clones (GFP, green; EE cells marked by Pros; DAPI, blue). Scale bar = 30 μm.
-
NAverage number of EE cells per clone in wild‐type clones and numb 124. Results were compared using a two‐tailed Mann–Whitney test. The bars represent mean values ± SEM.
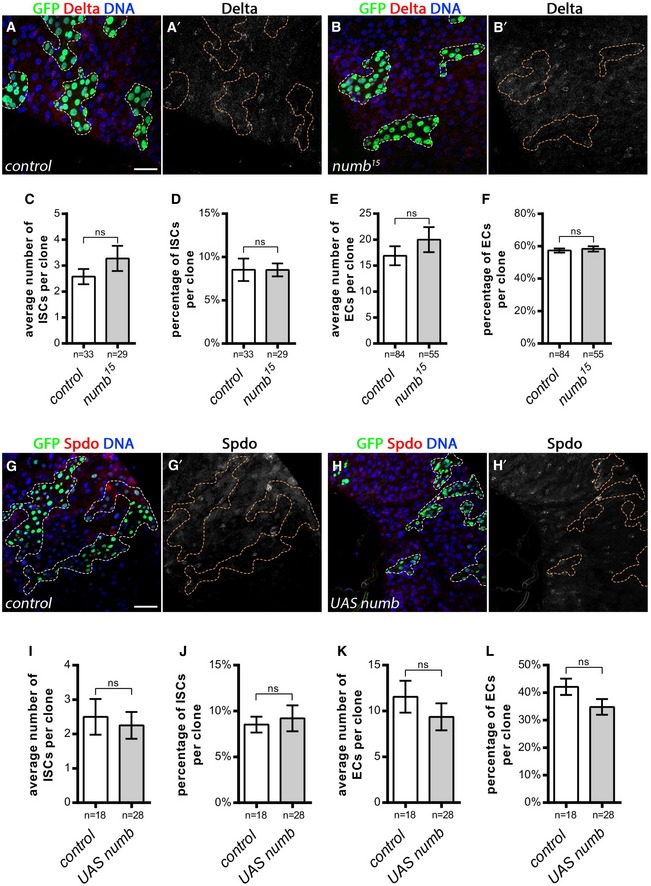
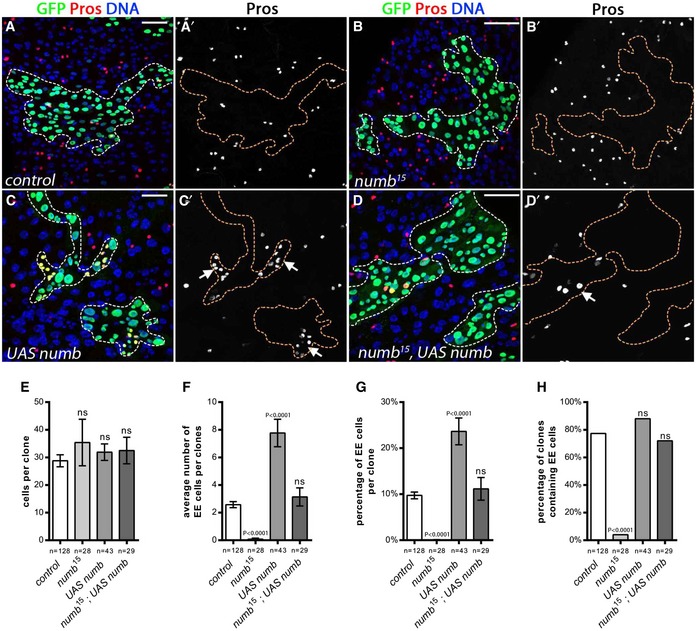
We then explored the hypothesis that the inhibition of the activity of Notch protein might be important for EE specification. Numb is a well‐described negative regulator of Notch during development controlling its endocytic trafficking (Uemura et al, 1989). Numb is thought to inhibit the recycling of Notch to the plasma membrane, thereby preventing its activation by ligands in neighboring cells [reviewed in Couturier et al (2013a)]. We and others had previously observed that numb was not essential for ISC fate (Fig EV3; Bardin et al, 2010; Goulas et al, 2012). Here, we tested whether it might be required for EE cell production. Wild‐type stem cell MARCM clones (Lee & Luo, 1999) 10 days after heat shock (AHS) contained on average 2.6 EE cells (Pros+ cells) per clone and 77% of clones contained at least one EE cell (Fig 3A, A′ and E–H). However, in numb 15 clones, we observed that EE cells were almost completely absent with 0.08 EE cells per clone on average. In addition, numb 15 clones had a strong reduction in percent of EEs per clone and contained only 4% of clones with EEs marked by Pros (Fig 3B, B′ and E–H), and similarly lacked Tachykinin (Tk) expressing EE cells (Veenstra et al, 2008; Fig EV2B–C′). Clone size, however, was not affected, though there was a slight increase in EC number per clone but it was not statistically significant (Figs 3E and EV3E). In addition, analysis of single‐cell numb 15 mutant clone indicated that there was a relative increase in EC cells, suggesting that EC cells are produced at the expense of EE cells in the absence of numb activity (see below and Fig 8N). Other alleles of numb (numb 1 and numb 124, see Materials and Methods) and Numb RNAi also showed a reduction in EE number, ranging phenotypically from very strong (numb 1 and numb 124), to more mild (RNAi) (Fig EV2D–N). Furthermore, the production of EE cells in numb 15 mutant clones was rescued by overexpression of numb cDNA (Fig 3C–H), indicating that this effect is due to altered numb activity. Thus, we conclude that numb is essential within the ISC lineage for EE cell production.
Figure EV3. ISCs and EC are present in numb mutant clones.
-
A, BISCs are present in control clones (A, A′) and numb 15 mutant clones (B, B′) at 10 days AHS (GFP, green; ISCs marked by Delta; DAPI, blue). Scale bar = 30 μm.
-
C–FQuantification of (C) the average number of ISCs per clone, (D) the percentage of ISCs per clone, (E) the average number of ECs per clone, and (F) the percentage of ECs per clone. Results were compared using a two‐tailed Mann–Whitney test [ns = non‐significant (P > 0.05)]. The bars represent mean values ± SEM.
-
G, HISCs are present in control clones (G, G′) and UAS‐numb expressing clones (H, H′) at 10 days AHS (GFP, green; ISCs marked by Sanpodo; DAPI, blue). Scale bar = 30 μm.
-
I–LQuantification of (I) the average number of ISCs per clone, (J) the percentage of ISCs per clone, (K) the average number of ECs per clone, and (L) the percentage of ECs per clone. Results were compared using a two‐tailed Mann–Whitney test (ns = non‐significant; P > 0.05). The bars represent mean values ± SEM.
Figure 3. Numb is required for EE fate determination in adult midgut.
-
A–D10 days AHS MARCM clones (GFP, in green; Pros, red or white as indicated; DAPI, blue) are outlined with dotted lines. (A, A′) Wild‐type clones contained EE cells. (B, B′) EE cells were lost in numb 15 mutant clones. (C, C′) EE cells were present upon expression of UAS‐numb. (D, D′) EE cells were present when UAS‐numb was expressed in numb 15.
-
E–HQuantification of (E) the average clone size, (F) the average number of EE cells per clone, and (G) the percentage of EE cells per clone, and (H) the percentage of clones that contained at least one EE cell. Results were compared using two‐tailed Mann–Whitney test for (E, F, G); and the Fisher's exact test for (H) (ns = non‐significant, P‐values indicated). The bars represent mean values ± SEM.
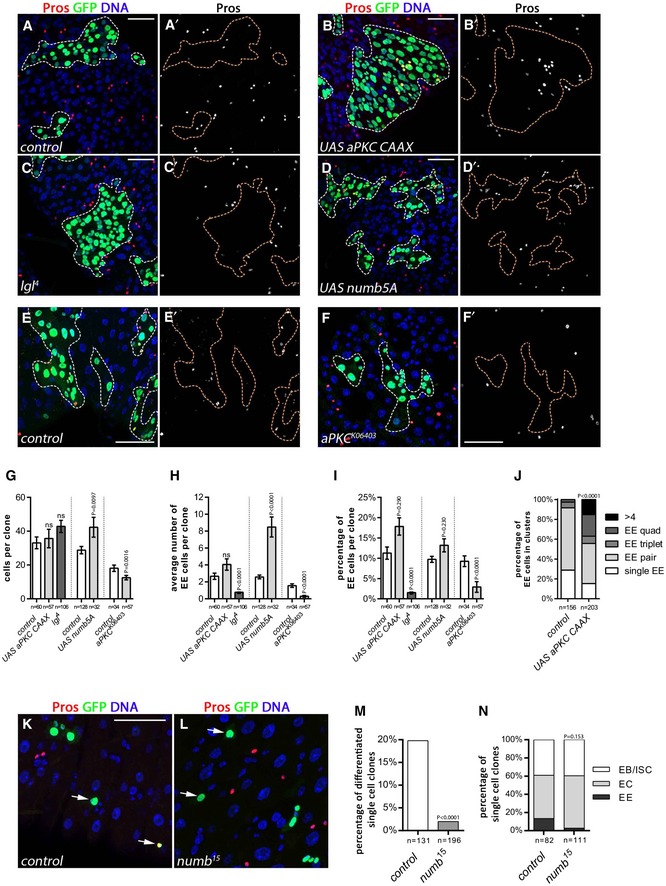
Figure 8. Modification of cell polarity factors alters EE fate decisions.
-
A–FMARCM clones (GFP, green, outlined; Pros, red; DAPI, blue) observed at 10 days AHS. (A, A′) Wild‐type control clones. (B, B′) Expression of UAS‐aPKC‐CAAX showed a slight increase in EE cells [quantified in (H) and (I)] and a significant increase in clusters of EE cells [quantified in (J)]. A large clone is shown for illustration. (C, C′) EE cells were diminished in lgl 4 mutant clones. (D, D′) Overexpression of UAS‐Numb5A promoted EE formation. (E, E′) Control clones for F, F′. (F, F′) aPKC 06403 mutant clones showed reduced EE cells. Scale bars = 30 μm.
-
G–JQuantification of: (G) the average clone size, (H) the average number of EE cells per clone, (I) the percentage of EE cells per clone, and (J) the percentage of EE clusters. The bars represent mean values ± SEM.
-
K–N3 days AHS single‐cell MARCM clones (GFP, green; Pros, red; DAPI, blue). Arrows show single‐cell clones. Scale bar = 20 μm. (K) In wild type, single‐cell EE clones were 20%, (L) whereas single‐cell clones in numb 15 mutant were only 2.6% EEs. (M) Quantification of the percentage of differentiated cells EEs in single‐cell clones. (N) Quantification of the total single‐cell clones.
Our data further indicated that Numb activity or levels may be limiting for EE cell production, as the overexpression of Numb was sufficient to induce the formation of extra EEs organized in clusters (Fig 3C and C′ arrows) and led to an increased number of EE cells per clone (2.6 EEs in wild type compared to 7.8 EEs per clone upon overexpression of Numb; Fig 3F). Therefore, Numb overexpression is sufficient to bias fate choice toward EE. Thus, our data indicated that while Numb is not necessary for ISC fate, it is required specifically for EE fate determination.
Numb segregates in asymmetric and symmetric modes
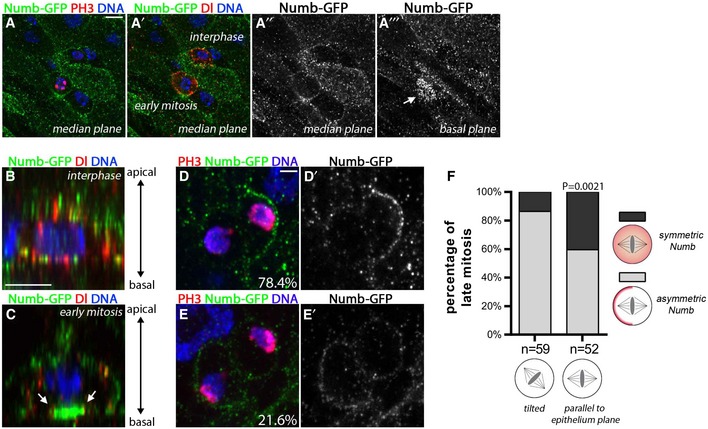
In the nervous system, Numb has an asymmetric distribution during progenitor cell mitosis (Rhyu et al, 1994) reviewed in Schweisguth (2015). We therefore wanted to test a potential link between Numb protein distribution and the cell fate regulation by examining Numb protein segregation during ISC divisions. Available antibodies were not sufficient to reliably detect specific signals in the intestine (not shown), which likely underlies the prior lack of ability to detect asymmetrically localized Numb (Bardin et al, 2010; Goulas et al, 2012). Full‐length, endogenous Numb distribution in the adult intestine has therefore not previously been assessed. Consequently, we analyzed the localization of a functional GFP‐tagged version of Numb (Numb‐GFP) under endogenous regulatory control (Couturier et al, 2013b). Numb‐GFP was detected in all the cells enriched at the cell membrane in the gut epithelium, similar to its broad expression in epithelial cells of the nervous system (Fig 4A–A′′′; Rhyu et al, 1994). In interphase, Numb‐GFP was detected at the plasma membrane and in puncta (Fig 4A–A′′ and B). During ISC early mitosis however, we observed that Numb‐GFP accumulated basally (Fig 4A′′′ and C arrow, and Movie EV1). Interestingly, this early asymmetric polarization was observed in 100% of cells in prophase, n = 119. However, by late mitosis, we observed that Numb‐GFP was symmetric in some cell divisions and asymmetric in others: Out of 116 observed cells in late mitosis (anaphase or telophase), 78.4% showed an asymmetric crescent of Numb‐GFP partitioning preferentially into one of the two future daughter cells (Fig 4D and D′, and Movie EV2). In the remaining 21.6% of divisions (25/116), Numb‐GFP asymmetry was not detected and the weak GFP signal appeared symmetrically distributed (Fig 4E and E′, and Movie EV3). Of note, divisions that were parallel to the epithelial plane were more likely to symmetrically segregate Numb‐GFP than those with a tilted axis (Fig 4F).
Figure 4. Numb segregates both asymmetrically and symmetric in dividing cells in the intestine.
-
A–CNumb‐GFP (green) was observed in all cells and showed a cytoplasmic and membrane localization [Numb‐GFP, green; PH3, red in (A); Dl, red in (A′); DAPI, blue]. In ISC early mitosis however, Numb‐GFP accumulated on the basal side of the cell [arrow in basal optical section in (A′′′)]. Scale bar = 5 μm. (B, C) Reconstructed lateral view of ISCs (Numb‐GFP, green; Dl, red; DAPI, blue). Scale bar = 5 μm. (B) In interphase, Numb‐GFP localized at the membrane and cytoplasm. (C) In early mitosis, Numb accumulated at the basal cortex (see arrows; see also Movie EV1).
-
D, ENumb‐GFP localized asymmetrically in 78% of the divisions, and symmetrically in 22% of the divisions (n = 102; Numb‐GFP, green; PH3, red; DAPI, blue; see also Movies EV2 and EV3).
-
FISC divisions with symmetric segregation of Numb were preferentially parallel to the epithelial plane, P = 0.0021, a χ2 test was used.
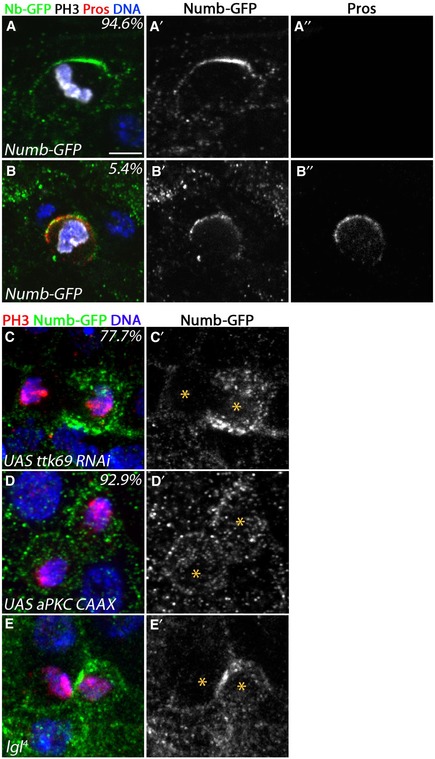
Work by others has demonstrated asymmetric segregation of Pros in larval ISC precursor cells and in 2% of dividing ISCs (Biteau & Jasper, 2014; Guo & Ohlstein, 2015), which was suggested to be important for eventual EE fate specification. We found no obvious correlations between Numb and Pros segregation in adult ISCs (Fig EV4A–B′). While we observed Pros expression in 13.5% of dividing cells (10/74 cells), asymmetric Pros segregation occurred in 6.8% (5/74 cells) of dividing cells. Pros and Numb‐GFP colocalized asymmetrically in 5.4% (4/74 cells) of the dividing cells. In addition, 5/74 of the dividing cells also had asymmetric Numb‐GFP with symmetric Pros in the future daughter cells. This lack of correlation would be expected if Numb and Pros acted at different times in subsequent cell cycles, for example.
Figure EV4. Numb segregation and Prospero segregation.
-
A, B(A–A′′) Prospero was absent in most divisions (94.6%) showing an asymmetric distribution of Numb‐GFP. (B–B′′) However in some divisions (5.4%), co‐localization with Numb‐GFP was observed (n = 74; Numb‐GFP, green in A and B, white in A′ and B′; Pros, red in A and B, white in A′′ and B′′; PH3, white; DAPI, blue). Scale bar = 2 μm.
-
CUpon expression of esgGal4, tub‐Gal80ts‐driven UAS‐ttk69‐RNAi, Numb‐GFP showed an asymmetric distribution in 77.7% of late anaphases (n = 9; PH3, red; Numb‐GFP, green in C, white in C′; DAPI, blue).
-
DUpon expression of esgGal4, tub‐Gal80ts‐driven UAS‐aPKC‐CAAX, Numb‐GFP showed symmetric distribution in 92.9% of late anaphases (n = 17; PH3, red; Numb‐GFP, green in D, white in D′; DAPI, blue).
-
EIn lgl 4 mutant clones, Numb‐GFP showed asymmetric distribution in 100% of late anaphases (n = 4; PH3, red; Numb‐GFP, green in E, white in E′; DAPI, blue).
While this is the first report of full‐length, endogenous Numb distribution in the adult intestine, it is consistent with previous reports of other asymmetrically localized constructs. These include the overexpression of the PTB domain of Numb (Goulas et al, 2012), overexpression of the Numb‐binding partner, PON (Kohlmaier et al, 2015), and Par6 under its endogenous promoter (a regulator of polarity); all have been reported to be approximately 80% asymmetric and 20% symmetric. Moreover, it is known that approximately 80% of asymmetric ISC divisions give rise to EC cells (Ohlstein & Spradling, 2007; Perdigoto et al, 2011) and see below (Fig 8M and N), which require Notch signaling and therefore may correspond to the 78% of divisions that we detected having asymmetric Numb. Presumably in divisions with asymmetric Numb, as suggested for the Numb‐PTB domain (Goulas et al, 2012), Numb segregates into the ISC, where Notch signaling remains off or low, though numb is not essential for ISC fate (Bardin et al, 2010; Fig EV3A–D). We hypothesize that the essential role of Numb in controlling EE fate is in the 22% of divisions with symmetrically inherited Numb. In these divisions, Numb could block Notch activity in both daughters allowing plasticity to generate an EE cell. This hypothesis is consistent with our genetic data above, which demonstrated that numb is essential for EE cell formation (Fig 3). Whether symmetric Numb inheritance could also promote the symmetric acquisition of ISC fate resulting in 2 ISCs daughters is unclear. However, we did not see an obvious decrease in clone size of the numb mutants, which might be expected if symmetric divisions were affected (Fig 3E).
Numb acts by altering Notch trafficking properties [reviewed in Schweisguth (2015)]. Therefore, differential symmetric or asymmetric segregation of Numb would be predicted to result in differential Notch subcellular localization and trafficking in daughter cells. We therefore further investigated how Notch protein was localized after ISC division. To do so, we used a previously characterized Notch‐GFP fusion BAC in which the intracellular domain of Notch is tagged by GFP (NiGFP) and accumulates in the nucleus upon Notch signaling activation (Couturier et al, 2012). NiGFP protein was frequently detected in pairs of cells in which 1 cell was an ISC (Dl+) and had vesicular NiGFP that did not accumulate within the nucleus and the other cell had detectable nuclear NiGFP (Fig 5A–A′′′). We interpret these cells as pairs of ISCs and EBs with nuclear NiGFP that are committed to EC cell fate. In all differentiated ECs labeled by Pdm1 expression (n = 68), NiGFP was not detected (Fig 5A–A′′′). While a majority of Pros+ EE cells did not express NiGFP (Fig 5B–B′′), we did observe that 20.7% of Pros+ cells expressed NiGFP (Fig 5C–C′′′′; n = 179). Of note, in this 20.7% of Pros+ cells, NiGFP did not localize in the nucleus and was only detected at the plasma membrane and in vesicles (Fig 5C–C′′′′), suggesting that Notch receptor activation does not occur in these cells. Furthermore, as 59% of these cells also co‐expressed Dl (Fig 5C and C′), they likely represent newly differentiated EEs recently made from ISCs and which still have Dl protein. Therefore, altogether our data demonstrate that Notch protein trafficking was found in both active and inactive states based on its nuclear and membrane location. Moreover, cells expressing EE markers showed only inactive Notch, present in trafficking vesicles and at the plasma membrane. Combined with our genetic data implicating Numb in EE fate and our observations of Numb symmetric distribution, these data suggest that Numb‐mediated inhibition of Notch through trafficking modulation drives EE fate specification.
Figure 5. The Notch receptor is not activated in EE precursors.
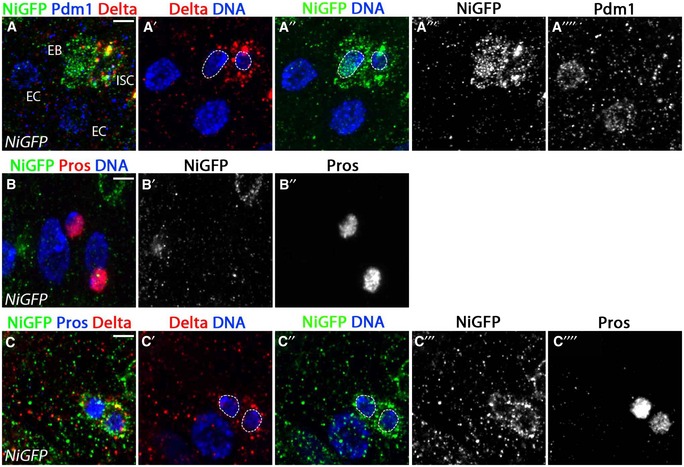
- ISCs (marked by Dl, red) showed NiGFP (green) localized in cytoplasmic vesicles, while in the adjacent presumptive EB cell, active cleaved NiGFP relocalized in the nucleus. NiGFP was not detected in ECs (polyploid Pdm1+, white, n = 68).
- A majority of EE cells (79.7% of Pros+ cells, n = 179) marked by Pros (red) did not express NiGFP (green).
- 20.3% of Pros+ cells co‐expressed NiGFP, though NiGFP remained cortical and did not show nuclear localization indicative of receptor activation. Of these, 59% (22/179 Pros+ cells) co‐expressed Dl (red). EE cells (Pros, white).
Numb promotes enteroendocrine fate by inhibiting Notch
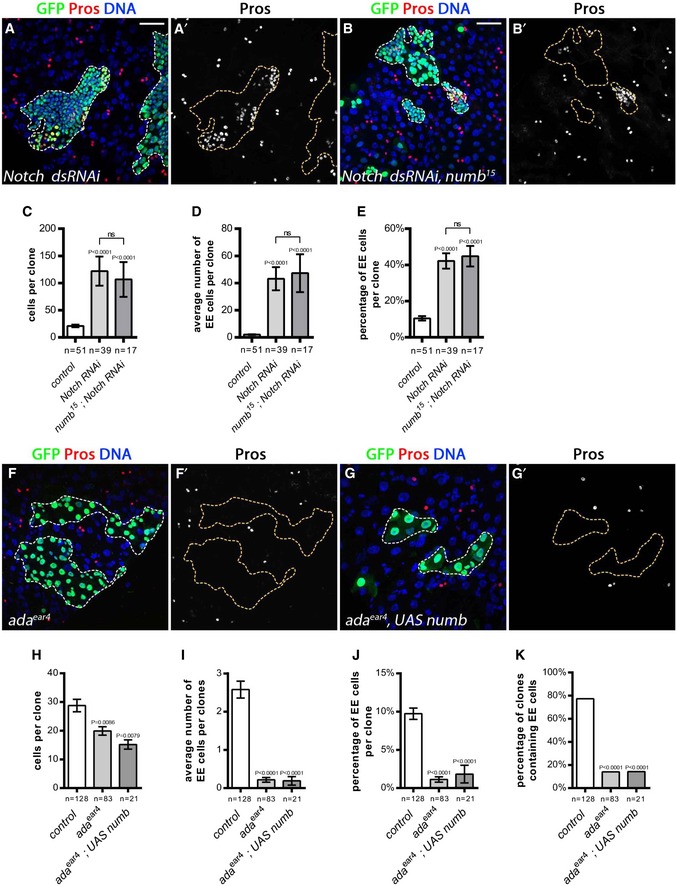
In the peripheral nervous system, Numb is thought to block the activity of Notch via its interaction with the adaptor‐related protein complex 2 (AP‐2 complex) component alpha‐adaptin (ada; Berdnik et al, 2002). We first confirmed that Numb acts through Notch signaling inhibition by testing whether Notch down‐regulation could rescue numb loss of function. As previously described (Micchelli & Perrimon, 2006; Ohlstein & Spradling, 2006), RNAi‐mediated Notch receptor depletion led to the ectopic accumulation of EE cells (Fig 6A, A′ and C–E). Interestingly, in numb mutant clones expressing Notch RNAi, EE cells were produced (Fig 6B–E), like the Notch RNAi on its own, indicating that Notch is epistatic to numb. These data suggest that when Notch signaling is blocked, Numb is dispensable for EE fate and support the idea that Numb acts to inhibit or lower Notch signaling, thereby driving EE cell fate specification.
Figure 6. Numb controls EE fate through Notch signaling inhibition.
-
A–K(A–B′; F–G′) 10 days AHS MARCM clones outlined with dotted lines (GFP, green; EE cells marked by Pros, in red or white as indicated; DAPI, blue). (A, A′) Notch RNAi resulted in extra EE cells. (B, B′) Similarly, a numb 15 mutant clone expressing Notch RNAi contained extra EE cells. Quantification of: (C) clone size, (D) the average number of EE cells per clone, and (E) the percentage of EE cells per clone. (F, F′) EE cells were greatly reduced in ada ear4 mutant clones. (G, G′) Expression of UAS‐numb did not promote EE cell production in ada ear4 mutant clones. Quantification of: (H) clone size, (I) the average number of EE cells per clone, (J) the percentage of EE cells per clone, and (K) and percentage of clones containing at least one EE cell.
We then examined whether Numb's function on EE fate also required the interaction with Ada. In clones homozygous for a mutated form of ada (ada ear4) unable to bind Numb (Berdnik et al, 2002), we observed a strong reduction in EE cell number with 0.2 EE cells per clone on average, and only 14% of the clones that contained EEs in ada mutants compared to 77% in wild‐type clones (Fig 6F, F′ and H–K). The ada ear4 mutation also resulted in smaller clones on average than wild type, suggestive of a role of AP‐2 in additional cellular trafficking events (Fig 6H). Further consistent with Numb acting via AP‐2 to promote EE fate, the ectopic expression of Numb was not able to rescue EE cell production in ada ear4 clones (Fig 6G–K) showing that the Numb‐AP2 interaction is required for EE fate acquisition. Rather surprisingly, we found that sanpodo, which has been proposed to act with Numb in the peripheral nervous system [reviewed in (Schweisguth, 2015)] and is expressed in the ISC (Perdigoto et al, 2011), had no obvious effect on EE fate acquisition or ISC fate (Appendix Fig S3A–F). This novel sanpodo‐independent activity of Numb may be due to differences in the dynamics of cell fate decisions during development versus in the adult. Overall, our data indicate an important function of Numb and AP‐2‐mediated endocytosis in EE fate acquisition.
Numb's essential function for EE fate choice is upstream or in parallel of known regulators
Our data suggest that Numb inhibition of Notch is an early event to discriminate EE versus EC fate and would predict that numb should act upstream or in parallel to previously described EE fate regulators. A number of transcription factors have been shown to be essential to correctly specify EE cell fate, including Scute, Prospero, and Ttk69 (Bardin et al, 2010; Amcheslavsky et al, 2014; Biteau & Jasper, 2014). Previous genetic data have suggested that Scute acts upstream of Prospero to promote EE fate, whereas Ttk69 seems to act in a parallel manner to inhibit EE fate (Wang et al, 2015; Zeng & Hou, 2015).
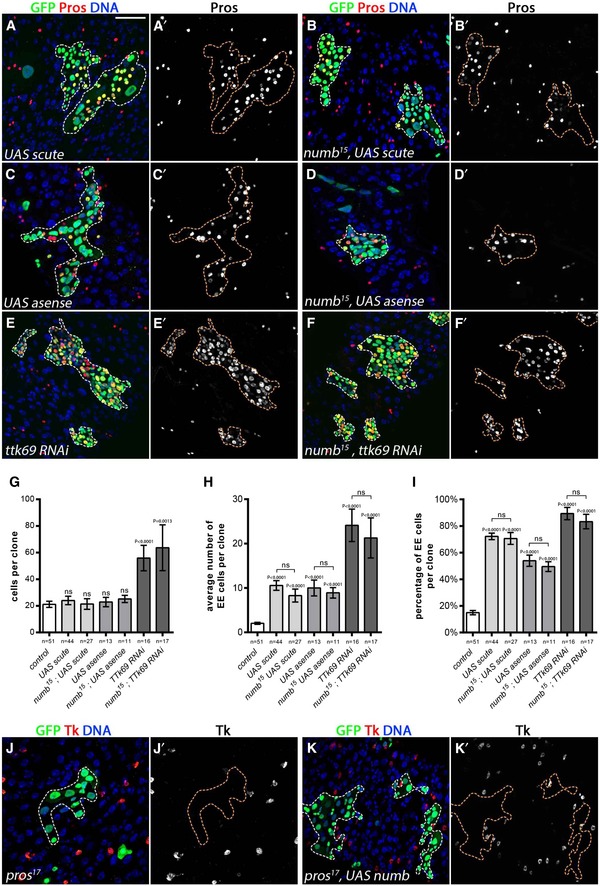
We therefore tested whether the overexpression of scute and its related factor asense could restore EE cells in numb mutants. Indeed, we observed that EE cells were produced when scute and asense were expressed in numb mutant clones (Fig 7A–D′ and G–I). Furthermore, while in both wild‐type and numb mutants, the overexpression of Numb resulted in EE cell production (Fig 3C–H), the expression of Numb could not rescue EE cell production in pros 17 clones as detected by Tk+ cells (Fig 7J–K′). Thus, numb acts upstream or in parallel of both scute and prospero in EE cell fate choice.
Figure 7. Numb is an upstream regulator of EE fate determination.
-
A–K(A–F′, J–K′) 10 days AHS MARCM clones (GFP, in green) outlined with dotted lines; Pros, red or white as indicated or otherwise specified; DAPI, blue). (A, A′) EE cells were formed upon UAS‐scute expression and (B, B′) when UAS‐scute was expressed in numb 15 mutant clones. (C, C′) Similarly, UAS‐asense promoted EE cell formation in wild‐type or (D, D′) in UAS‐asense, numb 15 mutant clones. (E, E′) Ttk69 RNAi produced ectopic EE cells alone as well as (F, F′) in combination with numb 15 mutant. Quantification of (G) cells per clone, (H) average number of EE cells per clone, and (I) percentage of EE cells per clone. EE cells (marked by Tk in red or white) were lost in pros 17 mutant clones, (J, J′) The expression of UAS‐numb failed to promote EE cells in pros 17 mutant clones (Tk, red or white in F′). (K, K′) Extra EE cells were formed upon ttk69 RNAi expression. (F, F′) Likewise, ttk69 RNAi expression promoted EE fate in numb 15 mutant clones.
We then assessed whether inactivation of ttk69 could restore EE cell fate production in numb mutants. Consistent with Wang and colleagues’ results (Wang et al, 2015), we observed that expression of ttk69 RNAi resulted in clones composed almost exclusively of Prospero‐positive EE cells (Fig 7E, E′ and G–I). Similarly, numb 15 clones expressing ttk69 RNAi also showed a large surplus of Prospero‐positive EE cells (Fig 7F, F′ and G–I), indicating that numb is not required in the absence of ttk69 activity to produce EE cells. We also determined that Numb‐GFP segregation was not altered in esg>ttk69 RNAi, suggesting that Ttk69 is not acting upstream of Numb localization (Fig EV4C and C′). Altogether, our data indicate that numb acts upstream of or in parallel to previously described regulators of EE fate. We propose that Numb acts to block Notch, allowing Scute and/or Ase expression, thereby driving Pros expression and EE fate acquisition.
Altering cell polarity can affect EE cell fate acquisition
If symmetric Numb inheritance biases cell fate decisions toward producing an EE daughter cell, then altering inheritance might affect EE cell fate decisions. Extensive work on neuroblasts and sensory organ precursor cells has provided an understanding of molecular events leading to Numb asymmetry and has established a number of genetic tools, which modify Numb segregation. During neuroblast and SOP division, the atypical protein kinase C (aPKC) is thought to phosphorylate Numb leading to its delocalization from the cell cortex in an asymmetric manner (Betschinger et al, 2003; Smith et al, 2007; Wirtz‐Peitz et al, 2008). In contrast, overexpression of a membrane‐tethered form of aPKC (aPKCcaax) caused Numb to be symmetrically distributed in a majority (but not all) of the divisions of the neuroblast and sensory organ precursor (Wirtz‐Peitz et al, 2008). Consistent with this, we observed that esg>aPKC‐CAAX expression caused vesicular and cortical subcellular localization of Numb‐GFP and its symmetric distribution in 92% of the observed anaphases in the ISC (Fig EV4D and D′), similar to findings reported for a truncated overexpressed version of Numb (Goulas et al, 2012).
We therefore tested the effect of this on EE cell fate acquisition using clonal expression of aPKC‐CAAX. We observed a mild increase in the average number of EE cells per clone upon aPKC‐CAAX expression (Fig 8B, B′ and H; 4.8 for aPKC‐CAAX vs. 3.3 for wild type), though the difference was not statistically significant. However, a significant increase was observed in the percentage of EE cells per clonal cells in aPKC‐CAAX expressing clones (17.1%) compared to wild‐type controls (9.7%), while clone size was not affected (Fig 8G and I). Furthermore, while in wild‐type clones, EE cells were primarily observed as single EE cells or in pairs, upon expression of aPKC‐CAAX, we observed an increased number of clusters of EE cells, with 5.7% of triplets, 11.4% quadruplets and 5.6% > 4 indicating altered EE fate acquisition (Fig 8J). A similar EE clustering phenotype had also been detected upon UAS‐Numb expression (Fig 3C and C′). These data are consistent with the hypothesis that aPKC mediated phosphorylation can act to regulate EE fate. Here, we observed a phenotype similar to Numb overexpression, suggesting that in this context Numb is active in both daughter cells in the intestine and that inheriting half the amount of Numb is sufficient to promote EE fate. In contrast, the inactivation of aPKC had the opposite phenotype with a decrease in EE cells from 1.6 EEs per clone in controls representing 9.8% of cells to 0.3 EEs per clone in aPKC K06403 mutant clones representing 2.9% of cells (Fig 8E–I). Large polyploid ECs were still produced (Fig 8F).
We further tested a role of polarity on EE cell fate by examining the phenotype of lethal (2) giant larvae (lgl), encoding for Lgl having important roles in organizing cell polarity during asymmetric cell division (Ohshiro et al, 2000; Peng et al, 2000). Lgl is required for timely activation of the aPKC complex and likely also plays a role in activating Numb's endocytic function (Langevin et al, 2005; Nishimura & Kaibuchi, 2007; Wirtz‐Peitz et al, 2008). Of note, in sensory organ precursor cells and neuroblasts, while asymmetric Numb localization in early Mitosis does not occur, asymmetric telophase segregation is unaffected. However, lgl and numb both similarly affect cell fate decisions, indicating that the activity of Numb is abrogated (Langevin et al, 2005; Nishimura & Kaibuchi, 2007; Wirtz‐Peitz et al, 2008). Consistent with Numb being inactive, we find that lgl 4 had greatly reduced average EE number per clone with 1.1 compared to 3.3 in wild type, and also a reduction in the percentage of EE cells per clone with only 1.8% compared to 10.2% in wild type (Fig 8C, C′ and G–I). In contrast, large polyploid ECs were present in lgl 4 mutant clones (Fig 8C). Our data therefore indicate that Lgl is important for EE fate. Lgl and aPKC have many cellular functions, and additional roles on factors other than Numb cannot be excluded. However, combined with data above on numb's function in EE specification and symmetric inheritance, these findings suggest that cell polarity during division can influence Numb inheritance and promote EE cell fate (see Discussion).
Finally, we tested the effect of overexpression of a form of Numb mutated for some aPKC phosphorylation sites, leading to symmetric segregation in the SOP cell (Smith et al, 2007). We found an increase in EE cells per clone (Fig 8D, D′ and G–I), similar to overexpression of Numb (Fig 3C and E–H).
De novo synthesis of Numb is also required in the differentiating EE cell
We next tested whether the inherited pool of Numb was sufficient to regulate EE cell fate decisions. To our knowledge, this has never been tested in the nervous system. To do so, we examined single‐cell wild‐type and numb mutant clones arising after mitotic recombination using the MARCM system. The resulting numb mutant cell should inherit wild‐type Numb protein from its mother. If this pool of protein is sufficient, the genotype of the daughter cell should be irrelevant and both wild‐type and numb mutant cells should be capable of EE terminal differentiation. As expected for wild‐type control single‐cell clones, terminally differentiated cells were 80.2% ECs and 19.8% EEs (Fig 8K and M). In contrast, numb 15 single‐cell clones were almost exclusively EC cells and EE cells were almost completely lost, representing only 2.6% of terminally differentiated cells (Fig 8L and M). Moreover, while the number of single‐cell ISCs/EBs remains constant in numb mutants, the EC number increases at the expense of the EE cells (Fig 8N). Therefore, we conclude that de novo synthesis of Numb protein occurs in the differentiating cell and that this pool of Numb is also required for terminal EE cell fate acquisition. Furthermore, our analysis suggested that without Numb the would‐be EE cells acquired EC fate. Thus, these data along with the data presented above demonstrate that while modulation of aPKC and Lgl can bias fate homeostasis most likely through the regulation of Numb localization and/or activity; Numb is also required post‐mitotically and cell‐autonomously to promote EE fate determination.
Discussion
In this study, our data argue against a major contribution of cell‐extrinsic feedback cues to regulate EE specification during routine homeostasis and identify Numb as a critical cell‐intrinsic EE fate regulator. Interestingly, we observed that Numb segregated asymmetrically in approximately 80% of cell divisions and symmetrically in 20% of cell divisions (see Model in Fig 9A and B). Consistent with regulation of Notch trafficking by Numb in developing EE cells, a GFP‐tagged Notch was shown to be in vesicles at the plasma membrane in Pros+ cells, whereas it was accumulated in the nucleus of presumptive pre‐ECs. Our data further suggested that Numb functions with the AP‐2 component alpha‐adaptin and acts upstream of or in parallel to scute, prospero, and ttk69 to inhibit Notch activity in precursor cells, allowing them to adopt an EE cell fate (Fig 9B). The manipulation of cell polarity cues known to alter Numb segregation and activity led to alterations in EE cell fate acquisition. We believe that symmetric Numb segregation may bias initial fate decisions, but our data also demonstrated that differentiating cells acquiring EE fate also required de novo Numb protein synthesis and activity.
Figure 9. A model for Numb promoting fate plasticity and controlling EE fate acquisition.
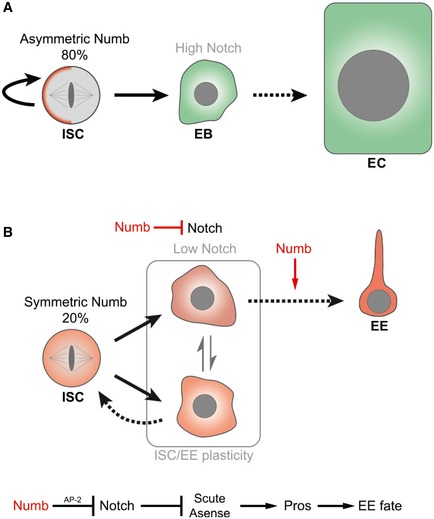
- In 80% of ISC divisions, Numb was found to be asymmetrically distributed. We hypothesize that the Notch pathway is activated in the cell that does not inherit Numb and which differentiates into an enterocyte. Furthermore, we propose that the cell inheriting Numb does not activate the Notch pathway and likely remains an ISC. Of note, we previously demonstrated that numb is not essential for ISC fate acquisition or maintenance or EC fate (Fig EV3 and Bardin et al, 2010).
- In 20% of ISC divisions, Numb is segregated symmetrically in the two daughter cells. We hypothesize that Notch activity is inhibited by Numb in the two daughter cells maintaining them in a plastic state capable of ISC and EE fate. The symmetrically segregated pool of Numb likely biases fate decisions by lowering Notch activity, but Numb expression must also be maintained to for EE terminal differentiation. Our genetic data suggest that Numb inhibits Notch through its interaction with the AP‐2 complex. Inactivation of Notch drives expression of the proneural genes Scute and Asense, which, in turn, promote Pros expression and EE fate acquisition. Parallel action of these genes cannot be ruled out. Ttk69 is also required to block EE fate (Wang et al, 2015).
Previous studies by Zeng and Hou suggested that EE cells can be generated from ISCs via three different paths (Zeng & Hou, 2015): (i) The ISC divides and produces 2 EEs; (ii) the ISC divides to give rise to one self‐renewed ISC and 1 EE; and (iii) the ISC directly differentiates of into an EE, which seems to be a primary path toward EE cell fate (Zeng & Hou, 2015). We propose that Numb activity is required in the stem cell daughters to keep Notch signaling OFF, therefore promotes Scute expression endowing these cells with plasticity to either remain ISCs or differentiate into EEs (Fig 9B). How ISC/EE fate is further resolved is unclear, though may rely on additional feedback control of Scute protein levels previously described for bHLH factors (Quan et al, 2016). The concept of ISC/EE plasticity in conditions of low Notch is supported by the phenotype detected upon Notch inactivation in ISCs, which results in the accumulation of clusters of ISC‐like and EE‐like cells (Micchelli & Perrimon, 2006; Ohlstein & Spradling, 2006), and can arise from a single Notch mutant stem cell (Siudeja et al, 2015). In addition, we believe that the direct differentiation of ISCs into EEs previously described by Zeng and Hou must also require numb, as our data suggest that single‐cell numb clones fail to differentiate into EEs.
Our findings indicate that polarity cues can also impact Numb segregation during cell division and affect EE cell fate determination. The forced expression of aPKCcaax, which renders Numb symmetric, led to a mild increase in EE cells, whereas the inactivation aPKC inactivation has the opposite effect. Moreover, expression of UAS‐Numb and UAS‐Numb‐5A, a form mutant for some aPKC phosphorylation sites that promotes symmetric Numb segregation in the SOP (Smith et al, 2007), resulted in additional EE cells. In addition to affecting Numb segregation, Numb phosphorylation and possibly activity are also altered by aPKC phosphorylation (Betschinger et al, 2003; Smith et al, 2007; Wirtz‐Peitz et al, 2008). Interestingly, lgl mutant clones also show a loss of EE cells, consistent with published data that lgl and numb have the same phenotypes in the nervous system and that lgl has additional roles controlling Numb activity (Langevin et al, 2005; Nishimura & Kaibuchi, 2007; Wirtz‐Peitz et al, 2008). Thus, we hypothesize that an initial bias in Numb inheritance can initiate inactivation of Notch signaling; however, our data also indicate that de novo synthesis of Numb in the differentiating daughter cell is critical for EE cell fate acquisition. Furthermore, polarity cues presumably would act on EE fates that arise after ISC cell division and perhaps not when an ISC directly differentiates into an EE. Thus, alteration of the inherited pool may only produce subtle defects in EE fate specification.
Interestingly, our data here and our previous data (Bardin et al, 2010) indicate that numb is not essential for ISC cell fate establishment or maintenance despite being asymmetrically segregated in a majority of ISC divisions. How then is Notch signaling kept off or low in the ISC to prevent its differentiation and how is a biased asymmetric fate outcome established? It is possible that Numb might normally bias this decision, while additional mechanisms may promote ISC in numb mutant clones. However, clearly additional mechanisms exist to regulate this important fate decision. One such mechanism is the asymmetric secretion of Bmp ligands on the basal side of the EC cells has been shown to inhibit Notch signaling in the most basal daughter cell (Tian & Jiang, 2014; Tian et al, 2017). It is also likely that feedback mechanisms described during lateral inhibition in the nervous system act to amplify Notch signaling differences between the two ISC daughter cells. Consistent with this, we have previously shown that Notch target genes of the E(spl) family are critical to limit ISC fate specification (Bardin et al, 2010). In addition, control of trafficking and activity of Delta and Notch through Sara endosomes (Montagne & Gonzalez‐Gaitan, 2014) as well as addition mechanisms probably act redundantly to ensure ISC maintenance.
Our data also challenge the idea that the decision to produce EE cells is regulated by local feedback. First, we found no alteration surrounding clones in which EE cells were locally depleted through killing by Pros>reaper. Similarly, we failed to find a local modification of EE density surrounding regions in which supernumerary EE cells were produced or a global decrease at the whole‐tissue level. We further found no change in EE density upon clonal gain or loss of the ligand Slit, which has been proposed to control EE fate via feedback (Biteau & Jasper, 2014; Zeng et al, 2015). Our knockdown of Slit using Pros Voila Gal4 also resulted in a mild 1.3× increase in EE cell density corroborating previous findings (Biteau & Jasper, 2014; Zeng et al, 2015). Different scenarios could account for the lack of local effect of clonal alteration of Slit levels on EE cells and the mild 1.3–1.5× increase in EE cell density when Slit signaling is knocked down globally in EE cells with Pros Voila Gal4 and amonGal4. It is possible that Slit has a more global function to buffer EE levels without controlling cell fate decisions locally. Alternatively, neuronal derived Slit also targeted by EE Gal4 drivers could subtly regulate EE numbers. Finally, Slit/Robo2 signaling has recently been shown to play a role in cell delamination and death (Vaughen & Igaki, 2016), which may contribute to the altered EE numbers.
If local feedback signaling from EE cells does not control EC versus EE terminal cell fate in the ISC lineage, then how is the homeostatic balance regulated? Our data highlight the important role played by cell‐intrinsic control of EE cell fate via Numb. We observed that the upstream regulators of Numb, aPKC, and Lgl can impact EE fate acquisition, albeit mildly in the case of aPKCcaax overexpression. Our data support the notion that EE fate choice is largely cell‐ or lineage‐intrinsic without major extrinsic feedback. It is also possible that tissue‐wide or systemic mechanisms might somehow contribute to extrinsic feedback regulation. However, this is difficult to reconcile with our experiments showing the lack of global effect throughout the tissue in context of large numbers of extra EEs. Moreover, it is also challenging to conceive of how tissue‐wide or systemic signals could fine‐tune local densities of differentiated cells within the tissue. It is possible that a biased, stochastic fate choice maintains the correct ratio of 20% EE to 80% ECs. While the exact mechanism by which this is achieved is not currently clear, it could be governed by a stochastic process similar to that at work in the retina producing the 30/70 ratio of Rh3 to RH4+ R7 photoreceptor cells (Wernet et al, 2006). A biased stochastic mechanism would automatically account for correct cell fate balance when stem cell proliferation rates are increased upon stress. Consistent with this, the ratio of newly produced EE to EC is unchanged in poor or rich diet (Choi et al, 2011). Similarly, the cell proportions were not altered upon regeneration in response to Pseudomonas entomophila infection (Jiang et al, 2009).
Numb has recently been demonstrated to segregate symmetrically and asymmetrically in wild‐type mouse crypts (Bellis et al, 2012) and in human colon cancer initiating cells where its inheritance correlates with cell differentiation and levels of Notch1 protein (O'Brien et al, 2012; Bu et al, 2016). Consistent with a role in differentiated cells in the mouse intestinal crypt, under normal homeostatic conditions, Numb expression is low in Lgr5+ stem cells and becomes more highly expressed in differentiated cells (Bu et al, 2016). In cell lines derived from human colon cancer, the knockdown of Numb leads to increase Notch target gene activation and a decrease in secretory goblet cells (Yang et al, 2011). This raises the possibility that Numb may have a conserved function regulating Notch signaling and secretory cell fate in the mammalian intestine and merits being rigorously tested genetically in the mouse.
Materials and Methods
Drosophila stocks
Flies were kept in yeasted tubes at 25°C unless specified. The following mutant alleles have been used: numb 15 (a clean version made from the original numb 15 line (Berdnik et al, 2002) that contained a mutation in the fat gene), numb 1 (Uemura et al, 1989), alpha‐adaptin ear4 (Berdnik et al, 2002), lgl 4 (Mechler et al, 1985), pros 17 (Doe et al, 1991), spdo G104 (O'Connor‐Giles & Skeath, 2003). The following transgenic constructs have been used: NRE‐GAL4 (Zeng et al, 2010), UAS‐numb‐myc (Yaich et al, 1998); pros V1 ‐GAL4 (Balakireva et al, 1998); Dl‐Gal4; esg‐GAL4, Su(H)GBE‐GAL80 pTub‐GAL80 ts (Wang et al, 2014b); PBac[numb::GFP] (Couturier et al, 2013b); w, N 55e11 ; P[mw,NeurH2B::RFP], M[x3P3‐RFP DP(1.2)NotchGFP] (Couturier et al, 2012); w; P[mw,UAS‐aPKC‐CAAX] (Sotillos et al, 2004), aPKCk06403 (Rolls et al, 2003), Numb‐5A (Smith et al, 2007). The lines UAS‐rpr (BL#5823), UAS‐Slit (BL#6472), UAS‐Numb RNAi (BL#31182 TRIP‐JF01695), UAS‐slitRNAi JF01228 (BL#31467), UAS‐slitRNAi JF01229 (BL#31468), and UAS‐ttkRNAi (BL#11358) lines are from Bloomington stock center; UAS‐scute and UAS‐asense lines are from FlyORF stock center.
The numb 124 allele was generated by CRISPR engineering using two guide RNAs (numb1: GCAGCGATTGCGGGGTCACC, and numb2: GCAGCCAAATGTCGCCTAC approximately 4 kb apart). Injection done at Bestgene, Inc. PCR screening revealed that line 124 and removed a large portion of the protein coding exons between sequences AAATGTTCAGTTCGGCAGCCAAATGTCGCC and ACCAGGGGGACAAAGTGTGGTTCGC. Its lethality was tested in complementation with numb 15.
Clonal analysis
MARCM clones (Lee & Luo, 1999) were generated using the X chromosome y,w P[hs‐Flp] P[pTub‐GAL4] P[UAS‐nlsGFP] associated either with FRT40A P[pTub‐GAL80] or FRT82B P[pTub‐GAL80] on the second and third chromosome, respectively. Clones were induced with a heat shock (40 min at 36.5°C) in 3‐day‐old females and were analyzed 3 days (for single‐cell clones), 5 days, or 10 days (for stem cell clones) after heat shock. Negatively marked clones were generated in flies with the following genotypes: P[hs‐Flp]/UAS‐rpr; FRT40A P[pTub‐GAL80], P[ubi‐RFPnuc]/FRT40A; pros V1 ‐Gal4 for EE depletion or with P[hs‐Flp]/UAS‐rpr; FRT40A P[pTub‐GAL80], P[ubi‐RFPnuc]/FRT40A iso 2 for negative control. Negatively marked clones were induced in 3‐day‐old females with two heat shocks (30 min at 36.5°C) separated by 8 h and analyzed after 10 days. Analysis was restricted to intestines where clones were covering at least 10% of the total epithelium area. The Flp‐out experiment was carried out in flies with the following genotype: Su(H)GBE‐Gal4, UAS‐GFP/pAct5C‐FRT‐CD2‐FRT‐GAL4; pTub‐Gal80 ts. Clones were induced with a heat shock (40 min at 36.5°C) in 3‐day‐old females and were analyzed 5 days after heat shock. EE cells were counted per square region from 2 to 3 regions within the posterior midgut for Appendix Fig S2A–C. N in experiments is the number of clones, except in Figs 1G and 2H where it is the number of whole guts.
Immunostaining and imaging
Adult female intestines were dissected and immunofluorescence performed as previously described (Bardin et al, 2010). Primary antibodies were incubated during 4 h at room temperature or overnight at 4°C. The following primary antibodies were used: mouse anti‐Slit (C555.6D, 1:100, DSHB), mouse anti‐Delta (C594‐9B; 1:2,000, DSHB), rabbit anti‐Spdo (1:1,000, J. Skeath), mouse anti‐Pros (MR1A; 1:1,000; DSHB), guinea pig anti‐Pros (1:500, YN Jan), rabbit anti‐PH3 (1:1,000, Millipore), chicken anti‐GFP (1:2,000; AbCam), rabbit anti‐Tachykinin (lokustatachykinin, 1:1,000, J. Veenstra), rabbit anti‐Pdm1 (1:1,000; X. Yang). Samples were imaged using Zeiss LSM700 and LSM780 confocal microscopes at the Curie Institute imaging facility. Resulting data were processed using ImageJ and assembled using Adobe Photoshop. High magnification images were processed with a median filter of 1 pixel width, and low magnification images in Figs 1 and EV1 were stitched together using Zen software.
Author contributions
JS and AJB conceived the study and designed experiments. JS did a majority of experiments. LG, BB, MS, and KS performed additional experiments. JS and AJB analyzed the data and wrote the manuscript.
Conflict of interest
The authors declare that they have no conflict of interest.
Supporting information
Appendix
Expanded View Figures PDF
Movie EV1
Movie EV2
Movie EV3
Review Process File
Acknowledgements
We would like to thank: members of the Bardin laboratory, F. Schweisguth, Y. Bellaiche, and L. O'Brien for comments on the manuscript and for fly reagents. We thank Patricia Skorski for technical help generating the numb 124 mutant line. The Bardin laboratory is supported by project grants to AB: the 2017 Prize from the Fondation Schlumberger (FSER), Worldwide Cancer Research, ATIP‐AVENIR, La Ligue Contre le Cancer, and the Fondation ARC, the Charge Syndrome Foundation, the labelization of the Fondation pour la Recherche Medicale as well as funding from the program “Investissements d'Avenir” launched by the French Government and implemented by ANR, references: ANR SoMuSeq‐STEM (A.B), Labex DEEP (ANR‐11‐LBX‐0044) and IDEX PSL (ANR‐10‐IDEX‐0001‐02 PSL). We acknowledge the Cell and Tissue Imaging Platform of the Genetics and Developmental Biology Department (UMR3215/U934) of Institut Curie, member of France‐Bio imaging (ANR‐10‐INSB‐04), with support from FSER (prize 2009, J‐R Huynh), for help with confocal microscopy.
The EMBO Journal (2017) 36: 1928–1945
References
- Amcheslavsky A, Song W, Li Q, Nie Y, Bragatto I, Ferrandon D, Perrimon N, Ip YT (2014) Enteroendocrine cells support intestinal stem‐cell‐mediated homeostasis in Drosophila . Cell Rep 9: 32–39 [DOI] [PMC free article] [PubMed] [Google Scholar]
- Balakireva M, Stocker RF, Gendre N, Ferveur JF (1998) Voila, a new Drosophila courtship variant that affects the nervous system: behavioral, neural, and genetic characterization. J Neurosci 18: 4335–4343 [DOI] [PMC free article] [PubMed] [Google Scholar]
- Bardin AJ, Perdigoto CN, Southall TD, Brand AH, Schweisguth F (2010) Transcriptional control of stem cell maintenance in the Drosophila intestine. Development 137: 715–724 [DOI] [PMC free article] [PubMed] [Google Scholar]
- Beehler‐Evans R, Micchelli CA (2015) Generation of enteroendocrine cell diversity in midgut stem cell lineages. Development 142: 654–664 [DOI] [PMC free article] [PubMed] [Google Scholar]
- Bellis J, Duluc I, Romagnolo B, Perret C, Faux MC, Dujardin D, Formstone C, Lightowler S, Ramsay RG, Freund JN, De Mey JR (2012) The tumor suppressor Apc controls planar cell polarities central to gut homeostasis. J Cell Biol 198: 331–341 [DOI] [PMC free article] [PubMed] [Google Scholar]
- Berdnik D, Torok T, Gonzalez‐Gaitan M, Knoblich JA (2002) The endocytic protein alpha‐Adaptin is required for numb‐mediated asymmetric cell division in Drosophila . Dev Cell 3: 221–231 [DOI] [PubMed] [Google Scholar]
- Betschinger J, Mechtler K, Knoblich JA (2003) The Par complex directs asymmetric cell division by phosphorylating the cytoskeletal protein Lgl. Nature 422: 326–330 [DOI] [PubMed] [Google Scholar]
- Biteau B, Jasper H (2014) Slit/Robo signaling regulates cell fate decisions in the intestinal stem cell lineage of Drosophila . Cell Rep 7: 1867–1875 [DOI] [PMC free article] [PubMed] [Google Scholar]
- Bu P, Wang L, Chen KY, Srinivasan T, Murthy PK, Tung KL, Varanko AK, Chen HJ, Ai Y, King S, Lipkin SM, Shen X (2016) A miR‐34a‐Numb feedforward loop triggered by inflammation regulates asymmetric stem cell division in intestine and colon cancer. Cell Stem Cell 18: 189–202 [DOI] [PMC free article] [PubMed] [Google Scholar]
- Choi NH, Lucchetta E, Ohlstein B (2011) Nonautonomous regulation of Drosophila midgut stem cell proliferation by the insulin‐signaling pathway. Proc Natl Acad Sci USA 108: 18702–18707 [DOI] [PMC free article] [PubMed] [Google Scholar]
- Couturier L, Vodovar N, Schweisguth F (2012) Endocytosis by Numb breaks Notch symmetry at cytokinesis. Nat Cell Biol 14: 131–139 [DOI] [PubMed] [Google Scholar]
- Couturier L, Mazouni K, Schweisguth F (2013a) Inhibition of Notch recycling by Numb: relevance and mechanism(s). Cell Cycle 12: 1647–1648 [DOI] [PubMed] [Google Scholar]
- Couturier L, Mazouni K, Schweisguth F (2013b) Numb localizes at endosomes and controls the endosomal sorting of notch after asymmetric division in Drosophila . Curr Biol 23: 588–593 [DOI] [PubMed] [Google Scholar]
- Doe CQ, Chu‐LaGraff Q, Wright DM, Scott MP (1991) The prospero gene specifies cell fates in the Drosophila central nervous system. Cell 65: 451–464 [DOI] [PubMed] [Google Scholar]
- Fre S, Bardin A, Robine S, Louvard D (2011) Notch signaling in intestinal homeostasis across species: the cases of Drosophila, Zebrafish and the mouse. Exp Cell Res 317: 2740–2747 [DOI] [PubMed] [Google Scholar]
- Goulas S, Conder R, Knoblich JA (2012) The par complex and integrins direct asymmetric cell division in adult intestinal stem cells. Cell Stem Cell 11: 529–540 [DOI] [PMC free article] [PubMed] [Google Scholar]
- Guo Z, Ohlstein B (2015) Stem cell regulation. Bidirectional Notch signaling regulates Drosophila intestinal stem cell multipotency. Science 350: aab0988 [DOI] [PMC free article] [PubMed] [Google Scholar]
- Jiang H, Patel PH, Kohlmaier A, Grenley MO, McEwen DG, Edgar BA (2009) Cytokine/Jak/Stat signaling mediates regeneration and homeostasis in the Drosophila midgut. Cell 137: 1343–1355 [DOI] [PMC free article] [PubMed] [Google Scholar]
- Jiang H, Edgar BA (2012) Intestinal stem cell function in Drosophila and mice. Curr Opin Genet Dev 22: 354–360 [DOI] [PMC free article] [PubMed] [Google Scholar]
- Jiang H, Tian A, Jiang J (2016) Intestinal stem cell response to injury: lessons from Drosophila . Cell Mol Life Sci 73: 3337–3349 [DOI] [PMC free article] [PubMed] [Google Scholar]
- Kohlmaier A, Fassnacht C, Jin Y, Reuter H, Begum J, Dutta D, Edgar BA (2015) Src kinase function controls progenitor cell pools during regeneration and tumor onset in the Drosophila intestine. Oncogene 34: 2371–2384 [DOI] [PubMed] [Google Scholar]
- Langevin J, Le Borgne R, Rosenfeld F, Gho M, Schweisguth F, Bellaiche Y (2005) Lethal giant larvae controls the localization of notch‐signaling regulators numb, neuralized, and Sanpodo in Drosophila sensory‐organ precursor cells. Curr Biol 15: 955–962 [DOI] [PubMed] [Google Scholar]
- Lee T, Luo L (1999) Mosaic analysis with a repressible cell marker for studies of gene function in neuronal morphogenesis. Neuron 22: 451–461 [DOI] [PubMed] [Google Scholar]
- Mechler BM, McGinnis W, Gehring WJ (1985) Molecular cloning of lethal(2)giant larvae, a recessive oncogene of Drosophila melanogaster. EMBO J 4: 1551–1557 [DOI] [PMC free article] [PubMed] [Google Scholar]
- Micchelli CA, Perrimon N (2006) Evidence that stem cells reside in the adult Drosophila midgut epithelium. Nature 439: 475–479 [DOI] [PubMed] [Google Scholar]
- Miguel‐Aliaga I (2012) Nerveless and gutsy: intestinal nutrient sensing from invertebrates to humans. Semin Cell Dev Biol 23: 614–620 [DOI] [PMC free article] [PubMed] [Google Scholar]
- Montagne C, Gonzalez‐Gaitan M (2014) Sara endosomes and the asymmetric division of intestinal stem cells. Development 141: 2014–2023 [DOI] [PubMed] [Google Scholar]
- Nishimura T, Kaibuchi K (2007) Numb controls integrin endocytosis for directional cell migration with aPKC and PAR‐3. Dev Cell 13: 15–28 [DOI] [PubMed] [Google Scholar]
- O'Brien CA, Kreso A, Ryan P, Hermans KG, Gibson L, Wang Y, Tsatsanis A, Gallinger S, Dick JE (2012) ID1 and ID3 regulate the self‐renewal capacity of human colon cancer‐initiating cells through p21. Cancer Cell 21: 777–792 [DOI] [PubMed] [Google Scholar]
- O'Connor‐Giles KM, Skeath JB (2003) Numb inhibits membrane localization of Sanpodo, a four‐pass transmembrane protein, to promote asymmetric divisions in Drosophila . Dev Cell 5: 231–243 [DOI] [PubMed] [Google Scholar]
- Ohlstein B, Spradling A (2006) The adult Drosophila posterior midgut is maintained by pluripotent stem cells. Nature 439: 470–474 [DOI] [PubMed] [Google Scholar]
- Ohlstein B, Spradling A (2007) Multipotent Drosophila intestinal stem cells specify daughter cell fates by differential notch signaling. Science 315: 988–992 [DOI] [PubMed] [Google Scholar]
- Ohshiro T, Yagami T, Zhang C, Matsuzaki F (2000) Role of cortical tumour‐suppressor proteins in asymmetric division of Drosophila neuroblast. Nature 408: 593–596 [DOI] [PubMed] [Google Scholar]
- Peng CY, Manning L, Albertson R, Doe CQ (2000) The tumour‐suppressor genes lgl and dlg regulate basal protein targeting in Drosophila neuroblasts. Nature 408: 596–600 [DOI] [PubMed] [Google Scholar]
- Perdigoto CN, Schweisguth F, Bardin AJ (2011) Distinct levels of Notch activity for commitment and terminal differentiation of stem cells in the adult fly intestine. Development 138: 4585–4595 [DOI] [PubMed] [Google Scholar]
- Quan XJ, Yuan L, Tiberi L, Claeys A, De Geest N, Yan J, van der Kant R, Xie WR, Klisch TJ, Shymkowitz J, Rousseau F, Bollen M, Beullens M, Zoghbi HY, Vanderhaeghen P, Hassan BA (2016) Post‐translational control of the temporal dynamics of transcription factor activity regulates neurogenesis. Cell 164: 460–475 [DOI] [PubMed] [Google Scholar]
- Rhyu MS, Jan LY, Jan YN (1994) Asymmetric distribution of numb protein during division of the sensory organ precursor cell confers distinct fates to daughter cells. Cell 76: 477–491 [DOI] [PubMed] [Google Scholar]
- Rolls MM, Albertson R, Shih HP, Lee CY, Doe CQ (2003) Drosophila aPKC regulates cell polarity and cell proliferation in neuroblasts and epithelia. J Cell Biol 163: 1089–1098 [DOI] [PMC free article] [PubMed] [Google Scholar]
- Schweisguth F (2015) Asymmetric cell division in the Drosophila bristle lineage: from the polarization of sensory organ precursor cells to Notch‐mediated binary fate decision. Wiley Interdiscip Rev Dev Biol 4: 299–309 [DOI] [PMC free article] [PubMed] [Google Scholar]
- Scopelliti A, Cordero JB, Diao F, Strathdee K, White BH, Sansom OJ, Vidal M (2014) Local control of intestinal stem cell homeostasis by enteroendocrine cells in the adult Drosophila midgut. Curr Biol 24: 1199–1211 [DOI] [PMC free article] [PubMed] [Google Scholar]
- Siudeja K, Nassari S, Gervais L, Skorski P, Lameiras S, Stolfa D, Zande M, Bernard V, Rio Frio T, Bardin AJ (2015) Frequent somatic mutation in adult intestinal stem cells drives neoplasia and genetic mosaicism during aging. Cell Stem Cell 17: 663–674 [DOI] [PMC free article] [PubMed] [Google Scholar]
- Smith CA, Lau KM, Rahmani Z, Dho SE, Brothers G, She YM, Berry DM, Bonneil E, Thibault P, Schweisguth F, Le Borgne R, McGlade CJ (2007) aPKC‐mediated phosphorylation regulates asymmetric membrane localization of the cell fate determinant Numb. EMBO J 26: 468–480 [DOI] [PMC free article] [PubMed] [Google Scholar]
- Sotillos S, Diaz‐Meco MT, Caminero E, Moscat J, Campuzano S (2004) DaPKC‐dependent phosphorylation of Crumbs is required for epithelial cell polarity in Drosophila . J Cell Biol 166: 549–557 [DOI] [PMC free article] [PubMed] [Google Scholar]
- Tian A, Jiang J (2014) Intestinal epithelium‐derived BMP controls stem cell self‐renewal in Drosophila adult midgut. Elife 3: e01857 [DOI] [PMC free article] [PubMed] [Google Scholar]
- Tian A, Wang B, Jiang J (2017) Injury‐stimulated and self‐restrained BMP signaling dynamically regulates stem cell pool size during Drosophila midgut regeneration. Proc Natl Acad Sci USA 114: E2699–E2708 [DOI] [PMC free article] [PubMed] [Google Scholar]
- Uemura T, Shepherd S, Ackerman L, Jan LY, Jan YN (1989) numb, a gene required in determination of cell fate during sensory organ formation in Drosophila embryos. Cell 58: 349–360 [DOI] [PubMed] [Google Scholar]
- Vaughen J, Igaki T (2016) Slit‐robo repulsive signaling extrudes tumorigenic cells from epithelia. Dev Cell 39: 683–695 [DOI] [PMC free article] [PubMed] [Google Scholar]
- Veenstra JA, Agricola HJ, Sellami A (2008) Regulatory peptides in fruit fly midgut. Cell Tissue Res 334: 499–516 [DOI] [PubMed] [Google Scholar]
- Wang C, Guo X, Xi R (2014a) EGFR and Notch signaling respectively regulate proliferative activity and multiple cell lineage differentiation of Drosophila gastric stem cells. Cell Res 24: 610–627 [DOI] [PMC free article] [PubMed] [Google Scholar]
- Wang L, Zeng X, Ryoo HD, Jasper H (2014b) Integration of UPRER and oxidative stress signaling in the control of intestinal stem cell proliferation. PLoS Genet 10: e1004568 [DOI] [PMC free article] [PubMed] [Google Scholar]
- Wang C, Guo X, Dou K, Chen H, Xi R (2015) Ttk69 acts as a master repressor of enteroendocrine cell specification in Drosophila intestinal stem cell lineages. Development 142: 3321–3331 [DOI] [PubMed] [Google Scholar]
- Wernet MF, Mazzoni EO, Celik A, Duncan DM, Duncan I, Desplan C (2006) Stochastic spineless expression creates the retinal mosaic for colour vision. Nature 440: 174–180 [DOI] [PMC free article] [PubMed] [Google Scholar]
- Wirtz‐Peitz F, Nishimura T, Knoblich JA (2008) Linking cell cycle to asymmetric division: Aurora‐A phosphorylates the Par complex to regulate Numb localization. Cell 135: 161–173 [DOI] [PMC free article] [PubMed] [Google Scholar]
- Yaich L, Ooi J, Park M, Borg JP, Landry C, Bodmer R, Margolis B (1998) Functional analysis of the Numb phosphotyrosine‐binding domain using site‐directed mutagenesis. J Biol Chem 273: 10381–10388 [DOI] [PubMed] [Google Scholar]
- Yang Y, Zhu R, Bai J, Zhang X, Tian Y, Li X, Peng Z, He Y, Chen L, Ji Q, Chen W, Fang D, Wang R (2011) Numb modulates intestinal epithelial cells toward goblet cell phenotype by inhibiting the Notch signaling pathway. Exp Cell Res 317: 1640–1648 [DOI] [PubMed] [Google Scholar]
- Zeng X, Chauhan C, Hou SX (2010) Characterization of midgut stem cell‐ and enteroblast‐specific Gal4 lines in Drosophila . Genesis 48: 607–611 [DOI] [PMC free article] [PubMed] [Google Scholar]
- Zeng X, Lin X, Hou SX (2013) The Osa‐containing SWI/SNF chromatin‐remodeling complex regulates stem cell commitment in the adult Drosophila intestine. Development 140: 3532–3540 [DOI] [PMC free article] [PubMed] [Google Scholar]
- Zeng X, Han L, Singh SR, Liu H, Neumuller RA, Yan D, Hu Y, Liu Y, Liu W, Lin X, Hou SX (2015) Genome‐wide RNAi screen identifies networks involved in intestinal stem cell regulation in Drosophila . Cell Rep 10: 1226–1238 [DOI] [PMC free article] [PubMed] [Google Scholar]
- Zeng X, Hou SX (2015) Enteroendocrine cells are generated from stem cells through a distinct progenitor in the adult Drosophila posterior midgut. Development 142: 644–653 [DOI] [PMC free article] [PubMed] [Google Scholar]
Associated Data
This section collects any data citations, data availability statements, or supplementary materials included in this article.
Supplementary Materials
Appendix
Expanded View Figures PDF
Movie EV1
Movie EV2
Movie EV3
Review Process File


