

Abstract
Background
We investigated whether different sampling time‐points within one day would influence epidermal growth factor receptor mutation (EGFRm) status in plasma and evaluated the clinical outcomes according to the quantity analysis of EGFRm in circulating tumor DNA (ctDNA) in non‐small‐cell lung cancer (NSCLC).
Methods
EGFR‐tyrosine kinase inhibitor naïve advanced NSCLC patients who carried EGFRm in both tissues and ctDNA were enrolled in this study. Plasma samples were collected at three time‐points within one day (at 8 am, 11 am and 2 pm) for EGFRm analysis by droplet digital PCR.
Results
Twenty‐two advanced NSCLC patients were enrolled in the study. In a total of 66 blood specimens, the median EGFRm frequency was 7.13% (range 0–35.09%), and among them six specimens had less than 1.0% EGFRm frequency. Moreover, one time‐point blood specimen did not display any EGFRm, even by droplet digital PCR. The frequency of EGFRm changed dynamically across different time‐points within one day, but the differences were not significant (P = 0.557). We observed that patients with a relatively high frequency of EGFRm (>6.76%) had a better response to gefitinib (P = 0.024).
Conclusion
The release of ctDNA maybe a temporal heterogenous process. The different sampling time‐points within one day did not seem to influence EGFRm status in ctDNA. The relative EGFRm frequency in ctDNA could predict a benefit of EGFR‐tyrosine kinase inhibitor treatment for advanced NSCLC patients.
Keywords: Circulating tumor DNA, droplet digital PCR, epidermal growth factor receptor, liquid biopsy, non‐small‐cell lung cancer
Introduction
Somatic mutations in the epidermal growth factor receptor (EGFR) are present in 30–50% of Asian patients with advanced non‐small‐cell lung cancer (NSCLC).1, 2, 3 EGFR sensitive mutations confer hypersensitivity to oral tyrosine kinase inhibitors (TKIs), such as gefitinib, erlotinib, and afatinib, in advanced NSCLC.4, 5, 6, 7, 8, 9 The detection of EGFR mutation (EGFRm) is therefore a critical step in prognosis and therapy selection for patients with advanced NSCLC. Although tumor tissue testing remains the recommended method for EGFRm detection,10 a multitude of barriers to biopsy exist, because EGFRm has invasive and heterogeneous characteristics and cannot reflect current tumor dynamics or sensitivity to treatment. Therefore, it is crucial to develop noninvasive methods for monitoring the real‐time dynamics of cancer.
A liquid biopsy of cancer‐related cell‐free DNA (cfDNA), termed circulating tumor DNA (ctDNA), may be an ideal solution. ctDNA is released into blood from apoptotic or necrotic tumor cells in primary, metastatic or circulating tumor cells, and contains identical genetic features with the corresponding tumor tissues.11, 12 Previous studies have proved the feasibility and reliability of analyzing EGFRm status in ctDNA.13, 14, 15, 16, 17, 18 Nonetheless, the investigation of ctDNA presents a substantial challenge, as approximately 30% of patients with EGFRm present discordant EGFRm status between tumor tissues and blood, especially patients with tumor tissues positive but blood negative for mutation. Even when highly sensitive methods, such as droplet digital PCR (ddPCR), which has a detection limit of 0.1–0.04%, are performed, a high rate of false negative (around 20%) has been observed.11, 19, 20 We therefore hypothesized that not only method sensitivity, but also the release, distribution, and clearance of ctDNA in blood contributes to false negative EGFRm in ctDNA.
Currently, the mechanism of ctDNA release into peripheral blood remains unclear, and the varying distributions and clearance of ctDNA in circulation at various time‐points have not been thoroughly investigated. Thus, in the present study, we prospectively and dynamically collected plasma from NSCLC patients to investigate the potential influence of the different sampling time within one day on EGFRm status. We also evaluated the correlation between EGFRm abundance and clinical outcomes in advanced NSCLC treated with EGFR‐TKIs.
Methods
Patient population
To be eligible for the study, patients were required to have histologically confirmed, stage IIIB or IV NSCLC (classified as per the Union for International Cancer Control 7th edition Tumor Node Metastasis system), with EGFRm both in tumor tissues and plasma, no prior administration of systemic therapy, and available plasma samples. Patients treated at the Peking University Cancer Hospital or the Cancer Hospital Chinese Academy of Medical Sciences from July 2015 to April 2016 were recruited. The institutional review board at each hospital reviewed and approved the study. All patients gave informed consent for the collection of specimens and clinical information, and for biomarker analysis.
Sample collection and processing
Blood samples were collected in ethylene‐diamine‐tetraacetic acid vacutainer tubes at three different time‐points within one day (at 8 am, 11 am, and 2 pm) before first‐line EGFR‐TKI treatment, stored at 4°C, and processed within two hours. Blood samples were centrifuged at 1600 g at 4°C for 10 minutes for plasma collection, followed by a second centrifugation at 16 000 g for 15 minutes for further plasma clearance. Plasma was stored at −80°C until extraction. cfDNA was extracted from 2 mL of plasma using the QIAamp Circulating Nucleic Acid Kit (Qiagen, Hilden, Germany), following the manufacturer's instructions. cfDNA was eluted in AVE buffer (Qiagen, Hilden, Germany). DNA samples were stored at −80°C until analysis.
Droplet digital (dd) PCR analysis for epidermal growth factor receptor mutation (EGFRm)
The ctDNA was qualitatively and quantitatively analyzed by droplet digital (dd)PCR. The PCR reaction mixture (20 μL) contained 1× ddPCR Supermix (Bio‐Rad, Hercules, CA, USA), 0.9 pmol/μL of each primer and 0.45 pmol/μL of each probe (Amoy Diagnostics, Xiamen, China), and 50 ng of DNA template. The QX200 droplet generator was used to generate a maximum of 20 000 droplets for each sample (Bio‐Rad). Amplifications were performed under the following conditions: one cycle of 95°C for 10 minutes, followed by 45 cycles of 95°C for 15 seconds, 60°C for one minute, and then 4°C hold. Data acquisition and analysis was performed using QuantaSoft version 1.6.6 (Bio‐Rad). Four wells of negative controls with human reference genomic DNA (Promega Corporation, Madison, WI, USA), six wells of positive controls with 1:2500, 1:1000, and 1:2 ratios of mutant allele to wild type allele (genomic DNA from NCI‐H1650 cells for exon 19 deletion mutations and NCI‐H1975 cells for L858R mutations), and two wells of non‐template control were included in each run.19
Statistical analysis
The variation of EGFRm abundance over time was analyzed with repeated measures analysis of variance (ANOVA) applying the Greenhouse‐Geisser epsilon correction to adjust for violations against the assumption of sphericity. An χ2 test was performed to assess the relationships between EGFRm status and each of the clinical and pathologic parameters; however, a Fisher's exact test was used for small sample sizes. Statistical analysis was performed using SPSS version 20.0 (IBM Corp., Armonk, NY, USA). A P value of <0.05 was considered statistically significant.
Results
Patient characteristics
Twenty‐two patients met the enrollment criteria and were recruited from July 2015 to April 2016. The final follow‐up date was 9 March 2017. All patients were initially diagnosed with stage IV lung adenocarcinoma, including eight men and 14 women. Sixteen patients were never‐smokers and six were former/current smokers. All cases were enrolled in trial NCT02282267 and had been identified as harboring EGFRm both in TKI‐naïve tumor tissue and plasma on different days, including 13 patients carrying exon 19 deletion mutations (E19‐dels), eight patients with L858R mutations, and one patient harboring L858R and T790M double mutations. None of the patients had received prior systemic therapy. Clinical and disease characteristics are listed in Table 1.
Table 1.
Patient clinical and disease characteristics
| Variables | No. of patients (n = 22) | % of patients |
|---|---|---|
| Age (years) | ||
| ≤60 | 7 | 31.8 |
| >60 | 15 | 68.2 |
| Gender | ||
| Male | 8 | 36.4 |
| Female | 14 | 63.6 |
| Smoking history | ||
| Never smoker | 16 | 72.7 |
| Smoker | 6 | 27.3 |
| EGFRm | ||
| E19‐deletion | 13 | 59.1 |
| L858R | 8 | 36.4 |
| L858R/T790M† | 1 | 4.5 |
| Metastatic organs | ||
| One | 11 | 50.0 |
| More than one | 11 | 50.0 |
One plasma DNA sample exhibited mutations at both L858R and T790M. EGFRm, epidermal growth factor receptor mutation.
Quantitative analysis of EGFRm in plasma by ddPCR
To evaluate the effect of different sampling times on EGFRm test results, we prospectively and dynamically collected plasma from the 22 patients for EGFRm analysis by ddPCR. The frequency of EGFRm is summarized in Figure 1. The sample with L858R and T790M double mutations was included twice. Of the total 66 blood specimens, the median EGFRm frequency was 7.13% (range 0–35.09%), and among these six specimens had less than 1.0% EGFRm frequency. Of note, the EGFRm status in one patient switched from L858R mutation to wild type at different time‐points in the day (the fraction of EGFRm was 1.27, 2.74% and wild‐type, respectively, shown in Fig 2). The results demonstrated that the frequency of EGFRm in the ctDNA of each patient could change dynamically across different time‐points within one day. Repeated measures ANOVA was performed to analyze the variation in EGFRm frequency over time; however, no significant alterations were observed (P = 0.557). To identify whether correlations between the mutation status and the variation of EGFRm frequency existed, the patients were divided into two groups: E19‐dels (n = 13) and L858R mutation (n = 8). Because only one patient carried L858R and T790M double mutations, the T790M variation was excluded. However, repeated measures ANOVA revealed no significant correlation between them (P = 0.389).
Figure 1.
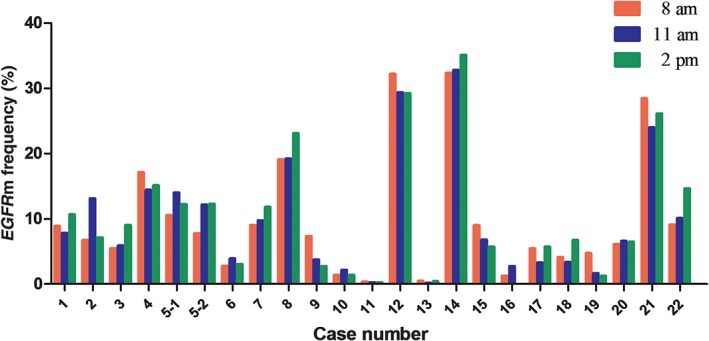
The dynamic variations of epidermal growth factor receptor mutation (EGFRm) frequency in plasma prospectively collected at three time‐points within one day (at 8 am, 11 am and 2 pm, respectively) from 22 patients (No. 5‐1 and no. 5‐2 are from the same plasma DNA sample, which exhibited mutations at both L858R and T790M. The EGFRm status of no. 16 at 2 pm was wild‐type).
Figure 2.
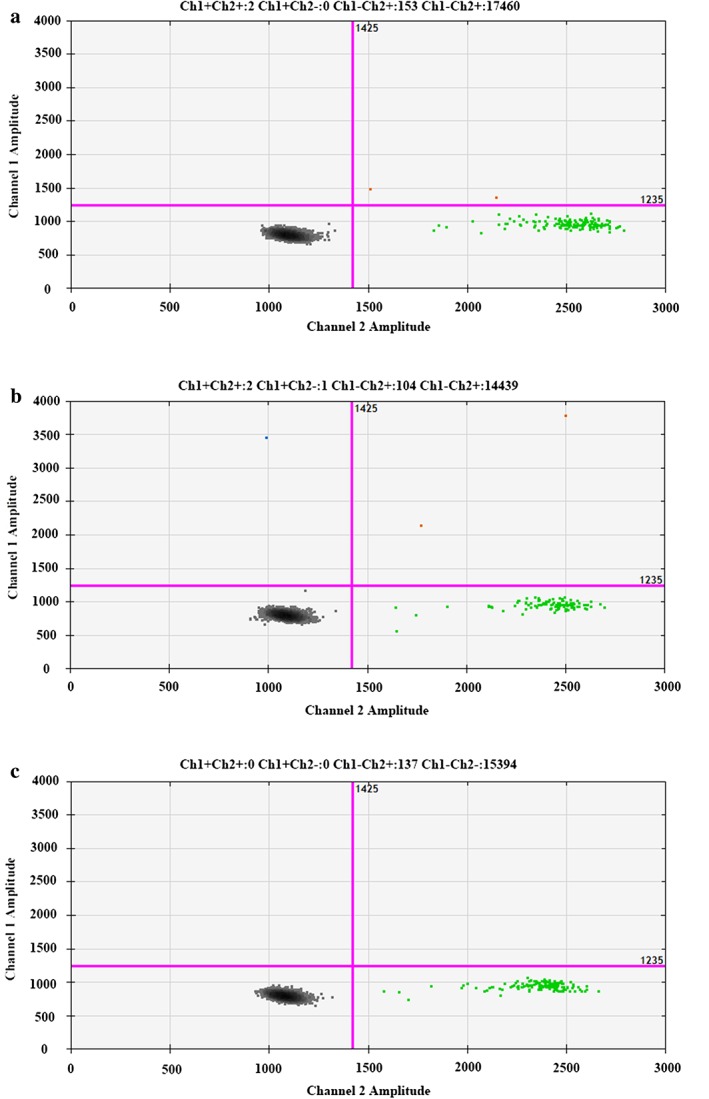
Detection of epidermal growth factor receptor mutation (EGFRm) status in no. 16 patient by droplet digital PCR. (a) Blood sample collected at 8 am harbored an L858R mutation (EGFRm frequency was 1.27%). (b) Blood sample collected at 11 am harbored an L858R mutation (EGFRm frequency was 2.74%). (c) Blood sample collected at 2 pm presented wild type.
Correlation between EGFRm frequency and gefitinib response
All of the patients received gefitinib as first‐line therapy. Using Response Evaluation Criteria in Solid Tumors, 13 (59.1%) patients achieved a partial response (PR), eight (36.4%) achieved stable disease (SD), and the patient (4.5%) with L858R and T790M double mutations was classified with progressive disease (PD). The objective response and disease control rates of patients were 59.1% (13/22) and 95.5% (21/22), respectively. The EGFRm detection results and clinical gefitinib outcomes are listed in Table 2.
Table 2.
EGFRm detection results and clinical outcome of gefitinib (n = 22)
| Case | EGFR mutation | Abundance of EGFR mutations | Response | PFS (months) | ||
|---|---|---|---|---|---|---|
| 8 am (%) | 11 am (%) | 2 pm (%) | ||||
| 1 | E19‐Dels | 8.87 | 7.77 | 10.64 | PR | 13.00 |
| 2 | L858R | 6.70 | 13.12 | 7.13 | PR | 5.17 |
| 3 | L858R | 5.45 | 5.83 | 9.02 | SD | 3.73 |
| 4 | E19‐Dels | 17.09 | 14.40 | 15.10 | PR | † |
| 5 | L858R/T790M | 10.52/7.75 | 14.01/12.15 | 12.19/12.30 | PD | 1.80 |
| 6 | E19‐dels | 2.79 | 3.89 | 3.03 | SD | 7.50 |
| 7 | L858R | 8.97 | 9.73 | 11.77 | PR | † |
| 8 | E19‐dels | 19.05 | 19.19 | 23.05 | PR | † |
| 9 | E19‐dels | 7.33 | 3.74 | 2.73 | SD | † |
| 10 | E19‐dels | 1.39 | 2.16 | 1.35 | SD | 5.53 |
| 11 | E19‐dels | 0.33 | 0.23 | 0.08 | PR | 8.40 |
| 12 | L858R | 32.19 | 29.36 | 29.24 | PR | 7.40 |
| 13 | L858R | 0.46 | 0.16 | 0.41 | SD | 10.27 |
| 14 | E19‐dels | 32.34 | 32.78 | 35.09 | PR | 11.17 |
| 15 | L858R | 8.99 | 6.77 | 5.69 | PR | † |
| 16 | L858R | 1.27 | 2.74 | WT | SD | 13.40 |
| 17 | L858R | 5.44 | 3.23 | 5.70 | PR | † |
| 18 | E19‐dels | 4.11 | 3.35 | 6.75 | PR | 11.97 |
| 19 | E19‐dels | 4.70 | 1.63 | 1.22 | PR | † |
| 20 | E19‐dels | 6.06 | 6.58 | 6.43 | SD | 9.30 |
| 21 | E19‐dels | 28.43 | 23.97 | 26.11 | PR | 4.10 |
| 22 | E19‐dels | 9.08 | 10.05 | 14.61 | SD | † |
No progress.
E19‐dels, E19‐deletions; EGFRm, epidermal growth factor receptor mutation; PD, progressive disease; PFS, progression‐free survival; PR, partial remission; SD, stable disease; WT, wild type.
To investigate the correlation between tumor response and variation in EGFRm frequency over time, we excluded the patient carrying L858R and T790M double mutations and divided the patients into four further groups, that is, patients who achieved: PR with E19‐dels (n = 8), PR with L858R mutation (n = 5), SD with E19‐dels (n = 5) and SD with L858R mutation (n = 3). However, repeated measures ANOVA revealed no significant differences (P = 0.740).
In order to evaluate the EGFRm fluctuation level to predict treatment response to gefitinib, we calculated the relative extent of EGFRm frequency fluctuation in each patient. We subtracted the minimum EGFRm frequency from the maximum in each patient, and divided the average EGFRm frequency at the three time‐points. A receiver operating characteristic (ROC) curve was then performed (Fig 3). ROC analysis showed that the area under the curve was 0.644 (95% confidence interval 0.388–0.900). From the ROC curves, the cut‐off reference value for the extent of fluctuation in EGFRm frequency was 0.493 (sensitivity 0.875, specificity 0.538). However, the difference did not reach statistical significance (P = 0.277).
Figure 3.
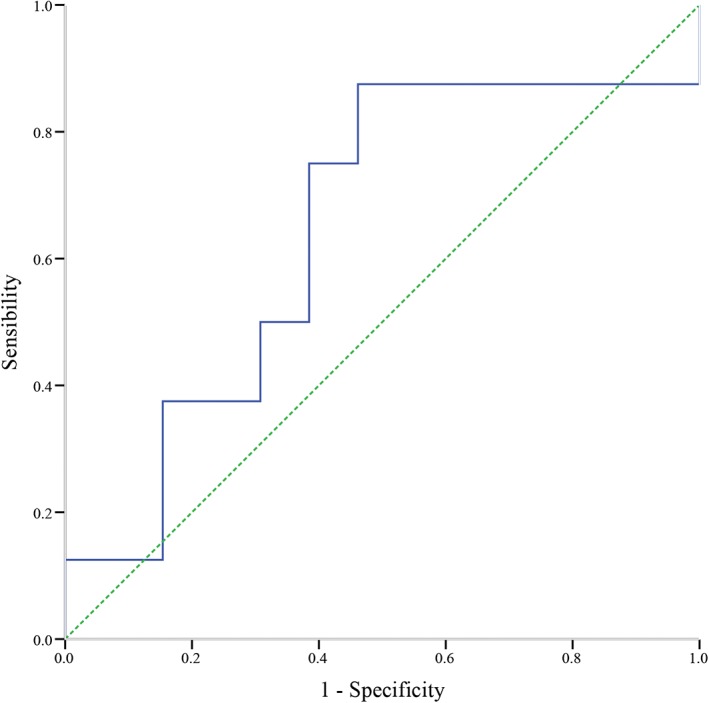
Receiver operating characteristic curve analysis results for extent of fluctuation in epidermal growth factor receptor mutation frequency to predict a treatment response to gefitinib.
We then calculated the average EGFRm frequency in these patients, who were then subdivided into two groups based on the relative extent of EGFRm frequency (median, 6.76%) in TKI‐ naïve plasma samples (group high: >6.76%, n = 10; group low: ≤6.76%, n = 11). The patients with high EGFRm frequency at baseline had a better response to gefitinib compared to those with low EGFRm frequency (P = 0.024). Selected characteristics of patients with different EGFRm frequency are shown in Table 3.
Table 3.
Selected characteristics of patients with different EGFRm frequency (n = 21†)
| Variables | Low abundance (n = 11) | High abundance (n = 10) | P | ||
|---|---|---|---|---|---|
| N | % | N | % | ||
| Age (years) | 0.361 | ||||
| ≤60 | 9 | 81.8 | 6 | 60.0 | — |
| >60 | 2 | 18.2 | 4 | 40.0 | — |
| Gender | 0.387 | ||||
| Male | 3 | 27.3 | 5 | 50.0 | — |
| Female | 8 | 72.7 | 5 | 50.0 | — |
| Smoking history | 0.361 | ||||
| Never smoker | 9 | 81.8 | 6 | 60.0 | — |
| Smoker | 2 | 18.2 | 4 | 40.0 | — |
| Metastatic organs | 0.395 | ||||
| One | 7 | 63.6 | 4 | 40.0 | — |
| More than one | 4 | 36.4 | 6 | 60.0 | — |
| Tumor response | 0.024 | ||||
| PR | 4 | 36.4 | 9 | 90.0 | — |
| SD | 7 | 63.6 | 1 | 10.0 | — |
Excludes the patient carrying L858R and T790M double mutations.
Factors were tested by χ2 or Fisher's exact tests.
EGFRm, epidermal growth factor receptor mutation; PR, partial remission; SD, stable disease.
Discussion
To our knowledge, the present study represents the first prospective investigation of the potential influence of different time‐points of blood collection on EGFRm status. Moreover, we also evaluated clinical outcomes according to the quantity of EGFRm in advanced NSCLC. The results demonstrated that the frequency of EGFRm in plasma could change dynamically across different time‐points within one day, but no significant alterations were observed in changes to EGFRm frequency over time. Moreover, patients with high EGFRm frequency (>6.76%) at baseline had a better response to gefitinib compared to those with low EGFRm frequency (≤6.76%).
Liquid biopsy of cancer‐related cfDNA has been a research hotspot because of its homogeneity and noninvasive, dynamic monitoring characteristics. However, multiple preanalytic factors, such as sample collection, sample processing, storage conditions, and DNA isolation methods, could compromise the accuracy cfDNA measurements.21, 22, 23, 24 Furthermore, the investigation of ctDNA has presented substantial challenges, as ctDNA often represents at extremely low fractions (<1.0%) of total circulating cfDNA.11 Technological advances have overcome this restriction, making it possible to enumerate the rare mutant variants in a complex mixture of DNA. However, in our previous study, although we exhaustively eliminated the influence of preanalytic factors and a high sensitivity method was adopted, a considerable proportion of false negative results still emerged.20 This result suggests that other variables influencing EGFRm testing may exist.
Presently, the mechanism of ctDNA release and its distribution and clearance are not well understood as the amount of ctDNA released into the circulation may be different at different clinical stages, treatment periods, or even different time‐points within one day. A previous study suggested that ctDNA has a relatively short half‐life (approximately two hours).25 In this regard, the release of ctDNA is a continuous process. In this study, blood samples were conveniently collected at three hour time points (at 8 am, 11 am and 2 pm). Preanalytic factors that could influence measurement and analysis were exhaustively eliminated. The results indicated that EGFRm frequency was not stable over the course of a day (and even switched from positive to negative in one patient), which may suggest that temporal heterogeneity of ctDNA shedding. In healthy individuals, infiltrating phagocytes clear apoptotic and necrotic cells. Nevertheless, infiltrating phagocytes do not function efficiently in certain situations, such as in advanced‐stage cancers, leading to the accumulation of cellular remains, which are then released into the circulation. As <10 of circulating tumor cells exist per 7.5 mL blood,26 passive release from apoptotic and necrotic cells is likely the primary source of ctDNA in circulation.12 The passive release of ctDNA is dependent on tumor location, volume, and/or vascularity.11 In this study, both drastic variation in EGFRm frequency and EFGRm status (which switched from positive to negative in one patient), suggest the possibility that the ctDNA release process is not homogeneous. At certain time‐points, infiltrating phagocytes clear most or all cellular debris and highly sensitive techniques, such as ddPCR, cannot detect ctDNA mutation. However, no significant differences were observed in the changes in EGFRm frequency over time in our study. There are several possible reasons for this phenomenon. First, as a consequence of temporal heterogenenous release, variation in EGFRm frequency is chaotic. Second, the rhythm of EGFRm frequency variation has not been ascertained because of the small sample size of the study and/or the sampling time‐points were unreasonably arranged.
Our study also indicated that a relatively high frequency of EGFRm in plasma could predict a better clinical response to gefitinib. To our knowledge, Zhou et al. were the first to reveal that relative EGFRm frequency in tumor tissues could predict the extent of benefit from EGFR‐TKI treatment for advanced NSCLC.27 However, spatial and temporal heterogeneity represents a major obstacle to therapeutic guidance reliant on biopsy throughout the entire process of treatment, especially after disease progression. Yung et al. quantified EGFRm in plasma by digital PCR and proved the relationship between EGFRm concentration and clinical response.28 Yang et al. indicated that advanced NSCLC patients with high EGFRm abundance in TKI‐ naïve plasma showed better progression‐free survival compared to those with low EGFRm frequency.20 In this study, all of the patients carried EGFRm, both in TKI‐naïve tumor tissue and plasma, which avoided false positive results in ctDNA. Our results indicate that patients with a high frequency of EGFRm (>6.76%) in ctDNA at baseline had a better response to gefitinib. Theoretically, the frequency of intratumor EGFRm is associated with tumor burden11, 29 and the proportion of TKI‐sensitive mutant clones in whole tumor clones. Therefore, patients with a relatively high frequency of EGFRm obtained a better response to TKIs and had longer progression‐free survival. Nevertheless, the level of fluctuation in EGFRm did not reflect EGFRm frequency, therefore the level of fluctuation could not predict a tumor response to gefitinib.
The limitations of this study include the small sample size and no nighttime sampling was conducted. Future studies are needed to evaluate the reliability of dynamic changes in ctDNA within one day. Moreover, additional studies are required to evaluate the predictive value of baseline ctDNA in patients treated with EGFR‐TKIs.
In summary, our results suggest that ctDNA release maybe a temporal heterogenous process and different sampling time‐points do not seem to influence EGFRm status in ctDNA. The relative EGFRm frequency in ctDNA could predict a benefit from EGFR‐TKI treatment for advanced NSCLC patients. A prospective study with a specific design is warranted in the future.
Disclosure
No authors report any conflict of interest.
Acknowledgments
We thank all patients for their participation in this study. We thank Han Yin for her contribution to sample collection and preparation, and Di Wang and Yanhua Tian for support with statistical analysis.
References
- 1. Shi Y, Au JS, Thongprasert S et al. A prospective, molecular epidemiology study of EGFR mutations in Asian patients with advanced non‐small‐cell lung cancer of adenocarcinoma histology (PIONEER). J Thorac Oncol 2014; 9: 154–62. [DOI] [PMC free article] [PubMed] [Google Scholar]
- 2. Kosaka T, Yatabe Y, Endoh H, Kuwano H, Takahashi T, Mitsudomi T. Mutations of the epidermal growth factor receptor gene in lung cancer: Biological and clinical implications. Cancer Res 2004; 64: 8919–23. [DOI] [PubMed] [Google Scholar]
- 3. Wu YL, Zhong WZ, Li LY et al. Epidermal growth factor receptor mutations and their correlation with gefitinib therapy in patients with non‐small cell lung cancer: A meta‐analysis based on updated individual patient data from six medical centers in mainland China. J Thorac Oncol 2007; 2: 430–9. [DOI] [PubMed] [Google Scholar]
- 4. Wu YL, Zhou C, Hu CP et al. Afatinib versus cisplatin plus gemcitabine for first‐line treatment of Asian patients with advanced non‐small‐cell lung cancer harbouring EGFR mutations (LUX‐Lung 6): An open‐label, randomised phase 3 trial. Lancet Oncol 2014; 15: 213–22. [DOI] [PubMed] [Google Scholar]
- 5. Sequist LV, Yang JC, Yamamoto N et al. Phase III study of afatinib or cisplatin plus pemetrexed in patients with metastatic lung adenocarcinoma with EGFR mutations. J Clin Oncol 2013; 31: 3327–34. [DOI] [PubMed] [Google Scholar]
- 6. Rosell R, Carcereny E, Gervais R et al. Erlotinib versus standard chemotherapy as first‐line treatment for European patients with advanced EGFR mutation‐positive non‐small‐cell lung cancer (EURTAC): A multicentre, open‐label, randomised phase 3 trial. Lancet Oncol 2012; 13: 239–46. [DOI] [PubMed] [Google Scholar]
- 7. Zhou C, Wu YL, Chen G et al. Erlotinib versus chemotherapy as first‐line treatment for patients with advanced EGFR mutation‐positive non‐small‐cell lung cancer (OPTIMAL, CTONG‐0802): A multicentre, open‐label, randomised, phase 3 study. Lancet Oncol 2011; 12: 735–42. [DOI] [PubMed] [Google Scholar]
- 8. Maemondo M, Inoue A, Kobayashi K et al. Gefitinib or chemotherapy for non‐small‐cell lung cancer with mutated EGFR. N Engl J Med 2010; 362: 2380–8. [DOI] [PubMed] [Google Scholar]
- 9. Mok TS, Wu YL, Thongprasert S et al. Gefitinib or carboplatin‐paclitaxel in pulmonary adenocarcinoma. N Engl J Med 2009; 361: 947–57. [DOI] [PubMed] [Google Scholar]
- 10. Eberhard DA, Giaccone G, Johnson BE, Non‐Small‐Cell Lung Cancer Working Group . Biomarkers of response to epidermal growth factor receptor inhibitors in Non–Small‐Cell Lung Cancer Working Group: Standardization for use in the clinical trial setting. J Clin Oncol 2008; 26: 983–94. [DOI] [PubMed] [Google Scholar]
- 11. Diaz LA Jr, Bardelli A. Liquid biopsies: Genotyping circulating tumor DNA. J Clin Oncol 2014; 32: 579–86. [DOI] [PMC free article] [PubMed] [Google Scholar]
- 12. Crowley E, Di Nicolantonio F, Loupakis F, Bardelli A. Liquid biopsy: Monitoring cancer‐genetics in the blood. Nat rev Clin Oncol 2013; 10: 472–84. [DOI] [PubMed] [Google Scholar]
- 13. Reck M, Hagiwara K, Han B et al. Investigating the utility of circulating‐free tumour‐derived DNA (CTDNA) in plasma for the detection of epidermal growth factor receptor (EGFR) mutation status in European and Japanese patients (pts) with advanced non‐small‐cell lung cancer (ANSCLC): Assess study. Ann Oncol 2015; 26(Suppl. 1): i58–9. [Google Scholar]
- 14. Han B, Tjulandin S, Hagiwara K et al. Determining the prevalence of EGFR mutations in Asian and Russian patients (pts) with advanced non‐small‐cell lung cancer (ANSCLC) of adenocarcinoma (ADC) and non‐ADC histology: Ignite study. Ann Oncol 2015; 26 (Suppl. 1): i29–30. [DOI] [PubMed] [Google Scholar]
- 15. Karachaliou N, Mayo‐de las Casas C, Queralt C et al. Association of EGFR L858R mutation in circulating free DNA with survival in the EURTAC trial. JAMA Oncol 2015; 1: 149–57. [DOI] [PubMed] [Google Scholar]
- 16. Mok T, Wu Y‐L, Lee JS et al. Detection and dynamic changes of EGFR mutations from circulating tumor DNA as a predictor of survival outcomes in NSCLC patients treated with first‐line intercalated erlotinib and chemotherapy. Clin Cancer Res 2015; 21: 3196–203. [DOI] [PubMed] [Google Scholar]
- 17. Douillard JY, Ostoros G, Cobo M et al. Gefitinib treatment in EGFR mutated caucasian NSCLC circulating‐free tumor DNA as a surrogate for determination of EGFR status. J Thorac Oncol 2014; 9: 1345–53. [DOI] [PMC free article] [PubMed] [Google Scholar]
- 18. Bai H, Mao L, Wang HS et al. Epidermal growth factor receptor mutations in plasma DNA samples predict tumor response in Chinese patients with stages IIIB to IV non‐small‐cell lung cancer. J Clin Oncol 2009; 27: 2653–9. [DOI] [PubMed] [Google Scholar]
- 19. Zhu G, Ye X, Dong Z et al. Highly sensitive droplet digital PCR method for detection of EGFR‐activating mutations in plasma cell‐free DNA from patients with advanced non‐small cell lung cancer. J Mol Diagn 2015; 17: 265–72. [DOI] [PubMed] [Google Scholar]
- 20. Yang X, Zhuo M, Ye X et al. Quantification of mutant alleles in circulating tumor DNA can predict survival in lung cancer. Oncotarget 2016; 7: 20810–24. [DOI] [PMC free article] [PubMed] [Google Scholar]
- 21. Bronkhorst AJ, Aucamp J, Pretorius PJ. Cell‐free DNA: Preanalytical variables. Clin Chim Acta 2015; 450: 243–53. [DOI] [PubMed] [Google Scholar]
- 22. Dhallan R, Au WC, Mattagajasingh S et al. Methods to increase the percentage of free fetal DNA recovered from the maternal circulation. JAMA 2004; 291: 1114–9. [DOI] [PubMed] [Google Scholar]
- 23. Jung M, Klotzek S, Lewandowski M, Fleischhacker M, Jung K. Changes in concentration of DNA in serum and plasma during storage of blood samples. Clin Chem 2003; 49: 1028–9. [DOI] [PubMed] [Google Scholar]
- 24. Chiu RWK, Poon LLM, Lau TK, Leung TN, Wong EMC, Lo YMD. Effects of blood‐processing protocols on fetal and total DNA quantification in maternal plasma. Clin Chem 2001; 47: 1607–13. [PubMed] [Google Scholar]
- 25. Diehl F, Schmidt K, Choti MA et al. Circulating mutant DNA to assess tumor dynamics. Nat Med 2008; 14: 985–90. [DOI] [PMC free article] [PubMed] [Google Scholar]
- 26. Punnoose EA, Atwal S, Liu W et al. Evaluation of circulating tumor cells and circulating tumor DNA in non‐small cell lung cancer: Association with clinical endpoints in a phase II clinical trial of pertuzumab and erlotinib. Clin Cancer Res 2012; 18: 2391–401. [DOI] [PubMed] [Google Scholar]
- 27. Zhou Q, Zhang XC, Chen ZH et al. Relative abundance of EGFR mutations predicts benefit from gefitinib treatment for advanced non‐small‐cell lung cancer. J Clin Oncol 2011; 29: 3316–21. [DOI] [PubMed] [Google Scholar]
- 28. Yung TKF, Chan KCA, Mok TSK, Tong J, To KF, Lo YM. Single‐molecule detection of epidermal growth factor receptor mutations in plasma by microfluidics digital PCR in non‐small cell lung cancer patients. Clin Cancer Res 2009; 15: 2076–84. [DOI] [PubMed] [Google Scholar]
- 29. Couraud S, Vaca‐Paniagua F, Villar S et al. Noninvasive diagnosis of actionable mutations by deep sequencing of circulating free DNA in lung cancer from never‐smokers: A proof‐of‐concept study from BioCAST/IFCT‐1002. Clin Cancer Res 2014; 20: 4613–24. [DOI] [PubMed] [Google Scholar]