

Abstract
Control of stem cell fate to either enter terminal differentiation versus returning to quiescence (self‐renewal) is crucial for tissue repair. Here, we showed that AMP‐activated protein kinase (AMPK), the master metabolic regulator of the cell, controls muscle stem cell (MuSC) self‐renewal. AMPKα1−/− MuSCs displayed a high self‐renewal rate, which impairs muscle regeneration. AMPKα1−/− MuSCs showed a Warburg‐like switch of their metabolism to higher glycolysis. We identified lactate dehydrogenase (LDH) as a new functional target of AMPKα1. LDH, which is a non‐limiting enzyme of glycolysis in differentiated cells, was tightly regulated in stem cells. In functional experiments, LDH overexpression phenocopied AMPKα1−/− phenotype, that is shifted MuSC metabolism toward glycolysis triggering their return to quiescence, while inhibition of LDH activity rescued AMPKα1−/− MuSC self‐renewal. Finally, providing specific nutrients (galactose/glucose) to MuSCs directly controlled their fate through the AMPKα1/LDH pathway, emphasizing the importance of metabolism in stem cell fate.
Keywords: glycolysis, metabolic shift, skeletal muscle regeneration, stem cell fate
Subject Categories: Metabolism, Stem Cells
Introduction
Many aspects of cell physiology are differently regulated in adult stem cells as compared with other types of cells. Maintenance of the quiescent state, which is a reversible state of growth arrest, is a fundamental process that maintains the number and function of self‐renewing cells (Orford & Scadden, 2008). In eukaryotes, quiescence is defined not only in relation to the cell cycle but also as a metabolically unique state characterized by suppressed catabolism resulting in a non‐dividing phase (Laporte et al, 2011). Thus, establishment of quiescence via altered metabolic activity can be an effective strategy to survive in extreme conditions such as starvation or hypoxia (Takubo et al, 2013). For example, adult hematopoietic stem cells (HSCs) rely primarily on glycolysis to generate ATP (Rafalski et al, 2012), have relatively little cytoplasm and are less dependent on mitochondrial oxygen‐consuming metabolism (Kim et al, 1998) than more differentiated cells (Simsek et al, 2010). In this context, an outstanding question is how specific changes in metabolic flux affect stem cell fate and stemness. This is an issue that adult muscle stem cells (MuSCs) are uniquely well suited to address.
Indeed, MuSCs are a very well‐defined model of adult stem cells. Their capacity to repair skeletal muscle fiber (myofiber) and to sustain skeletal muscle regeneration during the entire lifespan, as well as their capability to self‐renew to maintain the pool of quiescent MuSCs, is crucial for skeletal muscle homeostasis. At steady state, MuSCs (satellite cells) lay quiescent in their niche along the myofiber where they express the transcription factor Pax7 (Seale et al, 2000). Upon muscle injury, they become activated into transitory amplifying cells and proliferate while expressing Pax7, Myf5, and MyoD. Then, MuSCs either enter terminal myogenic differentiation—during which they down‐regulate Pax7, increase MyoD and myogenin expression, and fuse to form new myofibers—or self‐renew and return to quiescence that is associated with down‐regulation of MyoD and increase of Pax7 expression (Kuang et al, 2007). Stemness of MuSCs is very powerful since one grafted single myofiber (containing about seven satellite cells) gives rise to over 100 new myofibers containing new quiescent MuSCs and about 25–30,000 nuclei as well (Collins et al, 2005).
The metabolism of MuSCs is poorly understood, although these cells seem to rely more on glycolysis than oxidative phosphorylation for energy production during early activation (Cerletti et al, 2012; Ryall et al, 2015). MuSCs expressing high level of Pax7 exhibit a low metabolic state, highly express stem‐like markers, and are slow to divide after their exit from quiescence (Rocheteau et al, 2012). Recently, it has been suggested that the resistance to severe hypoxia could be considered as an intrinsic characteristic of some MuSCs, which have developed the capacity to reduce their metabolic activity and adopt a more quiescent/dormant state under extreme conditions of stress (Latil et al, 2012). In other stem cell systems, such as HSCs, regulation of stem cell fate has been linked to their metabolism (Ito et al, 2012; Knobloch et al, 2013), particularly the exit from and the entry into the quiescent state (Rafalski et al, 2012).
5′‐AMP‐activated protein kinase (AMPK) is a master regulator of metabolic homeostasis (Hardie et al, 2012) and a negative regulator of glucose metabolism in cancer cells (i.e., “Warburg effect”) (Faubert et al, 2013). In almost all cell types, AMPK regulates the balance between catabolic and anabolic processes, particularly in skeletal muscle cells in which it controls myofiber growth and size (Mounier et al, 2009, 2011; Lantier et al, 2010). AMPK pathway regulates macrophage inflammatory state during skeletal muscle regeneration, linking metabolism, and inflammation (Mounier et al, 2013). It also controls the polarity of some cell types (Hardie, 2011). Moreover, AMPK has been shown to regulate cell growth by phosphorylation of effectors controlling the cell cycle (Hardie, 2011). However, its action on stem cell fate has not been investigated. Recently, it has been suggested that AMPKα1‐deficient MuSCs rely more on oxidative metabolism at the time of their activation (Fu et al, 2015). However, the genetic mouse model used in this study relies on a different exon deletion of prkaa1 (AMPKα1) gene (exon 3 versus exons 4 and 5 in the present study) and on a different Cre driver (B6.129S‐Pax7tm1(cre/ERT2)Gaka/J mouse versus B6;129‐Pax7tm2.1(cre/ERT2)Fan/J mouse in the present study), rendering the role of AMPK in MuSC fate still unresolved.
Identifying whether and how metabolism regulates MuSC fate (activation, proliferation, differentiation and self‐renewal) is of importance for understanding the regulation of skeletal muscle homeostasis. Recent advances in MuSC biology have identified their fundamental biological roles and have fostered the development of tools to analyze MuSCs, enabling the investigation of their metabolic functions. The sequential steps of MuSC fate can be finely monitored in vivo, ex vivo, and in vitro, rendering MuSCs and muscle regeneration a powerful model to explore mechanisms of self‐renewal in adult stem cells. In this context, we performed a comprehensive investigation of the role of metabolism in the regulation of MuSC fate. For this purpose, we used various genetic mouse models and culture setups to explore the role of the master regulator of energy stress response pathway AMPKα1 in tailoring the metabolic make‐up of MuSCs and in modulating their fate. Here, we evidenced a novel AMPKα1‐lactate dehydrogenase (LDH) pathway in the return to quiescence of MuSCs.
Results
AMPKα1 deficiency in MuSCs increases their self‐renewal in vitro and ex vivo
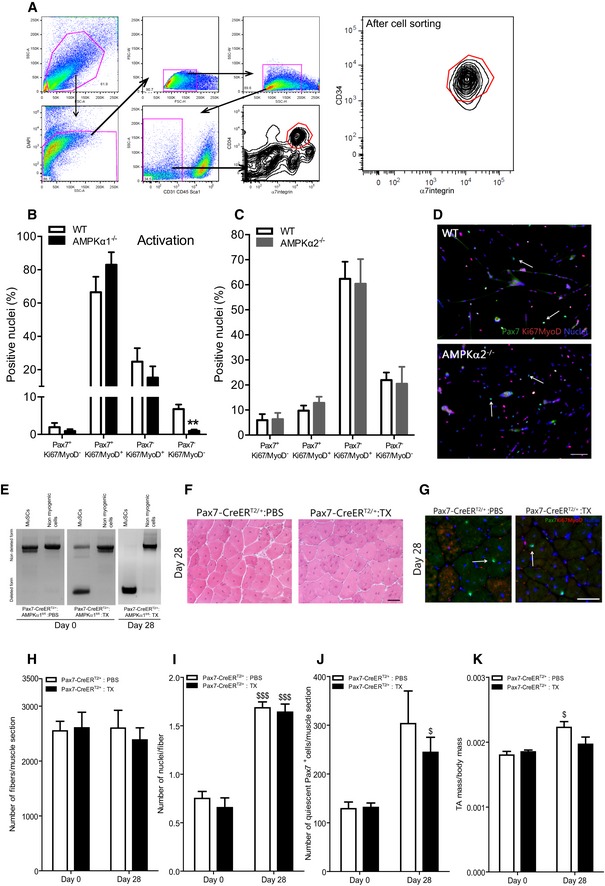
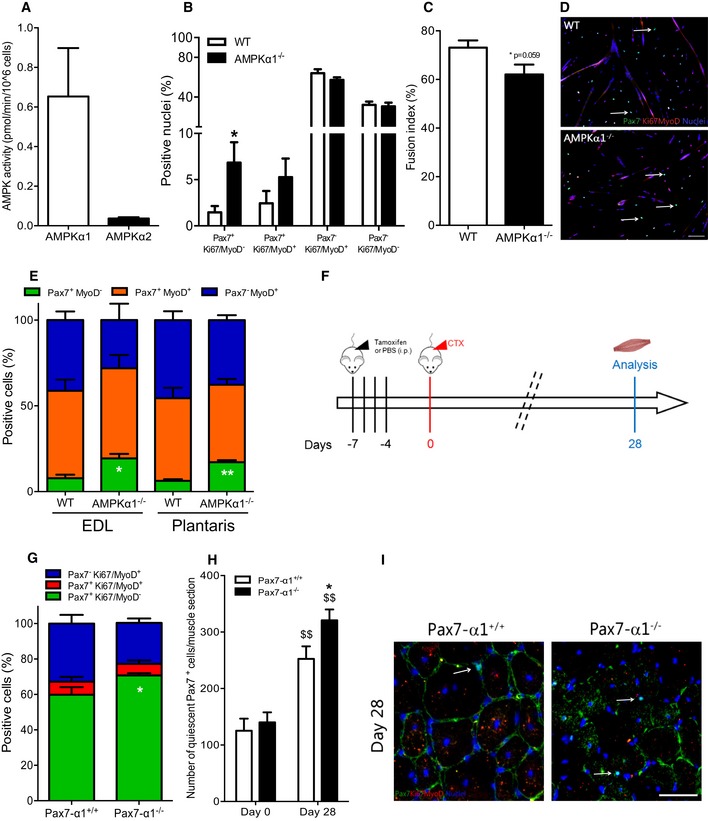
Evaluation of AMPK activity in pure MuSC populations extracted from regenerating wild‐type (WT) tibialis anterior (TA) muscles by cell sorting (CD45/CD31/Sca1−CD34/α7int+ cells, Fig EV1A) showed that AMPKα1 activity was present, whereas AMPKα2 activity was not detectable in MuSCs (Fig 1A), confirming our previous results on undifferentiated myoblasts (Lantier et al, 2010). MuSCs were induced to fully differentiate and then were labeled for Pax7 (quiescence), Ki67 (proliferation), and MyoD (commitment into myogenic lineage) expression. The number of Pax7+Ki67/MyoD− nuclei (reserve cells or self‐renewing cells returned to quiescence at the time of full myogenic differentiation) was greatly increased in AMPKα1−/− versus WT MuSCs (+367%, P < 0.05, Fig 1B and D) after 2 days in differentiation conditions. It has been suggested that quiescent MuSCs renew by lineage regression from activated/commited MuSCs (i.e., Pax7+Ki67/MyoD+ cells) (Yin et al, 2013). Of note, the proportion of activated MuSCs (Pax7+Ki67/MyoD+ cells) was identical in AMPKα1−/− and WT cultures. Indeed, 98.6% ±0.6 of the cells are cycling 6 h after plating, at the time of switch to differentiation medium (i.e., at time of the starting of the experiments) (Fig EV1B, panel “activation”). Conversely, a decrease of the fusion index in AMPKα1−/− was observed (−15%, P = 0.059, Fig 1C and D) that cannot be explained only by the lower number of differentiated cells (Pax7−Ki67/MyoD− cells) at the time of switch into differentiation medium (panel “activation”, Fig EV1B). In accordance with the absence of AMPKα2 activity in MuSCs, no difference in MuSC behavior was observed in AMPKα2−/− versus WT MuSCs (Fig EV1C and D).
Figure EV1. Muscle stem cell extraction and effects of AMPKα2 loss or tamoxifen injection on muscle stem cell fate in vitro and in vivo .
-
AGating strategy to sort MuSCs from hindlimbs. MuSCs were CD45/CD31/Sca1− and CD34/α7int+ cells. The dot plot on the right is a representative example of sorted MuSCs.
-
BPax7Ki67MyoD labeling was performed on WT and AMPKα1−/− MuSCs at the time of the induction of differentiation (activation). Percentage of Pax7+Ki67/MyoD−, Pax7+Ki67/MyoD+, Pax7−Ki67/MyoD+ and Pax7−Ki67/MyoD− cells were quantified.
-
C, DPax7Ki67MyoD labeling was performed on WT and AMPKα2−/− MuSCs after 48 h of culture in differentiation conditions: (C) percentages of Pax7+Ki67/MyoD−, Pax7+Ki67/MyoD+, Pax7−Ki67/MyoD+ and Pax7−Ki67/MyoD− cells were quantified and (D) Pax7 (green), Ki67/MyoD (red), nuclei (blue) labeling of MuSCs. White arrows show Pax7+ quiescent cells.
-
EMuSCs (CD45/CD31/Sca1−CD34/α7int+) and non‐myogenic cells (CD45/CD31/Sca1+) were extracted from total hindlimbs at day 0 and from injured TA (28 days post‐CTX) of Pax7‐CreERT2/+:AMPKα1fl/fl mice injected with PBS (Pax7‐α1+/+) or from Pax7‐CreERT2/+:AMPKα1fl/fl injected with tamoxifen (2 mg/mouse, Pax7‐α1−/−) during 4 days. DNA was extracted, and PCR was performed to verify the deletion of AMPKα1 at day 0 (i.e., 1 week after the first tamoxifen injection, see Fig 1F).
-
F–KTibialis anterior muscles from Pax7‐CreERT2/+ mice daily injected with PBS or tamoxifen were removed before (day 0) or 28 days after CTX damage (see Fig 1F). Muscle cryosections were prepared for Pax7Ki67MyoD labeling or hematoxylin–eosin staining. (F) Hematoxylin–eosin staining, (G) Pax7 (green), Ki67/MyoD (red), nuclei (blue) labeling. White arrows show Pax7+ quiescent cells. (H) Number of fibers per muscle, (I) number of nuclei per fiber, (J) number of Pax7+Ki67/MyoD− cells per muscle and (K) ratio of muscle mass per body mass were calculated.
Figure 1. Effects of AMPKα1 loss on muscle stem cell self‐renewal.
-
AActivity of AMPKα1 (white bar) and AMPKα2 (black bar) in muscle stem cells (MuSCs) extracted from regenerating WT tibialis anterior (TA) muscles by cell sorting (CD45/CD31/Sca1−CD34/α7int+ cells, see Fig EV1A).
-
B–DMuSCs were extracted from total hindlimbs of WT and AMPKα1−/− mice. Pax7Ki67MyoD labeling was performed after 48 h of culture in differentiation conditions. (B) Percentage of Pax7+Ki67/MyoD− (quiescent cells), Pax7+Ki67/MyoD+ (activated cells), Pax7−Ki67/MyoD+ (differentiating cells), Pax7−Ki67/MyoD− cells (differentiated cells) and (C) fusion index were calculated. (D) Pax7 (green), Ki67/MyoD (red), nuclei (blue) labeling of MuSCs. White arrows show quiescent Pax7+ cells.
-
EIsolated fibers from WT and AMPKα1−/− extensor digitorum longus (EDL) and plantaris muscles were cultured for 3 days, and Pax7MyoD labeling was performed. Percentage of Pax7+MyoD− (green, quiescent cells), Pax7+MyoD+ (orange, activated cells) and Pax7−MyoD+ (blue, differentiated cells) populations were quantified.
-
FProtocol used to delete AMPKα1 in Pax7‐CreERT2/+:AMPKα1fl/fl mice. PBS (Pax7‐α1+/+ mice) or tamoxifen (2 mg/mouse; Pax7‐α1−/− mice) was daily delivered intraperitoneally during 4 days, 1 week before cardiotoxin (CTX) injection in the TA muscle. Muscles were analyzed before (day 0) and 28 days after injury.
-
G, H(G) Percentage of Pax7+Ki67/MyoD− (green, quiescent cells), Pax7+Ki67/MyoD+ (red, activated cells) and Pax7−Ki67/MyoD+ cells (blue, differentiated cells), and (H) total number of quiescent Pax7+ cells per muscle section were calculated.
-
IPax7 (green), Ki67/MyoD (red), nuclei (blue) labeling in muscle section. White arrows show quiescent Pax7+ cells.
These observations were confirmed by ex vivo clonal lineage tracing of MuSCs in the myofiber niche (Abou‐Khalil et al, 2009; Yin et al, 2013). Indeed, after myofiber isolation, all Pax7+ MuSCs are activated and rapidly start to express MyoD (Zammit et al, 2004). Single myofibers isolated from extensor digitorum longus (EDL) and plantaris muscles were cultured for 3 days. The number of Pax7+MyoD− cells (self‐renewing cells returned to quiescence) was strongly increased in AMPKα1−/− cells as compared with WT cells in both EDL and plantaris muscles (+147%, P < 0.05 and +175%, P < 0.01, respectively) (Fig 1E).
AMPKα1 deficiency in MuSCs increases their self‐renewal in vivo
To investigate in vivo the role of AMPKα1 in MuSC fate, we used the cardiotoxin (CTX) injury model to damage the TA muscle. It induces the activation of quiescent MuSCs, their proliferation (peak at day 3–4 post‐injury), their entry into terminal differentiation and fusion into new myofibers, or their return to quiescence back into their niche (days 6–14), and final recovery of the skeletal muscle homeostasis (days 21–28) (Collins et al, 2005; Arnold et al, 2007; Abou‐Khalil et al, 2009; Mounier et al, 2013; Parisi et al, 2015). In Pax7‐CreERT2/+:AMPKα1fl/fl adult mouse, the CRE recombinase is specifically expressed in Pax7+ cells (MuSCs) in a non‐active form. Tamoxifen injection activates the CRE recombinase (Lepper et al, 2009), triggering the deletion of AMPKα1 only in these cells in a time‐controlled manner (Pax7‐α1−/− mice, Fig 1F). Quantitative PCR analysis confirmed the deletion of the pkraa1 (AMPKα1) gene in MuSCs before (day 0) and after CTX injury (day 28) (Fig EV1E). To validate that the results were not unspecific effect mediated by tamoxifen injection (Brack, 2014), control experiments were performed in adult Pax7‐CreERT2/+ mice, where we verified that tamoxifen injections did not alter skeletal muscle regeneration (Fig EV1F–K). In vivo experiments using Pax7‐α1−/− mice showed that 28 days after injury the percentage among MuSCs as well as the total number of quiescent Pax7+Ki67/MyoD− MuSCs were remarkably increased in Pax7‐α1−/− muscles as compared with the control muscles (18%, P < 0.05 and 27%, P < 0.05, respectively; Fig 1G–I).
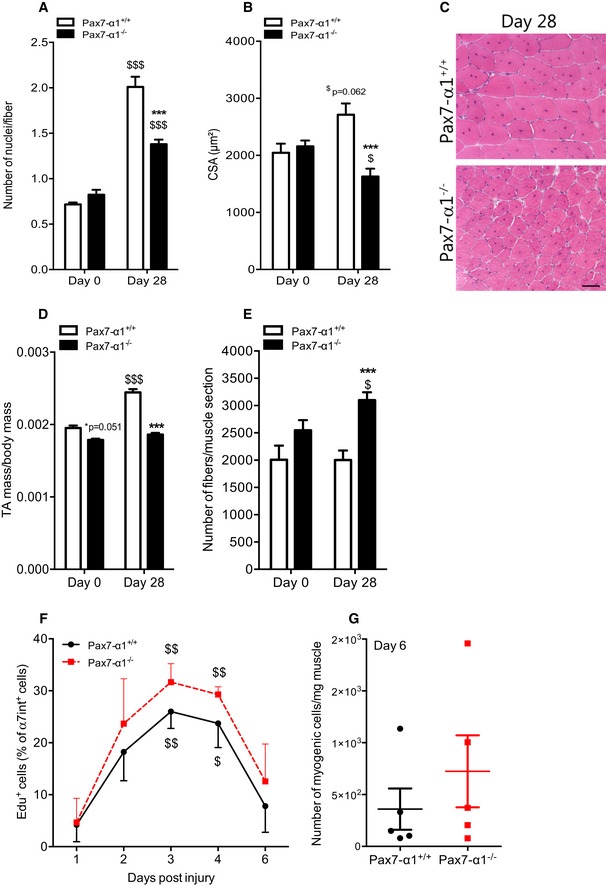
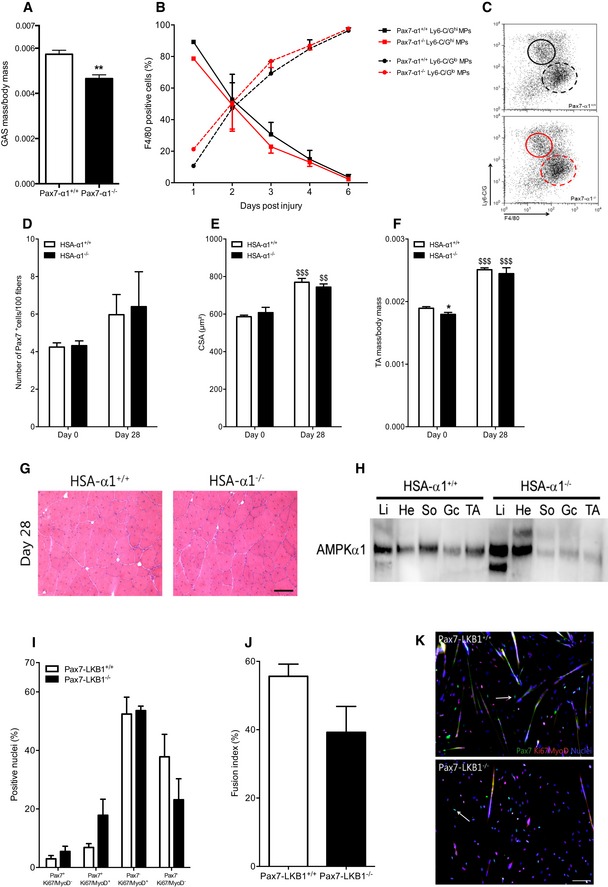
Conversely, the number of myonuclei per fiber (i.e., the result of differentiation and fusion of MuSCs) was decreased by 31% in Pax7‐α1−/− muscles (P < 0.001, Fig 2A). This indicates that the number of differentiated cells capable of fusion dropped, consistent with the decrease of the fusion index observed in vitro in AMPKα1‐deficient MuSCs (Fig 1C). Histological analysis showed that skeletal muscle regeneration was altered in Pax7‐α1−/− mice. Indeed, the cross‐sectional area (CSA) of the regenerating myofibers in Pax7‐α1−/− mice was strikingly smaller in comparison with Pax7‐α1+/+ mice 28 days post‐injury (−40%, P < 0.001, Fig 2B and C). Due to this decrease in myofiber size, a profound decrease in muscle mass was still observed 1 month after injury in Pax7‐α1−/− animals as compared with the Pax7‐α1+/+ animals (−19%, P < 0.001, Fig 2D). This important loss of mass was also noticed in gastrocnemius (GAS) muscles of Pax7‐α1−/− as compared with Pax7‐α1+/+ animals (−18.8%, P < 0.01, Fig EV2A), showing that this effect was evident among different muscles with different metabolic characteristics. Intriguingly, the number of myofibers per muscle was remarkably increased in Pax7‐α1−/− muscles as compared with the control muscles (+55%, P < 0.001; Fig 2E). A recent study suggests that a slow‐dividing MuSC population retains long‐term self‐renewal potency (Ono et al, 2012). In our study, quantification of Edu+ myogenic cells during skeletal muscle regeneration showed the sustained proliferation of MuSCs in TA muscles of Pax7‐α1−/− mice (Fig 2F and G). This was not due to the presence of a higher number of Ly‐6C/GhiF4/80low macrophages (Fig EV2B and C) that sustain MuSC proliferation in this model of muscle regeneration (Mounier et al, 2013).
Figure 2. Effects of AMPKα1 deletion on skeletal muscle homeostasis.
-
A–ETibialis anterior (TA) muscles from Pax7‐CreERT2/+:AMPKα1fl/fl mice injected with PBS (Pax7‐α1+/+ mice) or tamoxifen (2 mg/mouse; Pax7‐α1−/− mice) were analyzed before (day 0) and 28 days after cardiotoxin (CTX) damage. (A) Number of nuclei per fiber, (B) cross‐sectional area (CSA), (D) ratio of TA mass per body mass and (E) number of fibers per muscle were calculated. (C) Hematoxylin–eosin staining of TA muscles.
-
F, G(F) Proliferation of MuSCs after CTX injury using Edu incorporation and (G) number of myogenic cells per mg of muscle 6 days after CTX damage were quantified.
Figure EV2. Muscle stem cell microenvironment.
-
AMass of gastrocnemius (GAS) muscles from Pax7‐CreERT2/+:AMPKα1fl/fl mice injected with PBS (Pax7‐α1+/+ mice) or tamoxifen (2 mg/mouse; Pax7‐α1−/− mice) were analyzed 28 days after cardiotoxin (CTX) damage. Ratio of muscle mass per body mass was calculated.
-
BPopulations of Ly‐6C/GhiF4/80low and Ly‐6C/GnegF4/80hi macrophages in regenerating tibialis anterior (TA) muscles of Pax7‐α1+/+ or Pax7‐α1−/− mice were quantified in percentage of total F4/80+ cells.
-
CRepresentative dotplots of (B) at day 3 of regeneration.
-
D–HTibialis anterior (TA) muscles from AMPKα1fl/fl (HSA‐α1+/+) and HSA‐Cre+/−:AMPKα1fl/fl (HSA‐α1−/−) mice were removed before (day 0) or 28 days after CTX damage. (D) Number of Pax7+ per 100 fibers, (E) cross‐sectional area and (F) ratio of muscle mass per body mass were calculated. (G) Hematoxylin–eosin staining of day 28 regenerating TA muscles. (H) AMPKα1 expression in liver (Li), heart (He), soleus (So) muscle, GAS (Gc) muscle and TA muscle from AMPKα1fl/fl (HSA‐α1+/+) and HSA‐Cre+/−:AMPKα1fl/fl (HSA‐α1−/) was verified by Western blot.
-
I–KMuSCs were extracted from total hindlimbs of Pax7‐LKB1+/+ and Pax7‐LKB1−/− mice. Pax7Ki67MyoD labeling was performed after 48 h of culture in differentiation conditions. (I) Percentage of Pax7+Ki67/MyoD− (quiescent cells), Pax7+Ki67/MyoD+ (activated cells), Pax7−Ki67/MyoD+ (differentiating cells) and Pax7−Ki67/MyoD− cells (differentiated cells), and (J) fusion index were calculated. (K) Pax7 (green), Ki67/MyoD (red), nuclei (blue) labeling of MuSCs. White arrows show quiescent Pax7+ cells.
AMPKα1 deficiency in MuSC niche does not regulate MuSC homeostasis
Stem cells require cues from their microenvironment to regulate their fate (Morrison & Spradling, 2008). In skeletal muscle, MuSCs lie quiescent along the myofiber in an anatomical niche that is critical for the maintenance of quiescence (Voog & Jones, 2010; Yin et al, 2013). To decipher the influence that the microenvironment exerts on MuSCs, we studied HSA‐Cre+/−:AMPKα1fl/fl mice (HSA‐α1−/− mice) in which AMPKα1 was specifically depleted in the myofiber (Miniou et al, 1999) (Fig EV2H). We did not observe any phenotype in the HSA‐α1−/− mice after injury (Fig EV2D–G), indicating that AMPKα1 expressed by the myofiber does not play a major role in the regulation of MuSC homeostasis, although it has major effects on the myofiber homeostasis/metabolism, as we previously reported (Mounier et al, 2009; Lantier et al, 2010).
Altogether, these results demonstrate that AMPKα1 is a key regulator of adult MuSC fate and strongly support that AMPKα1 is involved in the negative regulation of MuSC self‐renewal and/or could contribute in promoting myogenesis.
Upstream kinases of AMPK and MuSC self‐renewal
LKB1, an upstream kinase of AMPK, has an essential role in HSC homeostasis through pathways that are independent of AMPK (Gan et al, 2010; Gurumurthy et al, 2010; Nakada et al, 2010). To test whether AMPKα1 regulates MuSC self‐renewal independently of LKB1, LKB1−/− MuSCs were induced to fully differentiate and then were labeled for Pax7, Ki67, and MyoD expression. The number of Pax7+Ki67/MyoD− nuclei was not different in LKB1−/− MuSCs as compared with WT MuSCs (Fig EV2I–K) after 2 days in differentiation medium. These results suggest that AMPKα1 acts on MuSC self‐renewal independently of LKB1 activity.
AMPKα1 deficiency leads to an increase of glycolytic metabolism
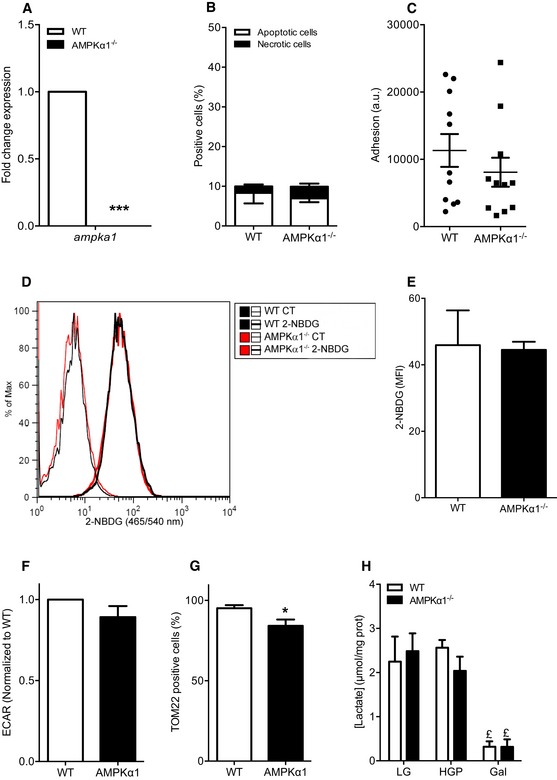
To analyze whether loss of AMPKα1 in MuSCs altered glycolytic or oxidative metabolism, we used MuSCs as well as myogenic precursor cells (MPCs) when experiments required large number of cells. MPCs are long‐term cultured muscle stem cells sharing the main myogenic features with MuSCs. Of note, adhesion and apoptosis, two cellular processes that may be altered with time and passages and may impact their fate, were not affected in AMPKα1−/− MPCs (Fig EV3A–C). Pyruvate kinase (PK) is a key enzyme of glycolysis, converting the phosphoenol‐pyruvate into pyruvate. In skeletal muscle cells, only PKM1 and PKM2 isoforms are expressed (Gao & Cooper, 2013). PKM2 promotes “aerobic glycolysis” (or Warburg effect), whereas PKM1 is associated with the oxidative metabolism (Christofk et al, 2008). Recently, Ryall et al (2015) showed that expression of PKM2 isoform predominates over PKM1 isoform in cultured FACS‐isolated satellite cells (Ryall et al, 2015). In AMPKα1−/− MPCs, pkm1 expression was decreased by 32% (P < 0.05), while pkm2 expression was increased by 48% (P < 0.05) as compared with WT MPCs (Fig 3A), suggesting the use of a more glycolytic metabolism by AMPKα1−/− MPCs. An increase in glycolysis in the absence of AMPKα1 was supported by the observation that AMPKα1−/− MPCs exhibited higher lactate concentration as compared with WT MPCs after 24 h in standard differentiation medium (+57%, P < 0.05; Fig 3B).
Figure EV3. Metabolic characteristics of AMPKα1‐depleted muscle precursor cells.
-
AGene expression of ampka1 in MPCs was quantified by qPCR.
-
BApoptosis and necrosis of WT and AMPKα1−/− MPCs in proliferating conditions were analyzed by flow cytometry using annexin V/propidium iodide labeling.
-
CMPC adhesion was quantified 6 h after seeding.
-
D, EMPCs were cultured in proliferating conditions for 24 h and further incubated 3 h with 20 μM 2‐NBDG: (D) representative histogram of 2‐NBDG labeling and (E) median fluorescence intensity (MFI) of 2‐NBDG labeling in MPCs.
-
FExtracellular acidification rate (ECAR) of WT and AMPKα1−/− MPCs was measured.
-
GPercentage of TOM22‐positive MPCs was quantified. MPCs that express TOM22 below the level of detection for TOM22 antibody are negative for TOM22 in these conditions.
-
HMuSCs were cultured for 48 h in differentiation conditions under glycolytic [25 mM glucose + 1 mM pyruvate (HGP) or 5 mM glucose (LG)] or oxidative [10 mM galactose (Gal)] stimulation and lactate concentration were quantified in supernatants.
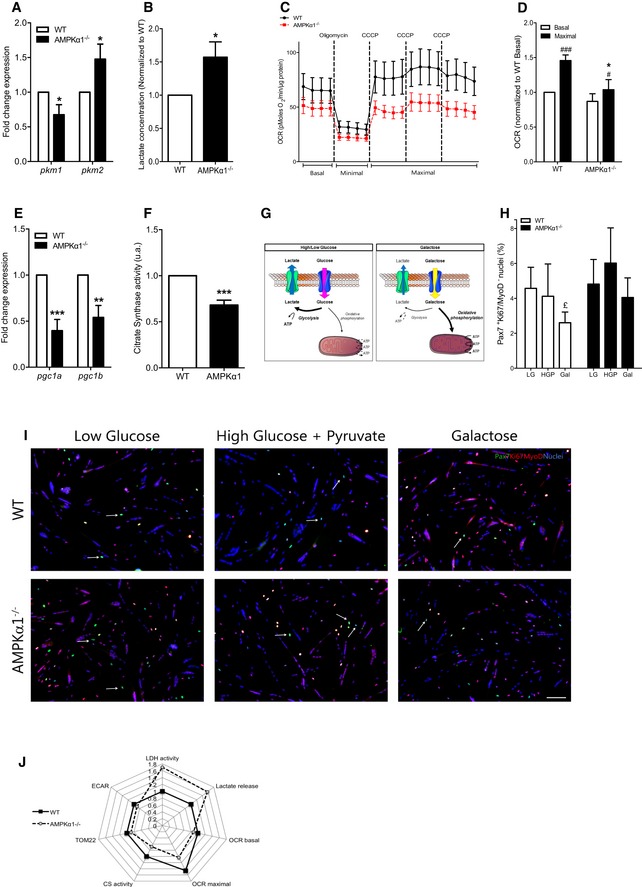
Figure 3. Effects of AMPKα1 deficiency on muscle stem cell metabolism.
-
A, B(A) Expression of pkm1 and pkm2 in WT and AMPKα1−/− MPCs was quantified by qPCR, and (B) lactate concentration in the culture medium was measured after 24 h of culture in differentiation conditions.
-
C, DBasal, minimal and maximal oxygen consumption rate (OCR) of WT and AMPKα1−/− MPCs were measured (see Materials and Methods): (C) OCR kinetics and (D) OCR means.
-
EExpression of pgc1a and pgc1b in MPCs was quantified by qPCR.
-
FCitrate synthase activity was quantified in WT and AMPKα1−/− MPCs.
-
GSchematic representation of metabolism modulation in HGP/LG and Gal conditions.
-
H, IMuSCs were extracted from total hindlimb muscles and Pax7Ki67MyoD labeling was performed after 48 h of culture in differentiation conditions under glycolytic [5 mM glucose (LG) or 25 mM glucose + 1 mM pyruvate (HGP)] or oxidative [10 mM galactose (Gal)] stimulation: (H) percentage of quiescent Pax7+Ki67/MyoD− cells in MuSC cultures were quantified, (I) Pax7 (green), Ki67/MyoD (red), nuclei (blue) MuSC labeling under the various conditions. White arrows show Pax7+ quiescent cells.
-
JRadar graph representing normalized data from LDH activity, lactate release, OCR basal and maximum, TOM22 expression and ECAR from WT and AMPKα1−/− MPCs.
To further characterize the role of AMPKα1 in the modulation of metabolism, we measured the oxygen consumption rate (OCR or “mitochondrial respiration”, an indicator of mitochondrial oxidative activity) of MPCs. AMPKα1−/− MPCs were not able to fully respond to an energetic stress induced by a bypass of the respiratory chain after incubation with carbonyl cyanide m‐chlorophenylhydrazone (CCCP) (Leblanc, 1971). Actually, OCR of WT MPCs was increased by 45% (P < 0.001), whereas mitochondrial respiration of AMPKα1−/− MPCs was only increased by 19% after CCCP incubation (P < 0.05, Fig 3C and D), suggesting that the total electron transport capacity was altered in the absence of AMPKα1. This triggered a difference of 1.23 fold between WT and AMPKα1−/− MPC maximal respiration (P < 0.05, Fig 3D), associated with no modifications of extracellular acidification rate in basal condition (ECAR, Fig EV3F). This impairment of mitochondrial respiration of AMPKα1−/− MPCs could be explained by a defect in mitochondrial biogenesis. Indeed, a significant decrease of pgc1a and pgc1b expression (−59%, P < 0.001 and −45%, P < 0.01, respectively; Fig 3E), of citrate synthase (a critical enzyme of Krebs Cycle) activity (−31.8%, P < 0.001, Fig 3F), and of the number of TOM22 (a core component of the mitochondrial outer membrane translocase) positive cells (−11%, P < 0.05, Fig EV3G) in AMPKα1−/− MPCs as compared with WT MPCs was observed. As AMPK promotes the translocation to the plasma membrane of the glucose transporter mainly expressed in muscle cells (GLUT4) (Mounier et al, 2015), we used a fluorescent glucose analogue, the 2‐(N‐(7‐nitrobenz‐2‐oxa‐1,3‐diazol‐4‐yl)amino)‐2‐deoxyglucose (2‐NBDG), to examine glucose uptake. No difference in 2‐NBDG accumulation within WT MPCs and AMPKα1−/− MPCs was observed (Fig EV3D and E), suggesting that the decreased oxidative metabolism in AMPKα1−/− MPCs is not due to altered glucose uptake.
Tailoring the metabolism modulates MuSC self‐renewal in an AMPKα1‐dependent pathway
To test whether metabolism can modulate self‐renewal, we induced WT MuSCs to fully differentiate and quantified the return to quiescence (Pax7+Ki67/MyoD− cells) in various culture media that drive different metabolism of the cells (Fig 3G–I) (Gohil et al, 2010; Ryall et al, 2015). Two days in low glucose (5 mM, LG) and high glucose (25 mM glucose and 1 mM pyruvate, HGP) concentrations were two conditions that allow cells to perform mainly glycolysis (Gohil et al, 2010; Ryall et al, 2015) (Fig 3G), and here assessed by a high lactate concentration in the medium in both cell types (Fig EV3H). By contrast, galactose condition (10 mM, Gal) drove cells to shift their metabolism toward oxidative phosphorylation (Figs 3G and EV3H). Indeed, galactose has to be converted to glucose‐6‐phosphate for being further metabolized through an ATP‐consuming reaction. Therefore, cells incubated with galactose rely on oxidative phosphorylation to generate ATP (Ryall et al, 2015). A non‐glycolytic metabolism (Gal) markedly reduced WT MuSC self‐renewal as compared with glycolytic conditions (−34%, P < 0.05 and −18% for LG and HGP, respectively) (Fig 3H and I), proving that a shift from glycolysis to oxidative phosphorylation can negatively regulate the return to quiescence of MuSCs. Remarkably, this decrease in self‐renewal was not observed in AMPKα1−/− MuSCs (Fig 3H and I). Altogether, these results demonstrate, for the first time, that stem cell self‐renewal can be modulated by shifting their metabolism in an AMPKα1‐dependent pathway (Fig 3J).
Activation of AMPKα1 regulates LDH activity and MuSC self‐renewal
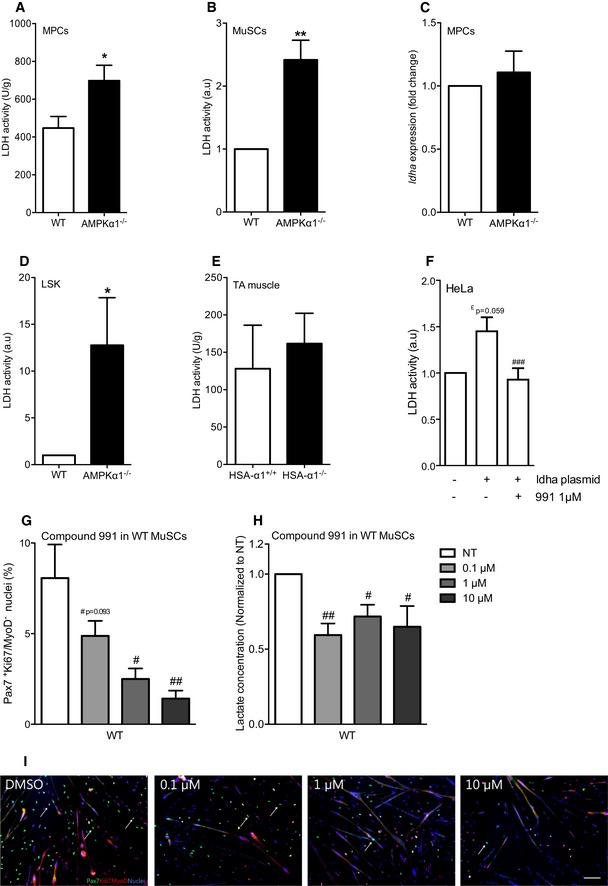
As LDH converts pyruvate into lactate, this enzyme is a defined regulator of aerobic glycolysis versus oxidative phosphorylation. LDH activity was increased in the absence of AMPKα1 in both MPCs and freshly isolated MuSCs (+73%, P < 0.05 and +142%, P < 0.01; respectively, Fig 4A and B), whereas no modification of its expression at the mRNA level was observed (Fig 4C). Interestingly, modification of LDH activity in the absence of AMPKα1 was also found in HSCs (LSK, Fig 4D), but not in muscles in which AMPKα1 was specifically depleted in the myofiber (HSA‐α1−/−, Figs 4E and EV4A). PK reaction is the last step in the glycolytic pathway, which produces pyruvate molecules that can be converted into lactate by LDH. In MPCs, the increase of LDH activity in the absence of AMPKα1 was not due to a higher PK activity (Fig EV4B). Furthermore, AMPK activation with a potent and specific AMPK activator (compound 991) led to the inhibition of LDH activity in HeLa cells [a model chosen because MPCs are hardly transfected and because HeLa cells lack LKB1 (Tiainen et al, 1999)] transfected with LDHA plasmid (Fig 4F). Lastly, specific AMPK activation with compound 991 triggered the decrease of self‐renewal in WT MuSCs (Fig 4G–I) in a dose‐dependent way, associated with a concomitant decrease of lactate concentration in the media (Fig 4H). This was AMPKα1 dependent since AMPKα1−/− cells did not respond to 991 (Fig EV4C). These results indicate a role of AMPKα1 activity in the modulation of MuSC self‐renewal through the regulation of its new functional target LDH.
Figure 4. AMPKα1–LDH, a novel pathway regulating muscle stem cell fate.
-
A, BLDH activity was quantified in (A) MPCs and in (B) freshly isolated MuSCs.
-
CLdha expression in MPCs was quantified by qPCR.
-
D, ELDH activity in (D) freshly isolated hematopoietic stem cells (LSK) and in (E) HSA‐α1+/+ and HSA‐α1−/− tibialis anterior (TA) muscles.
-
FLDH activity in HeLa cells transfected with ldha plasmid and activated with 1 μM of compound 991.
-
G, HPax7Ki67MyoD labeling was performed on WT MuSCs after 48 h of culture in differentiation conditions with increasing concentration of compound 991: (G) percentage of self‐renewing cells was quantified; (H) lactate concentration in the culture medium supplemented with 991 during 48 h was measured.
-
IPax7 (green), Ki67/MyoD (red), nuclei (blue) labeling of MuSCs. White arrows show quiescent Pax7+ cells.
Figure EV4. LDH activity is regulated by AMPKα1.
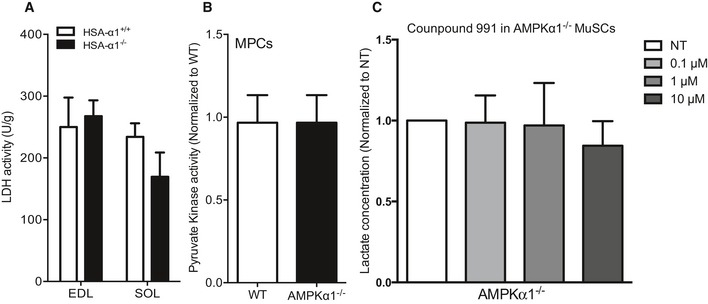
- LDH activity from HSA‐α1+/+ and HSA‐α1−/− EDL and soleus (SOL) muscle fibers was quantified.
- Pyruvate kinase activity was quantified in WT and AMPKα1−/− MPCs.
- Lactate concentration in the culture medium from AMPKα1−/− MuSCs cultured in differentiation conditions with 991 (0.1, 1 or 10 μM) during 48 h.
Lactate dehydrogenase modulates MuSC self‐renewal in vitro and in vivo
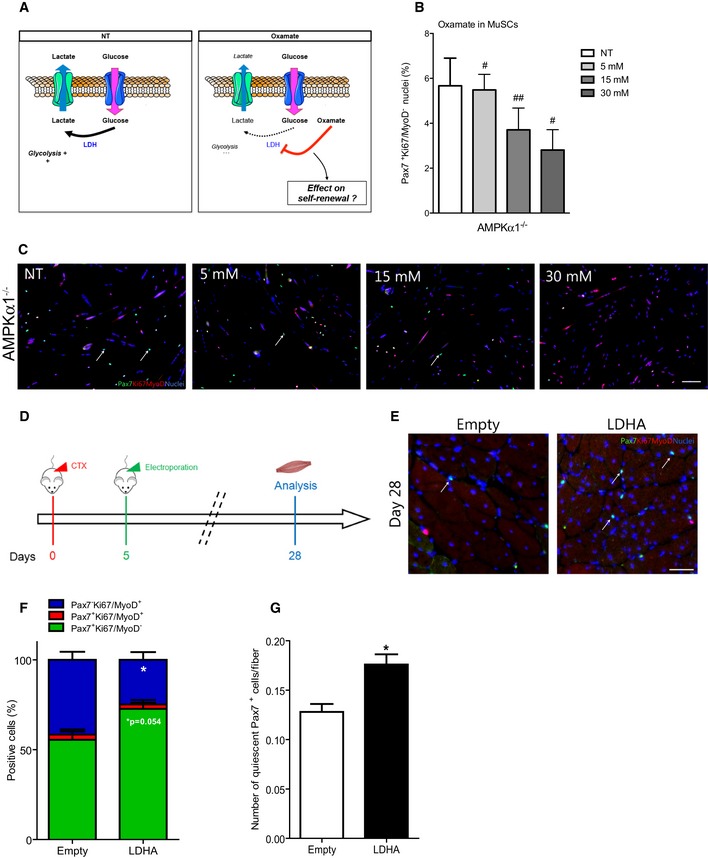
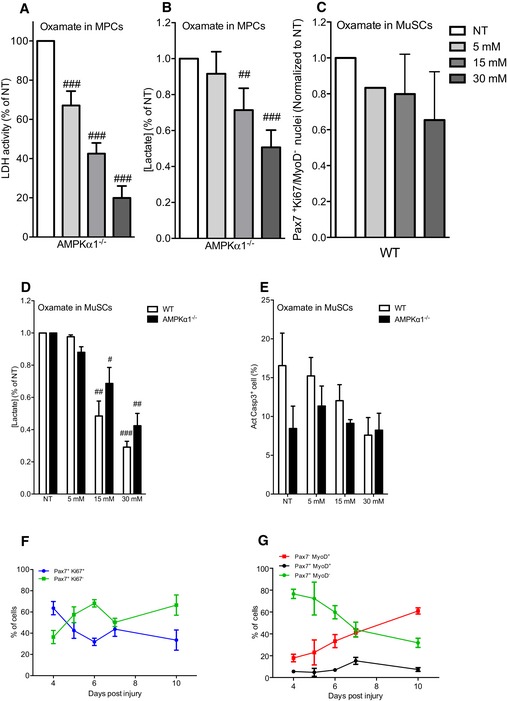
To evaluate the functional role of LDH on MuSC fate, we used oxamate, an allosteric inhibitor of LDH (Fig 5A) (Wilkinson & Walter, 1972) at concentrations shown to be efficient and non‐toxic in mammalian cells (Ramanathan et al, 2005; Miskimins et al, 2014). Incubation of MuSCs with increasing concentrations of oxamate induced a progressive decrease of LDH activity in MPCs (Fig EV5A) and lactate concentration in MPC and MuSC supernatants (Fig EV5B and D). Remarkably, inhibition of LDH activity led to a substantial decrease in self‐renewal in WT and in a stronger way in AMPKα1−/− MuSCs in a dose‐dependent manner (Figs 5B and C, and EV5C) without increase of MuSC apoptosis (Fig EV5E), demonstrating the importance of LDH activity in the return to quiescence of MuSCs. Of note, this decrease in self‐renewal in AMPKα1−/− MuSCs after inhibition of LDH activity phenocopied the decreased self‐renewal observed in WT MuSCs upon AMPK activation (Fig 4G–I). Finally, empty or LDHA (the main LDH isoform expressed in muscle cells) expression plasmids were electroporated in TA muscles 5 days after CTX injury to transfect myogenic cells as previously described (Abou‐Khalil et al, 2009; Griffin et al, 2009) (Fig 5D), a time when MuSC proliferation was decreasing (Figs 2F, and EV5F and G). In LDHA electroporated muscles, both the percentage of Pax7+Ki67/MyoD− cells and the total number of Pax7+Ki67/MyoD− cells per fiber were increased 28 days after injury (+30%, and +37%, respectively, P < 0.05; Fig 5F and G), confirming in vivo the essential role of LDHA in MuSC fate. Overall, these results show that AMPKα1 participates to the regulation of MuSC fate through LDH, a new functional target, that is a direct regulator of the oxidative phosphorylation/aerobic glycolysis balance that can be shifted to meet cellular needs.
Figure 5. Effects of LDHA activity modulation on muscle stem cell fate in vitro and in vivo .
-
ASchematic representation of the effect of oxamate on LDH activity.
-
B, CPax7Ki67MyoD labeling was performed on WT and AMPKα1−/− MuSCs after 48 h of culture in differentiation medium with increasing concentration of oxamate: (B) percentage of self‐renewing MuSCs was quantified; (C) Pax7 (green), Ki67/MyoD (red), nuclei (blue) labeling of AMPKα1−/− MuSCs. White arrows show quiescent Pax7+ cells.
-
DProtocol used for LDHA overexpression in tibialis anterior muscles by electroporation of empty or LDHA plasmid 5 days after injury.
-
EPax7 (green), Ki67/MyoD (red), nuclei (blue) labeling of muscle electroporated with empty and LDHA plasmids. White arrows show Pax7+ quiescent cells.
-
F, G(F) Percentage of Pax7+Ki67/MyoD− (green, quiescent cells), Pax7+Ki67/MyoD+ (red, activated cells) and Pax7−Ki67/MyoD+ cells (blue, differentiated cells), and (G) number of quiescent (Pax7+Ki67/MyoD−) MuSCs per fiber were calculated.
Figure EV5. Regulation of LDH activity in vitro and muscle stem cell fate in vivo .
-
A, B(A) LDH activity and (B) lactate concentration were quantified from AMPKα1−/− MPCs cultured in differentiation conditions with oxamate (0 (NT), 5, 15 and 30 mM) during 48 h.
-
CPercentage of Pax7+Ki67/MyoD− (quiescent cells) from WT MuSCs cultured in differentiation conditions with oxamate (0 (NT), 5, 15 and 30 mM) during 48 h was calculated.
-
DLactate concentration in the culture medium of WT and AMPKα1−/− MuSCs cultured in differentiation conditions with oxamate (0 (NT), 5, 15 and 30 mM) during 48 h was quantified.
-
EApoptosis was assessed by the number of positive cell for active Casp3 by immunofluorescence in presence of oxamate (0 (NT), 5, 15 and 30 mM) during 48 h.
-
FPax7+Ki67+ (proliferating) and Pax7+Ki67− (non‐proliferating) MuSCs were quantified.
-
GPax7+Myo− (undifferentiated), and Pax7+MyoD+ (activated,) and Pax7−MyoD+ (differentiated) MuSCs were quantified during skeletal muscle regeneration.
Discussion
Overall, our work shows that the master regulator of cellular energy, AMPKα1, regulates self‐renewal of MuSCs, which is the first evidence of such a property for this pleiotropic kinase and the demonstration that energetic metabolism controls MuSC homeostasis. Our results show that the return to quiescence of MuSCs can be modulated by shifting their metabolism in an AMPKα1‐dependent pathway through the regulation of a new functional target, LDH, that in turns controls the oxidative phosphorylation/aerobic glycolysis balance.
Deletion of AMPKα1 in MuSCs drastically enhances their self‐renewal in vitro, ex vivo and in vivo (+367, +147 and +55%, respectively; Figs 1B and E, and 2E). To our knowledge, this is the strongest phenotype ever described in the literature regarding an increase of MuSC self‐renewal. Few studies have related moderate increase of MuSC self‐renewal during skeletal muscle regeneration (Abou‐Khalil et al, 2009; Kitamoto & Hanaoka, 2010). Notably, various studies have described that an important defect in self‐renewal ability leads to a decrease in MuSC number, resulting in impaired/delayed skeletal muscle regeneration (Shea et al, 2010; Le Grand et al, 2012; Mourikis et al, 2012). Our data indicate, for the first time, that an augmentation of the return to quiescence of MuSCs is also associated with an alteration of skeletal muscle homeostasis. These results are consistent with a model in which the maintenance of the tune balance between MuSC differentiation (essential to provide newly formed myofibers) and MuSC self‐renewal (essential to replenish MuSC pool) is required for skeletal muscle homeostasis.
Recently, it has been demonstrated that LKB1 maintains stemness of HSCs independently of AMPK (Gan et al, 2010; Gurumurthy et al, 2010; Nakada et al, 2010). One study reported an increase of Pax7+ cells when LKB1 was deleted in MuSCs using MyoDCre/+, which is a CRE recombinase preferentially expressed in already activated muscle cells (Shan et al, 2014). Moreover, analysis was performed only at early time point (8 days) after injury and the status of Pax7+ cells has not been evaluated (i.e., quiescence, activation/proliferation, differentiation). In our study, MuSC self‐renewal is not affected in Pax7‐LKB1−/− mice as compared with Pax7‐AMPKα1−/− (Pax7‐α1−/−) mice, suggesting that AMPKα1 plays an LKB1‐independent role in MuSC self‐renewal during muscle regeneration.
Required‐energetic shift for stem cell activation and differentiation has been suggested in HSCs. These later rely primarily on glycolysis to generate ATP and are less dependent on mitochondrial oxygen‐consuming metabolism (Kim et al, 1998) than more differentiated cells (Simsek et al, 2010). LKB1 deficiency in HSCs alters mitochondrial compartment and maximal oxygen consumption, an oxidative phosphorylation readout (Gan et al, 2010; Gurumurthy et al, 2010). It has been previously evidenced that HSCs and MuSCs share common signaling pathways regulating their fate (i.e., FoxOs and Ang1/Tie2 signaling for the self‐renewal). Our results show a defect of mitochondria function in AMPKα1−/− MuSCs, suggesting that they seem also to be metabolically close. A metabolic switch that conditions lineage commitment of HSCs has been recently identified (Oburoglu et al, 2014). In fact, the commitment of human and murine HSCs to the erythroid lineage is dependent upon glutamine metabolism (Oburoglu et al, 2014). However, it remains to determine whether metabolic flux directly affects adult stem cell fate. The data presented here indicate that tailoring metabolism via a shift from glycolysis to oxidative phosphorylation has the capability to regulate the return to quiescence of MuSCs in an AMPK‐dependent pathway (Fig 3G–I). Furthermore, the close environment of MuSCs gathers the same partners as those found in the cancer stem cell (CSC) niche and several signaling pathways regulating CSCs have been involved in the regulation of MuSC fate (Abou‐Khalil et al, 2009; Visvader & Lindeman, 2012; Yin et al, 2013). It will be therefore of interest to determine whether AMPK activation, associated with tumor suppressor functions, can break CSC self‐renewal by lifting their dormancy and pushing them toward differentiation.
AMPK activation promotes a switch from rapid glucose uptake, glycolysis and lactate output (the Warburg effect observed in most tumoral cells) to oxidative metabolism, therefore reducing tumors in mouse (Faubert et al, 2013). In this regard, it is interesting to note that AMPKα1−/− MuSCs share common characteristics with CSCs regarding their proliferation and the Warburg‐like effect (i.e., increase in aerobic glycolysis pathway). In our normoxic in vitro experimental design of MuSC fate, the increased release of lactate and the alteration of mitochondrial respiration revealed that AMPKα1−/− MPCs are mainly glycolytic, producing energy independently of mitochondria and oxygen. Similar glycolytic status has been found in induced pluripotent, mesenchymal, and neural progenitor stem cells (Folmes et al, 2011; Candelario et al, 2013; de Meester et al, 2014). To note, Fu et al (2015) showed a decrease in lactate release in proliferating conditions, claiming that AMPKα1‐deficient MuSCs rely more on oxidative metabolism at the time of their activation. However, while MuSCs activate within 24 h after injury (Rodgers et al, 2014), Fu et al (2015) analyzed MuSC activation 3 days after injury (Fu et al, 2015), a time point characterized as the highest level of myogenic cell proliferation (Figs 1H and EV5F) (Murphy et al, 2011; Le Grand et al, 2012). Intriguingly, while it has been demonstrated that Sirt1‐AMPKα1 signaling pathway is required for MuSC activation and that early MuSC activation is intertwined with mitochondrial biogenesis and with mTORC1 signaling pathway inhibition (Rodgers et al, 2014; Tang & Rando, 2014), Sirt1 inhibition and glycolysis (PKM1 to PKM2 switch) have been described to be crucial for MuSC activation (Ryall et al, 2015). This may be explained by the various time points, and readouts have been used for the investigation of MuSC activation in these studies. Our study focused on later time points, long after activation and expansion phases of MuSCs and on the balance between differentiation and self‐renewal. Our results suggest that at this time point, MuSCs skew their metabolism toward oxidative metabolism pathway to enter into differentiation. To clearly define intertwining between MuSC fate and metabolism, the use of new technological advances such as single cell‐metabolomic profiling will lead to a deeper understanding of the novel cell fate determinants, which maintain MuSC stemness during skeletal muscle regeneration.
Historically, LDH has been described as a non‐limiting enzyme and as being expressed at high levels in the cells. This concept, established in the metabolism/biochemistry field, has been recently challenged since LDH activity is deregulated in CSCs (Augoff et al, 2015). This may be due to a switch in LDH isoform expression (LDHB less active to LDHA more active) associated with VEGF secretion (Nishikawa et al, 1991; Kim et al, 2014). Moreover, LDH tetramerization, which is required for LDH to be active, can be regulated by phosphorylation (Augoff et al, 2015). Our results reveal that in adult stem cells (MuSCs and HSCs), LDH is regulated and acts as a limiting enzyme, as it was suggested in CSCs (Augoff et al, 2015), whereas no regulation is noticed in differentiated cells. We showed that AMPKα1 modulates MuSC self‐renewal specifically through the regulation of LDH activity, and not its expression. Interestingly, LDH activity increases in AMPKα1‐deficient MuSCs and there is a functional direct link between AMPK activity, LDH activity, and the rate of MuSC renewal in vitro and in vivo. Furthermore, LDHA has been recently described as a putative new substrate of AMPK, with S274 and VHPVSTMIK identified by mass spectroscopy as phosphorylation site and peptide sequence, respectively (Schaffer et al, 2015). Further investigations will identify whether several LDH isoforms are operative in MuSCs to control their differentiation/self‐renewal balance. Finally, Faubert et al (2014) showed that HIF‐1α (regulator of multiple enzymes of the glycolysis pathway) and LDHA protein are up‐regulated in LKB1−/− MEFs (Faubert et al, 2014). However, protein level of HIF‐1α is identical in WT and AMPKα1−/− MPCs (data not shown), suggesting that AMPK regulates LDH activity independently of HIF‐1α in our conditions. Interestingly, our data show the possibility of tailoring the metabolic makeup of MuSCs and of modulating their fate through the delivery of specific nutrients, indicating that the close environment of MuSC directly acts on their metabolism and fate. In this context, it will be essential to understand how MuSCs integrate changes from metabolic flux and other physiological parameters under homeostatic and stress conditions. For example, low oxygen tensions influence the maintenance of stem cell quiescence (Simon & Keith, 2008; Mohyeldin et al, 2010; Latil et al, 2012; Spencer et al, 2014), and notably MuSCs (Latil et al, 2012).
In conclusion, our findings report a new role of the master regulator of stress response pathway AMPKα1 in tailoring the metabolic makeup of MuSCs and in modulating their fate. Moreover, the present study identifies LDH as a new functional target of AMPKα1 in MuSCs, where it is a direct regulator by which the oxidative phosphorylation/aerobic glycolysis balance can be shifted to meet appropriate cellular needs.
Materials and Methods
Mouse experiments
Experiments were conducted on adult animals (8–25 weeks old). AMPKα1−/− (Jorgensen et al, 2004) and AMPKα2−/− (Viollet et al, 2003) mouse strains were used. HSA‐Cre+/−:AMPKα1fl/fl mice were obtained by crossing HSA‐Cre+/− mice (Miniou et al, 1999) with AMPKα1fl/fl mice (Mounier et al, 2013). Pax7‐CreERT2/+:AMPKα1fl/fl and Pax7‐CreERT2/+:LKB1fl/fl mice were obtained by crossing Pax7‐CreERT2/+ mice (Lepper et al, 2009) with AMPKα1fl/fl and LKB1fl/fl (Gan et al, 2010). Mice were bred, and experiments were conducted in compliance with French and European legislation. Animal facilities are fully licensed by French authorities, and protocols have been validated by ethical committee. Activation of CreERT2 was caused by daily tamoxifen (2 mg/mouse, MP Biochemical) intraperitoneal (i.p.) injections during 4 days. The first injection was performed 1 week before the experiments. Control mice were injected with 1× PBS. Skeletal muscle injury was caused by intramuscular injection of CTX (Latoxan) in the TA muscle or in the GAS of male animals (50 μl per TA or 200 μl per GAS, 12 μM).
MuSC extraction, culture and treatments
Muscle stem cells (MuSCs) were extracted as previously described (Joe et al, 2010). Briefly, mouse muscle hindlimbs from adult male or female animals were dissected and digested in collagenase–dispase (Roche) at 37°C for 1 h. Erythrocytes were removed with Ammonium‐Chloride‐Potassium (ACP) lysis buffer (Lonza), and muscle mononucleated cells were stained with anti‐CD45 (eBioscience), anti‐CD31 (eBioscience), anti‐Sca1 (eBioscience), anti‐CD34 (eBioscience), and anti‐α7integrin (AbLab). CD31/CD45/Sca1−CD34/α7integrin+ cells were sorted using Aria I or II cytometer (BD). MuSCs were seeded at 3,000 cells/cm² for amplification during 5–7 days in proliferation medium [DMEM/F12 (Life Technologies), 20% Foetal Bovine Serum (FBS, Life Technologies) and 2% G/Ultroser (Pall Inc)]. MuSCs were then seeded at 30,000 cells/cm² in proliferating medium for 6 h then switched to differentiation medium [DMEM/F12, 2% horse serum (Life Technologies)]. Various treatments were then applied. Differentiation medium was supplemented with either 5, 15 or 30 mM of oxamate (Sigma‐Aldrich), or with either 0.1, 1 or 10 μM of compound 991 (Sirochem). In some experiments, differentiation medium was replaced by glucose‐ and pyruvate‐free DMEM (Life Technologies) containing 2% horse serum and supplemented with 25 mM glucose (Sigma‐Aldrich), and 1 mM pyruvate (Life Technologies) (HGP) or 5 mM glucose (LG) or 10 mM galactose (Gal) (Sigma‐Aldrich). After 2 days of differentiation, supernatants were harvested for lactate analysis and Pax7Ki67MyoD or active caspase‐3 labeling was performed on cells.
MuSC labeling
Cells were fixed with 4% paraformaldehyde, permeabilized with 1× PBS 0.5% Triton X‐100, and blocked with 1× PBS 4% bovine serum albumin (BSA) for at least 2 h at room temperature. Primary antibodies against Pax7 (Hybridoma Bank), Ki67 (Abcam) and MyoD (Santa Cruz), or active caspase‐3 (Abcam) were incubated in 1× PBS 2% BSA overnight at 4°C. Secondary antibodies (Jackson Immunoresearch Inc.) were incubated 1 h at 37°C in 1× PBS, and streptavidin (Jackson Immunoresearch Inc.) was used to amplify Pax7 signal at 37°C for 30 min in 1× PBS. Nuclei were labeled with Hoechst (Sigma‐Aldrich).
In vivo proliferation
5‐ethynyl‐2′‐deoxyuridine (EdU, Life Technologies) was delivered by i.p. injection (200 μg/mouse) 8 h before sacrifice. MuSCs were isolated as described above, and proliferating MuSCs were calculated in percentage of EdU+ cells among total CD31/CD45/Sca1−α7integrin+ cells using FACSCanto II cytometer (BD) and FlowJo software.
AMPK activity
Freshly isolated MuSC was homogenized in lysis buffer as previously described (Sakamoto et al, 2006). AMPK complexes were immunoprecipitated from an average number of 400,000 MuSCs using 1 μg of anti‐AMPKα1 or AMPKα2 antibody (kind gift from D. Grahame Hardie, University of Dundee, Scotland, UK), and its phosphotransferase activity was determined toward AMARA peptide (AMARAASAAALARRR) as previously described (Hunter et al, 2011).
In vivo macrophage skewing
Macrophage skewing was analyzed as previously described (Mounier et al, 2013). Briefly, CD45+ cells were isolated from regenerating muscle TA using magnetic beads conjugated to anti‐CD45 antibody (Milteny Biotec) and then incubated with Fc‐block (Milteny Biotec) for 30 min at 4°C. Finally, CD45+ cells were stained with antibody against Ly‐6C/G (eBioscience) and against F4/80 (eBioscience). Percentages of Ly‐6C/GhiF4/80low and Ly‐6C/GnegF4/80hi cells were calculated among total F4/80pos cells using FACSCanto II cytometer (BD) and FlowJo software.
HSC extraction
Lin−Sca1+cKit+ (LSK) cells were extracted as previously described (Starck et al, 2010). Briefly, total bone marrow was flushed from tibiae and femurs with Iscove's modified Dulbecco's medium (IMDM) containing 2% FBS. Erythrocytes were removed with lysis buffer ACK and Lin+ cells were removed by a magnetic cell sort using Lineage Cell Depletion Kit (Miltenyi Biotec) supplemented with anti‐CD19 (eBiosciences), anti‐CD3 (BD Pharmingen), anti‐IL7R (eBiosciences), and anti‐Ter119 (eBiosciences). Lin− cells were labeled with anti‐cKit (BD Pharmingen) and anti‐Sca1 (eBiosciences) antibodies, and LSK cells were sorted using Aria I cytometer (BD).
PCR for AMPK deletion
MuSCs (CD31/CD45/Sca1−CD34/α7integrin+) and non‐myogenic cells (CD45/CD31/Sca1+) were extracted from muscle hindlimbs as previously described, and specific deletion of AMPKα1 was performed as previously described (Mounier et al, 2013).
Isolated myofibers
Single myofibers were isolated from extensor digitorum longus and plantaris as previously described (Abou‐Khalil et al, 2009).
Western blot analysis
Tibialis anterior, soleus, gastrocnemius, heart and liver from AMPKα1fl/fl (HSA‐α1+/+) and HSA‐Cre+/−:AMPKα1fl/fl (HSA‐α1−/−) mice were lyzed in lysis buffer (Mammalian Cell Lysis Kit, Sigma‐Aldrich). 50 μg of each lysate was subjected to 10% acrylamide gel electrophoresis, and transfer was then run overnight on nitrocellulose membrane (Hybond‐Cextra, Amersham Biosciences). Anti‐AMPKα1 antibody (kindly given by Grahame Hardie) was incubated overnight at 4°C. Anti‐sheep antibody coupled to HRP was then incubated for 2 h at room temperature, and membrane was revealed with ECL west femto (Thermo Scientific).
In vivo electroporation
Empty plasmid (pcDNA3) or plasmid encoding for LDH A (pcDNA‐3.2‐DEST‐LDHA‐V5) [5 μg of plasmid in 50 μl of NaCl (900 mM)] was electroporated into regenerating TA muscle from WT mice, 5 days after CTX injury (Mounier et al, 2009). Skeletal muscle regeneration was analyzed 28 days after CTX injury as described below.
Histological and immunohistochemical analysis
For histological analysis, muscles were harvested, snap‐frozen in nitrogen‐chilled isopentane, and kept at −80°C until use. 8‐μm‐thick cryosections were prepared for hematoxylin–eosin (HE) staining or for Pax7Ki67MyoD labeling. For Pax7Ki67MyoD labeling, muscle cryosections were fixed and permeabilized in 100% methanol for 7 min at −20°C. After three washes with 1× PBS, muscle cryosections were sequentially incubated for 5 min in two baths of citric acid (10 mM, pH 6) at 90°C. After three washes with 1× PBS, muscle cryosections were saturated with 1× PBS 4% BSA for at least 2 h at room temperature (RT) and then incubated with antibodies against Pax7 (Hybridoma bank), Ki67 (Abcam) and MyoD (Santa Cruz) overnight at +4°C in 1× PBS 2% BSA. Secondary antibodies (Jackson Immunoresearch Inc.) were incubated 1 h at 37°C in 1× PBS, and streptavidin (Jackson Immunoresearch Inc.) was used to amplify Pax7 signal (37°C for 30 min in 1× PBS). Nuclei were labeled with Hoechst (Sigma‐Aldrich).
Image capture and analysis
HE‐stained muscle sections were entirely recorded with a Zeiss Axiospot microscope connected to an AxioCam Icc5 (Zeiss) camera at 10× and randomly at 20× magnification. For each condition of each experiment, 5 ± 1 randomly chosen fields were counted, representing 986 ± 69 myofibers. Quantitative analysis of skeletal muscle regeneration (number of nuclei per fiber and number of fibers per muscle) was performed using ImageJ software. Cross‐sectional area (CSA) of regenerating myofibers was quantified as described in Liu et al (2013) and Qi et al (2012) and was expressed in μm². Fluorescent‐labeled muscle sections were recorded with a Zeiss Imager Z1 microscope connected to a Coolsnap Myo (Photometrics) camera at 20× magnification. For each condition of each experiment, 9 ± 1 randomly chosen fields were counted, representing 64 ± 4 cells. The number of labeled myogenic cells was calculated using ImageJ software and was expressed as a percentage of total myogenic cells or related to the number of fibers per muscle section. In vitro fluorescent immunolabelings were recorded with a Zeiss Observer Z1 microscope connected to a Coolsnap HQ² (Photometrics) camera at 10× magnification. For each condition of each experiment, 5 ± 1 randomly chosen fields were counted, representing 1,297 ± 213 cells. The number of labeled nuclei was calculated using ImageJ software and expressed as a percentage of total nuclei. Fusion index was calculated as the number of nuclei within myotubes divided by the total number of nuclei.
Muscle precursor cell culture
Myogenic precursor cells were obtained as previously described (Mounier et al, 2009) from TA and gastrocnemius muscles and cultured using standard conditions in proliferating medium (DMEM/F12, 20% FBS, and 2% G/Ultroser). To analyze mitochondrial membrane potential, glycolytic flux, and apoptosis, MPCs were seeded at 3,000 cell/cm2 on gelatin (0.02%) coat in proliferating medium. 24 h later, cells were incubated for 3 h with 20 μM 2‐(N‐(7‐nitrobenz‐2‐oxa‐1,3‐diazol‐4‐yl)amino)‐2‐deoxyglucose (2‐NBDG, Life Technologies) or for 4 h with 10−6 M staurosporine (Sigma‐Aldrich). 2‐NBDG (465/540 nm) and apoptosis (Annexin‐V‐FLUOS Staining Kit, Roche) were analyzed using FACSCanto II cytometer (BD) and FlowJo software. For pyruvate kinase (PK), LDH, OCR, and RT–qPCR assay, MPCs were seeded at 60,000 cell/cm2 on gelatin‐coated plates (0.02%) and lysates were harvested 6 h later. For lactate assay, supernatants were harvested 24 h after seeding. For adhesion study, MPCs were labeled with PKH27 dye (Sigma‐Aldrich) before plating and cell adhesion was quantified 6 h later by fluorimetry using FLUOstar OPTIMA (BMG LABTECH).
Lactate dehydrogenase activity assay
Lactate dehydrogenase activity was quantified as previously described (Ferretti et al, 1997). Briefly, cells were lysed in phosphate buffer containing 0.05% BSA. After three rounds of freezing/defreezing, lysates were centrifuged and protein content was quantified with BCA kit (Pierce). LDH activity was measured by fluorimetry using a spectrophotometer UVmc2 (Safas) and expressed as micromoles of substrate per minute per gram of protein (U/g) or normalized to WT and expressed as arbitrary units (a.u.).
Lactate assay
Lactate concentration in culture medium was measured as previously described (de Meester et al, 2014). Briefly, cell supernatant was recovered and treated with perchloric acid (10% final), and pH was neutralized (pH 7) with KOH/KHCO3. Protein content was quantified using BCA kit (Pierce), and lactate concentration was measured by fluorimetry using a spectrophotometer UVmc² (Safas). Lactate concentration was normalized to WT and expressed as arbitrary units (a.u.).
Citrate synthase activity assay
Six hours after plating, WT and AMPKα1−/− MPCs were lyzed and citrate synthase activity was measured as previously described (Srere & Brooks, 1969; Vial et al, 2011).
Pyruvate kinase activity assay
Pyruvate kinase activity was quantified as previously described (Christofk et al, 2008). Briefly, cells were lyzed in buffer [50 mM Tris–HCl pH 7.5, 1 mM EDTA, 150 mM NaCl, 1% NP‐40, 1 mM DTT and protease inhibitors (Roche)] for 30 min on ice. Protein content was quantified using BCA kit (Pierce), and PK activity was measured in reaction buffer (50 mM Tris–HCl pH 7.5, 100 mM KCl, 5 mM MgCl2, 0.6 mM ADP (Sigma), 0.5 mM PEP (Sigma), 0.18 mM NADH (Sigma), 10 μM FBP (Sigma), and 10 units of LDH) by fluorimetry using a spectrophotometer UVmc2 (Safas). PK activity was normalized to WT and expressed as arbitrary units (a.u.).
Oxygen consumption rate and extracellular acidification rate
Oxygen consumption rate (OCR, pm/min) and extracellular acidification rate (ECAR, mpH/min) were measured using a Seahorse Bioscience XF96 extracellular. MPC medium was replaced by XF assay medium and supplemented with 17 mM glucose (Sigma‐Aldrich), 1 mM GlutaMax (Life technologies), and 0.5 mM pyruvate (Life technologies). OCR and ECAR were measured every 7 min over 140 min. Minimal OCR was measured after one injection of 2 μg/μl of oligomycin, and maximal OCR was measured after three injections of 0.5 mM carbonyl cyanide m‐chlorophenylhydrazone (CCCP).
TOM22 labeling
WT and AMPKα1−/− MPCs were seeded at 60,000 cells/cm2. Six hours after plating, TOM22 labeling was performed. Briefly, MPCs were fixed for 10 min at room temperature with 1× PBS 4% PFA, then were permeabilized for 10 min with 1× PBS 0.5% Triton X‐100, and were incubated with anti‐TOM22 antibodies (Sigma‐Aldrich) overnight at +4°C in 1× PBS containing 2% BSA. Secondary antibodies (Jackson Immunoresearch Inc.) were added for 1 h at 37°C. Finally, nuclei were labeled with Hoechst (Sigma‐Aldrich).
HeLa cell line culture
HeLa cell line was cultured in DMEM high glucose (Life Technologies), 20% FBS. Cells were transfected with a plasmid encoding for LDH A (pcDNA‐3.2‐DEST‐LDHA‐V5) using the CAPHOS kit (Sigma‐Aldrich). Forty‐eight hours later, AMPK was activated with 1 μM of compound 991 and lysates were harvested 15 min after activation for LDH activity assay.
Reverse transcription and quantitative polymerase chain reaction
Total RNA was extracted using Trizol reagent (Life Technologies) and was separated from protein with chloroform. RNA was reverse‐transcribed using Superscript II Reverse Transcriptase (Invitrogen). qPCR was carried out on Bio‐Rad CFX. Reaction occurred in a final volume of 20 μl: 3 μl of cDNA, 10 μl of LightCycler® 480 SYBR Green I Master and 10 μM of primers. After initial denaturation, amplification was performed at 95°C (10 s) 60°C (5 s) 72°C (10 s) for 45 cycles. Calculation of relative expression was determined by the Bio‐Rad CFX manager software, and fold change was normalized against the housekeeping gene cyclophilin.
qPCR primers
ampka1 forward TACTCAACCGGCAGAAGATTCG, ampka1 reverse AGACGGCGGCTTTCCTTTT
ldha forward TGTCTCCAGCAAAGACTACTGT, ldha reverse GACTGTACTTGACAATGTTGGGA
pgc1a forward AAGTGGTGTAGCGACCAATCG, pgc1a reverse AATGAGGGCAATCCGTCTTCA
pgc1b forward TGACGTGGACGAGCTTTCAC, pgc1b reverse TGACGTGGACGAGCTTTCAC
pkm1 forward GCATCATGCTGTCTGGAGAA, pkm1 reverse GTTCCTCGAATAAGCTGCAAGT
pkm2 forward TGTCTGGAGAAACAGCCAAG, pkm2 reverse CTCGCACAAGCTCTTCAAAC
cyclophilin forward GTGACTTTACACGCCATAATG,
cyclophilin reverse ACAAGATGCCAGGACCTGTAT
Statistical analyses
All experiments were performed using at least three different cultures or animals in independent experiments. Statistical analyses were performed with Prism software (GraphPad). The Student's t‐test was used for statistical analyses. P < 0.05 was considered significant. Data are means ± SEM.
Author contributions
MT, BC, and RM designed the experiments, analyzed data, and wrote the manuscript. MT, BS, LG, GJ, SBL, MW‐G, LB, CC, GV, MF, PS, ZZ, BV, BC, and RM performed experiments. DD, PS, LY, KS, and AB helped with experimental designs and data analysis. All the authors read and approved the final version of manuscript.
Conflict of interest
C. Collodet and K. Sakamoto are employees of the Nestlé Institute of Health Sciences SA.
Supporting information
Expanded View Figures PDF
Review Process File
Acknowledgements
This work was funded by grants from a European Commission integrated project (LSHM‐CT‐2004‐005272), the Framework Programme FP7 Endostem (under grant agreement 241440), the Association Française contre les Myopathies, Ligue Nationale Contre le Cancer, and the Société Française de Myologie. We thank D.G. Hardie (Dundee University, Scotland, UK) for providing antibodies against AMPKα1, R.A. Depinho (University of Texas, Austin, TX) for providing the LKB1fl/fl mice, Pierre Rocheteau for providing antibody against TOM22 (Institut Pasteur, Paris, France), T. Andrieu and S. Dussurgey from the AniRA‐Cytometry platform (UMS 3444—SFR Gerland Biosciences, Lyon, France) for their expertise in cell sorting, and Frederic Bouillaud for his expertise and help in bioenergetics and metabolism (Institut Cochin, Paris, France).
The EMBO Journal (2017) 36: 1946–1962
References
- Abou‐Khalil R, Le Grand F, Pallafacchina G, Valable S, Authier FJ, Rudnicki MA, Gherardi RK, Germain S, Chretien F, Sotiropoulos A, Lafuste P, Montarras D, Chazaud B (2009) Autocrine and paracrine angiopoietin 1/Tie‐2 signaling promotes muscle satellite cell self‐renewal. Cell Stem Cell 5: 298–309 [DOI] [PMC free article] [PubMed] [Google Scholar]
- Arnold L, Henry A, Poron F, Baba‐Amer Y, van Rooijen N, Plonquet A, Gherardi RK, Chazaud B (2007) Inflammatory monocytes recruited after skeletal muscle injury switch into antiinflammatory macrophages to support myogenesis. J Exp Med 204: 1057–1069 [DOI] [PMC free article] [PubMed] [Google Scholar]
- Augoff K, Hryniewicz‐Jankowska A, Tabola R (2015) Lactate dehydrogenase 5: an old friend and a new hope in the war on cancer. Cancer Lett 358: 1–7 [DOI] [PubMed] [Google Scholar]
- Brack AS (2014) Pax7 is back. Skelet Muscle 4: 24 [DOI] [PMC free article] [PubMed] [Google Scholar]
- Candelario KM, Shuttleworth CW, Cunningham LA (2013) Neural stem/progenitor cells display a low requirement for oxidative metabolism independent of hypoxia inducible factor‐1alpha expression. J Neurochem 125: 420–429 [DOI] [PMC free article] [PubMed] [Google Scholar]
- Cerletti M, Jang YC, Finley LW, Haigis MC, Wagers AJ (2012) Short‐term calorie restriction enhances skeletal muscle stem cell function. Cell Stem Cell 10: 515–519 [DOI] [PMC free article] [PubMed] [Google Scholar]
- Christofk HR, Vander Heiden MG, Harris MH, Ramanathan A, Gerszten RE, Wei R, Fleming MD, Schreiber SL, Cantley LC (2008) The M2 splice isoform of pyruvate kinase is important for cancer metabolism and tumour growth. Nature 452: 230–233 [DOI] [PubMed] [Google Scholar]
- Collins CA, Olsen I, Zammit PS, Heslop L, Petrie A, Partridge TA, Morgan JE (2005) Stem cell function, self‐renewal, and behavioral heterogeneity of cells from the adult muscle satellite cell niche. Cell 122: 289–301 [DOI] [PubMed] [Google Scholar]
- Faubert B, Boily G, Izreig S, Griss T, Samborska B, Dong Z, Dupuy F, Chambers C, Fuerth BJ, Viollet B, Mamer OA, Avizonis D, DeBerardinis RJ, Siegel PM, Jones RG (2013) AMPK is a negative regulator of the Warburg effect and suppresses tumor growth in vivo . Cell Metab 17: 113–124 [DOI] [PMC free article] [PubMed] [Google Scholar]
- Faubert B, Vincent EE, Griss T, Samborska B, Izreig S, Svensson RU, Mamer OA, Avizonis D, Shackelford DB, Shaw RJ, Jones RG (2014) Loss of the tumor suppressor LKB1 promotes metabolic reprogramming of cancer cells via HIF‐1alpha. Proc Natl Acad Sci USA 111: 2554–2559 [DOI] [PMC free article] [PubMed] [Google Scholar]
- Ferretti G, Antonutto G, Denis C, Hoppeler H, Minetti AE, Narici MV, Desplanches D (1997) The interplay of central and peripheral factors in limiting maximal O2 consumption in man after prolonged bed rest. J Physiol 501(Pt 3): 677–686 [DOI] [PMC free article] [PubMed] [Google Scholar]
- Folmes CD, Nelson TJ, Martinez‐Fernandez A, Arrell DK, Lindor JZ, Dzeja PP, Ikeda Y, Perez‐Terzic C, Terzic A (2011) Somatic oxidative bioenergetics transitions into pluripotency‐dependent glycolysis to facilitate nuclear reprogramming. Cell Metab 14: 264–271 [DOI] [PMC free article] [PubMed] [Google Scholar]
- Fu X, Zhu MJ, Dodson MV, Du M (2015) AMP‐activated protein kinase stimulates warburg‐like glycolysis and activation of satellite cells during muscle regeneration. J Biol Chem 290: 26445–26456 [DOI] [PMC free article] [PubMed] [Google Scholar]
- Gan B, Hu J, Jiang S, Liu Y, Sahin E, Zhuang L, Fletcher‐Sananikone E, Colla S, Wang YA, Chin L, Depinho RA (2010) Lkb1 regulates quiescence and metabolic homeostasis of haematopoietic stem cells. Nature 468: 701–704 [DOI] [PMC free article] [PubMed] [Google Scholar]
- Gao Z, Cooper TA (2013) Reexpression of pyruvate kinase M2 in type 1 myofibers correlates with altered glucose metabolism in myotonic dystrophy. Proc Natl Acad Sci USA 110: 13570–13575 [DOI] [PMC free article] [PubMed] [Google Scholar]
- Gohil VM, Sheth SA, Nilsson R, Wojtovich AP, Lee JH, Perocchi F, Chen W, Clish CB, Ayata C, Brookes PS, Mootha VK (2010) Nutrient‐sensitized screening for drugs that shift energy metabolism from mitochondrial respiration to glycolysis. Nat Biotechnol 28: 249–255 [DOI] [PMC free article] [PubMed] [Google Scholar]
- Griffin CA, Kafadar KA, Pavlath GK (2009) MOR23 promotes muscle regeneration and regulates cell adhesion and migration. Dev Cell 17: 649–661 [DOI] [PMC free article] [PubMed] [Google Scholar]
- Gurumurthy S, Xie SZ, Alagesan B, Kim J, Yusuf RZ, Saez B, Tzatsos A, Ozsolak F, Milos P, Ferrari F, Park PJ, Shirihai OS, Scadden DT, Bardeesy N (2010) The Lkb1 metabolic sensor maintains haematopoietic stem cell survival. Nature 468: 659–663 [DOI] [PMC free article] [PubMed] [Google Scholar]
- Hardie DG (2011) AMP‐activated protein kinase: an energy sensor that regulates all aspects of cell function. Genes Dev 25: 1895–1908 [DOI] [PMC free article] [PubMed] [Google Scholar]
- Hardie DG, Ross FA, Hawley SA (2012) AMPK: a nutrient and energy sensor that maintains energy homeostasis. Nat Rev Mol Cell Biol 13: 251–262 [DOI] [PMC free article] [PubMed] [Google Scholar]
- Hunter RW, Treebak JT, Wojtaszewski JF, Sakamoto K (2011) Molecular mechanism by which AMP‐activated protein kinase activation promotes glycogen accumulation in muscle. Diabetes 60: 766–774 [DOI] [PMC free article] [PubMed] [Google Scholar]
- Ito K, Carracedo A, Weiss D, Arai F, Ala U, Avigan DE, Schafer ZT, Evans RM, Suda T, Lee CH, Pandolfi PP (2012) A PML‐PPAR‐delta pathway for fatty acid oxidation regulates hematopoietic stem cell maintenance. Nat Med 18: 1350–1358 [DOI] [PMC free article] [PubMed] [Google Scholar]
- Joe AW, Yi L, Natarajan A, Le Grand F, So L, Wang J, Rudnicki MA, Rossi FM (2010) Muscle injury activates resident fibro/adipogenic progenitors that facilitate myogenesis. Nat Cell Biol 12: 153–163 [DOI] [PMC free article] [PubMed] [Google Scholar]
- Jorgensen SB, Viollet B, Andreelli F, Frosig C, Birk JB, Schjerling P, Vaulont S, Richter EA, Wojtaszewski JF (2004) Knockout of the alpha2 but not alpha1 5′‐AMP‐activated protein kinase isoform abolishes 5‐aminoimidazole‐4‐carboxamide‐1‐beta‐4‐ribofuranosidebut not contraction‐induced glucose uptake in skeletal muscle. J Biol Chem 279: 1070–1079 [DOI] [PubMed] [Google Scholar]
- Kim M, Cooper DD, Hayes SF, Spangrude GJ (1998) Rhodamine‐123 staining in hematopoietic stem cells of young mice indicates mitochondrial activation rather than dye efflux. Blood 91: 4106–4117 [PubMed] [Google Scholar]
- Kim HS, Lee HE, Yang HK, Kim WH (2014) High lactate dehydrogenase 5 expression correlates with high tumoral and stromal vascular endothelial growth factor expression in gastric cancer. Pathobiology 81: 78–85 [DOI] [PubMed] [Google Scholar]
- Kitamoto T, Hanaoka K (2010) Notch3 null mutation in mice causes muscle hyperplasia by repetitive muscle regeneration. Stem Cells 28: 2205–2216 [DOI] [PubMed] [Google Scholar]
- Knobloch M, Braun SM, Zurkirchen L, von Schoultz C, Zamboni N, Arauzo‐Bravo MJ, Kovacs WJ, Karalay O, Suter U, Machado RA, Roccio M, Lutolf MP, Semenkovich CF, Jessberger S (2013) Metabolic control of adult neural stem cell activity by Fasn‐dependent lipogenesis. Nature 493: 226–230 [DOI] [PMC free article] [PubMed] [Google Scholar]
- Kuang S, Kuroda K, Le Grand F, Rudnicki MA (2007) Asymmetric self‐renewal and commitment of satellite stem cells in muscle. Cell 129: 999–1010 [DOI] [PMC free article] [PubMed] [Google Scholar]
- Lantier L, Mounier R, Leclerc J, Pende M, Foretz M, Viollet B (2010) Coordinated maintenance of muscle cell size control by AMP‐activated protein kinase. FASEB J 24: 3555–3561 [DOI] [PubMed] [Google Scholar]
- Laporte D, Lebaudy A, Sahin A, Pinson B, Ceschin J, Daignan‐Fornier B, Sagot I (2011) Metabolic status rather than cell cycle signals control quiescence entry and exit. J Cell Biol 192: 949–957 [DOI] [PMC free article] [PubMed] [Google Scholar]
- Latil M, Rocheteau P, Chatre L, Sanulli S, Memet S, Ricchetti M, Tajbakhsh S, Chretien F (2012) Skeletal muscle stem cells adopt a dormant cell state post mortem and retain regenerative capacity. Nat Commun 3: 903 [DOI] [PubMed] [Google Scholar]
- Le Grand F, Grifone R, Mourikis P, Houbron C, Gigaud C, Pujol J, Maillet M, Pages G, Rudnicki M, Tajbakhsh S, Maire P (2012) Six1 regulates stem cell repair potential and self‐renewal during skeletal muscle regeneration. J Cell Biol 198: 815–832 [DOI] [PMC free article] [PubMed] [Google Scholar]
- Leblanc OH Jr (1971) The effect of uncouplers of oxidative phosphorylation on lipid bilayer membranes: carbonylcyanidem‐chlorophenylhydrazone. J Membr Biol 4: 227–251 [DOI] [PubMed] [Google Scholar]
- Lepper C, Conway SJ, Fan CM (2009) Adult satellite cells and embryonic muscle progenitors have distinct genetic requirements. Nature 460: 627–631 [DOI] [PMC free article] [PubMed] [Google Scholar]
- Liu F, Mackey AL, Srikuea R, Esser KA, Yang L (2013) Automated image segmentation of haematoxylin and eosin stained skeletal muscle cross‐sections. J Microsc 252: 275–285 [DOI] [PMC free article] [PubMed] [Google Scholar]
- de Meester C, Timmermans AD, Balteau M, Ginion A, Roelants V, Noppe G, Porporato PE, Sonveaux P, Viollet B, Sakamoto K, Feron O, Horman S, Vanoverschelde JL, Beauloye C, Bertrand L (2014) Role of AMP‐activated protein kinase in regulating hypoxic survival and proliferation of mesenchymal stem cells. Cardiovasc Res 101: 20–29 [DOI] [PubMed] [Google Scholar]
- Miniou P, Tiziano D, Frugier T, Roblot N, Le Meur M, Melki J (1999) Gene targeting restricted to mouse striated muscle lineage. Nucleic Acids Res 27: e27 [DOI] [PMC free article] [PubMed] [Google Scholar]
- Miskimins WK, Ahn HJ, Kim JY, Ryu S, Jung YS, Choi JY (2014) Synergistic anti‐cancer effect of phenformin and oxamate. PLoS One 9: e85576 [DOI] [PMC free article] [PubMed] [Google Scholar]
- Mohyeldin A, Garzon‐Muvdi T, Quinones‐Hinojosa A (2010) Oxygen in stem cell biology: a critical component of the stem cell niche. Cell Stem Cell 7: 150–161 [DOI] [PubMed] [Google Scholar]
- Morrison SJ, Spradling AC (2008) Stem cells and niches: mechanisms that promote stem cell maintenance throughout life. Cell 132: 598–611 [DOI] [PMC free article] [PubMed] [Google Scholar]
- Mounier R, Lantier L, Leclerc J, Sotiropoulos A, Pende M, Daegelen D, Sakamoto K, Foretz M, Viollet B (2009) Important role for AMPKalpha1 in limiting skeletal muscle cell hypertrophy. FASEB J 23: 2264–2273 [DOI] [PubMed] [Google Scholar]
- Mounier R, Lantier L, Leclerc J, Sotiropoulos A, Foretz M, Viollet B (2011) Antagonistic control of muscle cell size by AMPK and mTORC1. Cell Cycle 10: 2640–2646 [DOI] [PubMed] [Google Scholar]
- Mounier R, Theret M, Arnold L, Cuvellier S, Bultot L, Goransson O, Sanz N, Ferry A, Sakamoto K, Foretz M, Viollet B, Chazaud B (2013) AMPKalpha1 regulates macrophage skewing at the time of resolution of inflammation during skeletal muscle regeneration. Cell Metab 18: 251–264 [DOI] [PubMed] [Google Scholar]
- Mounier R, Theret M, Lantier L, Foretz M, Viollet B (2015) Expanding roles for AMPK in skeletal muscle plasticity. Trends Endocrinol Metab 26: 275–286 [DOI] [PubMed] [Google Scholar]
- Mourikis P, Sambasivan R, Castel D, Rocheteau P, Bizzarro V, Tajbakhsh S (2012) A critical requirement for notch signaling in maintenance of the quiescent skeletal muscle stem cell state. Stem Cells 30: 243–252 [DOI] [PubMed] [Google Scholar]
- Murphy MM, Lawson JA, Mathew SJ, Hutcheson DA, Kardon G (2011) Satellite cells, connective tissue fibroblasts and their interactions are crucial for muscle regeneration. Development 138: 3625–3637 [DOI] [PMC free article] [PubMed] [Google Scholar]
- Nakada D, Saunders TL, Morrison SJ (2010) Lkb1 regulates cell cycle and energy metabolism in haematopoietic stem cells. Nature 468: 653–658 [DOI] [PMC free article] [PubMed] [Google Scholar]
- Nishikawa A, Tanaka T, Takeuchi T, Fujihiro S, Mori H (1991) The diagnostic significance of lactate dehydrogenase isoenzymes in urinary cytology. Br J Cancer 63: 819–821 [DOI] [PMC free article] [PubMed] [Google Scholar]
- Oburoglu L, Tardito S, Fritz V, de Barros SC, Merida P, Craveiro M, Mamede J, Cretenet G, Mongellaz C, An X, Klysz D, Touhami J, Boyer‐Clavel M, Battini JL, Dardalhon V, Zimmermann VS, Mohandas N, Gottlieb E, Sitbon M, Kinet S et al (2014) Glucose and glutamine metabolism regulate human hematopoietic stem cell lineage specification. Cell Stem Cell 15: 169–184 [DOI] [PubMed] [Google Scholar]
- Ono Y, Masuda S, Nam HS, Benezra R, Miyagoe‐Suzuki Y, Takeda S (2012) Slow‐dividing satellite cells retain long‐term self‐renewal ability in adult muscle. J Cell Sci 125: 1309–1317 [DOI] [PubMed] [Google Scholar]
- Orford KW, Scadden DT (2008) Deconstructing stem cell self‐renewal: genetic insights into cell‐cycle regulation. Nat Rev Genet 9: 115–128 [DOI] [PubMed] [Google Scholar]
- Parisi A, Lacour F, Giordani L, Colnot S, Maire P, Le Grand F (2015) APC is required for muscle stem cell proliferation and skeletal muscle tissue repair. J Cell Biol 210: 717–726 [DOI] [PMC free article] [PubMed] [Google Scholar]
- Qi X, Xing F, Foran DJ, Yang L (2012) A fast, automatic segmentation algorithm for locating and delineating touching cell boundaries in imaged histopathology. Methods Inf Med 51: 260–267 [DOI] [PMC free article] [PubMed] [Google Scholar]
- Rafalski VA, Mancini E, Brunet A (2012) Energy metabolism and energy‐sensing pathways in mammalian embryonic and adult stem cell fate. J Cell Sci 125: 5597–5608 [DOI] [PMC free article] [PubMed] [Google Scholar]
- Ramanathan A, Wang C, Schreiber SL (2005) Perturbational profiling of a cell‐line model of tumorigenesis by using metabolic measurements. Proc Natl Acad Sci USA 102: 5992–5997 [DOI] [PMC free article] [PubMed] [Google Scholar]
- Rocheteau P, Gayraud‐Morel B, Siegl‐Cachedenier I, Blasco MA, Tajbakhsh S (2012) A subpopulation of adult skeletal muscle stem cells retains all template DNA strands after cell division. Cell 148: 112–125 [DOI] [PubMed] [Google Scholar]
- Rodgers JT, King KY, Brett JO, Cromie MJ, Charville GW, Maguire KK, Brunson C, Mastey N, Liu L, Tsai CR, Goodell MA, Rando TA (2014) mTORC1 controls the adaptive transition of quiescent stem cells from G0 to G(Alert). Nature 510: 393–396 [DOI] [PMC free article] [PubMed] [Google Scholar]
- Ryall JG, Dell'Orso S, Derfoul A, Juan A, Zare H, Feng X, Clermont D, Koulnis M, Gutierrez‐Cruz G, Fulco M, Sartorelli V (2015) The NAD(+)‐dependent SIRT1 deacetylase translates a metabolic switch into regulatory epigenetics in skeletal muscle stem cells. Cell Stem Cell 16: 171–183 [DOI] [PMC free article] [PubMed] [Google Scholar]
- Sakamoto K, Zarrinpashneh E, Budas GR, Pouleur AC, Dutta A, Prescott AR, Vanoverschelde JL, Ashworth A, Jovanovic A, Alessi DR, Bertrand L (2006) Deficiency of LKB1 in heart prevents ischemia‐mediated activation of AMPKalpha2 but not AMPKalpha1. Am J Physiol 290: E780–E788 [DOI] [PMC free article] [PubMed] [Google Scholar]
- Schaffer BE, Levin RS, Hertz NT, Maures TJ, Schoof ML, Hollstein PE, Benayoun BA, Banko MR, Shaw RJ, Shokat KM, Brunet A (2015) Identification of AMPK phosphorylation sites reveals a network of proteins involved in cell invasion and facilitates large‐scale substrate prediction. Cell Metab 22: 907–921 [DOI] [PMC free article] [PubMed] [Google Scholar]
- Seale P, Sabourin LA, Girgis‐Gabardo A, Mansouri A, Gruss P, Rudnicki MA (2000) Pax7 is required for the specification of myogenic satellite cells. Cell 102: 777–786 [DOI] [PubMed] [Google Scholar]
- Shan T, Zhang P, Liang X, Bi P, Yue F, Kuang S (2014) Lkb1 is indispensable for skeletal muscle development, regeneration, and satellite cell homeostasis. Stem Cells 32: 2893–2907 [DOI] [PMC free article] [PubMed] [Google Scholar]
- Shea KL, Xiang W, LaPorta VS, Licht JD, Keller C, Basson MA, Brack AS (2010) Sprouty1 regulates reversible quiescence of a self‐renewing adult muscle stem cell pool during regeneration. Cell Stem Cell 6: 117–129 [DOI] [PMC free article] [PubMed] [Google Scholar]
- Simon MC, Keith B (2008) The role of oxygen availability in embryonic development and stem cell function. Nat Rev Mol Cell Biol 9: 285–296 [DOI] [PMC free article] [PubMed] [Google Scholar]
- Simsek T, Kocabas F, Zheng J, Deberardinis RJ, Mahmoud AI, Olson EN, Schneider JW, Zhang CC, Sadek HA (2010) The distinct metabolic profile of hematopoietic stem cells reflects their location in a hypoxic niche. Cell Stem Cell 7: 380–390 [DOI] [PMC free article] [PubMed] [Google Scholar]
- Spencer JA, Ferraro F, Roussakis E, Klein A, Wu J, Runnels JM, Zaher W, Mortensen LJ, Alt C, Turcotte R, Yusuf R, Cote D, Vinogradov SA, Scadden DT, Lin CP (2014) Direct measurement of local oxygen concentration in the bone marrow of live animals. Nature 508: 269–273 [DOI] [PMC free article] [PubMed] [Google Scholar]
- Srere PA, Brooks GC (1969) The circular dichroism of glucagon solutions. Arch Biochem Biophys 129: 708–710 [DOI] [PubMed] [Google Scholar]
- Starck J, Weiss‐Gayet M, Gonnet C, Guyot B, Vicat JM, Morle F (2010) Inducible Fli‐1 gene deletion in adult mice modifies several myeloid lineage commitment decisions and accelerates proliferation arrest and terminal erythrocytic differentiation. Blood 116: 4795–4805 [DOI] [PubMed] [Google Scholar]
- Takubo K, Nagamatsu G, Kobayashi CI, Nakamura‐Ishizu A, Kobayashi H, Ikeda E, Goda N, Rahimi Y, Johnson RS, Soga T, Hirao A, Suematsu M, Suda T (2013) Regulation of glycolysis by Pdk functions as a metabolic checkpoint for cell cycle quiescence in hematopoietic stem cells. Cell Stem Cell 12: 49–61 [DOI] [PMC free article] [PubMed] [Google Scholar]
- Tang AH, Rando TA (2014) Induction of autophagy supports the bioenergetic demands of quiescent muscle stem cell activation. EMBO J 33: 2782–2797 [DOI] [PMC free article] [PubMed] [Google Scholar]
- Tiainen M, Ylikorkala A, Makela TP (1999) Growth suppression by Lkb1 is mediated by a G(1) cell cycle arrest. Proc Natl Acad Sci USA 96: 9248–9251 [DOI] [PMC free article] [PubMed] [Google Scholar]
- Vial G, Dubouchaud H, Couturier K, Cottet‐Rousselle C, Taleux N, Athias A, Galinier A, Casteilla L, Leverve XM (2011) Effects of a high‐fat diet on energy metabolism and ROS production in rat liver. J Hepatol 54: 348–356 [DOI] [PubMed] [Google Scholar]
- Viollet B, Andreelli F, Jorgensen SB, Perrin C, Geloen A, Flamez D, Mu J, Lenzner C, Baud O, Bennoun M, Gomas E, Nicolas G, Wojtaszewski JF, Kahn A, Carling D, Schuit FC, Birnbaum MJ, Richter EA, Burcelin R, Vaulont S (2003) The AMP‐activated protein kinase alpha2 catalytic subunit controls whole‐body insulin sensitivity. J Clin Invest 111: 91–98 [DOI] [PMC free article] [PubMed] [Google Scholar]
- Visvader JE, Lindeman GJ (2012) Cancer stem cells: current status and evolving complexities. Cell Stem Cell 10: 717–728 [DOI] [PubMed] [Google Scholar]
- Voog J, Jones DL (2010) Stem cells and the niche: a dynamic duo. Cell Stem Cell 6: 103–115 [DOI] [PMC free article] [PubMed] [Google Scholar]
- Wilkinson JH, Walter SJ (1972) Oxamate as a differential inhibitor of lactate dehydrogenase isoenzymes. Enzyme 13: 170–176 [DOI] [PubMed] [Google Scholar]
- Yin H, Price F, Rudnicki MA (2013) Satellite cells and the muscle stem cell niche. Physiol Rev 93: 23–67 [DOI] [PMC free article] [PubMed] [Google Scholar]
- Zammit PS, Golding JP, Nagata Y, Hudon V, Partridge TA, Beauchamp JR (2004) Muscle satellite cells adopt divergent fates: a mechanism for self‐renewal? J Cell Biol 166: 347–357 [DOI] [PMC free article] [PubMed] [Google Scholar]
Associated Data
This section collects any data citations, data availability statements, or supplementary materials included in this article.
Supplementary Materials
Expanded View Figures PDF
Review Process File