Abstract
A pathologic osteochondrogenic differentiation of vascular smooth muscle cells (VSMCs) promotes arterial calcifications, a process associated with significant morbidity and mortality. The molecular pathways promoting this pathology are not completely understood. We studied VSMCs, mouse aortic rings, and human aortic valves and showed here that histone deacetylase 4 (HDAC4) is upregulated early in the calcification process. Gain‐ and loss‐of‐function assays demonstrate that HDAC4 is a positive regulator driving this pathology. HDAC4 can shuttle between the nucleus and cytoplasm, but in VSMCs, the cytoplasmic rather than the nuclear activity of HDAC4 promotes calcification, and a nuclear‐localized mutant of HDAC4 fails to promote calcification. The cytoplasmic location and function of HDAC4 is controlled by the activity of salt‐inducible kinase (SIK). Pharmacologic inhibition of SIK sends HDAC4 to the nucleus and inhibits the calcification process in VSMCs, aortic rings, and in vivo. In the cytoplasm, HDAC4 binds and its activity depends on the adaptor protein ENIGMA (Pdlim7) to promote vascular calcification. These results establish a cytoplasmic role for HDAC4 and identify HDAC4, SIK, and ENIGMA as mediators of vascular calcification.
Keywords: histone deacetylase, smooth muscle cell, vascular calcification
Subject Categories: Chromatin, Epigenetics, Genomics & Functional Genomics; Molecular Biology of Disease; Post-translational Modifications, Proteolysis & Proteomics
Introduction
Vascular and valve calcification is a pathologic deposition of hydroxyapatite in the extracellular matrix of arterial walls or valve leaflets 1. These calcifications can occur in both the intima and the media layers of the arteries, are characteristic of aging, and are often related to different arterial diseases. Atherosclerosis is associated with intimal or neointimal calcification and an inflammatory milieu, while diabetic vasculopathy and metabolic factors such as hyperphosphatemia are often associated with medial calcification and are usually not accompanied by inflammation 1. Similar calcification can also occur in aortic valve leaflets 2. The calcifications reduce the compliance and impair hemodynamics, and a meta‐analysis showed that the presence of calcifications in any arterial wall is associated with a threefold to fourfold higher risk of mortality and cardiovascular events 3. Currently, there is no specific treatment for vascular or valve calcification.
Vascular calcification is an active process driven by cells in the artery wall or valve. A lineage tracing study identified vascular smooth muscle cells (VSMCs) as the predominant drivers in medial arterial calcification 4. These cells upregulate the expression of several osteochondrogenic markers including Runx2, Sox9, Osterix, Osteopontin, Osteocalcin, and alkaline phosphatase and differentiate or “transdifferentiate” to osteoblast–chondroblast‐like cells 5, 6. Functionally, these osteoblast–chondroblast‐like cells generate nucleating structures in the matrix for calcium hydroxyapatite deposition. Vascular calcification bear resemblance to bone formation, but there are some notable differences. For example, calcium phosphate in the arteries is not predominantly deposited on type I collagen as in bone, but rather on the amorphous elastin that comprises the elastic lamellae 7. Interestingly, vascular calcification is more pronounced in patients with bone loss 8, but it is not clear to what degree these two processes truly oppose or just coincide with each other. The molecular signals leading to the initiation and maintenance of vascular calcification have not been completely elucidated.
Histone deacetylases (HDACs) are 18 proteins, grouped into four classes based on their structure and primary homology to Saccharomyces cerevisiae HDACs. Among them, HDAC4, 5, 7, and 9 are classified as class IIa HDACs as they all have a long N‐terminal domain in addition to their C‐terminal deacetylase domain 9. This N‐terminal domain was shown to contain interacting binding sites to a diverse group of proteins such as the myocyte enhancer factor 2 (MEF2) transcription factors, calmodulin‐binding transcription activator, chaperone protein 14‐3‐3, and alpha‐actinin 10, 11. The N‐terminal domain also contains three conserved serine residues that can undergo phosphorylation by several kinases including calcium/calmodulin‐dependent kinase II (CamK II) 12, protein kinase D (PKD) 13, and salt‐inducible kinase 1,2 and 3 (SIK1, SIK2, and SIK3) 14, 15. The phosphorylation of class IIa HDACs at these serine residues is a crucial event that determines their nuclear export and cytoplasmic retention through binding to cytoplasmic 14‐3‐3 proteins 16. The currently accepted paradigm for class IIa HDAC regulation explains function in the nucleus through binding to transcription factors and a phosphorylation dependent nuclear export with cytoplasmic retention as a signal‐induced inhibitory mechanism 16. Despite having a large catalytic domain, class IIa HDACs exhibit minimal deacetylase activity 11. It has been proposed that class IIa HDACs may not be real enzymes and that they act as adaptors of protein complexes or “readers”.
Class IIa HDACs appear to be expressed in a tissue‐specific manner and have been shown to exert their activity in skeletal, cardiac and smooth muscle, brain, cartilage, and bone. Among the class IIa HDACs, HDAC4 was shown to have important function in bone and cartilage development. Global deletion of HDAC4 in mice results in precocious and ectopic hypertrophy of chondrocytes 17. Deletion of HDAC4 in osteoblasts, achieved by crossing Hdac4 fl/fl mice with Runx2‐Cre transgenic mice, resulted in low bone mass, suggesting that HDAC4 may be a positive regulator of bone formation 18.
Here, we show that the class IIa HDAC4 is upregulated during vascular and valve calcification and is a positive regulator, promoting the process. While the current paradigm suggests that class IIa HDACs are shuttled to the cytoplasm to inhibit their nuclear function, we show that cytoplasmic HDAC4 promotes vascular calcification through binding to the cytoplasmic protein ENIGMA (Pdlim7). The cytoplasmic retention of HDAC4 in VSMCs is mediated by SIK kinase, and inhibition of SIK promotes nuclear accumulation of HDAC4 and blunts the calcification process. These observations suggest a new role and a new mechanistic paradigm for HDAC4.
Results
HDAC4 is upregulated during vascular calcification
Hyperphosphatemia promotes vascular calcification, and mouse aortic VSMCs were shown to reproducibly calcify in the presence of high phosphate culture medium (HPM) 19. Under these conditions, cultured VSMCs undergo a profound phenotypic transition with an upregulation of osteochondrogenic markers and calcification of the extracellular matrix, similar to those observed in pathological vascular calcification in vivo 20. To assess the involvement of HDACs, we treated VSMCs with HPM and assessed calcification. As expected, we observed a significant elevation in osteochondrogenic genes: alkaline phosphatase (Alkp), Osteocalcin (Bglap), Sox9, and Osteopontin (Spp1) after 1 week by qRT–PCR (Fig 1A). We observed only a nonsignificant trend for upregulation of the transcription factor Runx2 by 1.27‐fold. Matrix mineralization was evident by a significantly increased matrix calcium by o‐cresolphthalein colorimetric assay (Fig 1B). We examined the expression of different HDACs upon induction of VSMCs calcification and observed unchanged expression of HDACs 1, 2, and 7, a small but significant upregulation of the class I HDAC3 (1.16‐fold), an upregulation of the class I HDAC8, the class IIb HDAC6, and a twofold upregulation of the class IIa HDAC4 levels (Fig 1C). The expression of the class IIa HDAC5 and HDAC9 was also significantly upregulated upon induction, but their absolute level was low (Fig EV1A and B). We also analyzed HDAC4 protein level and noted a similar significant twofold increase in its level (Fig 1D). To further validate our culture findings, we developed an ex vivo aortic calcification model based on the mouse aortic ring angiogenesis assays 21. In this model, adult mice aortas are dissected, cleaned, and cut into rings, embedded in collagen, and grown for 2 weeks in osteo‐inductive high phosphate or control culture media. This aortic ring assay may be more physiologically relevant since the arterial wall remains intact and the different adult cells in the arterial wall and their anatomical relations are preserved. The high phosphate medium stimulated the rings to activate osteogenic pathways and elevate the expression of osteochondrogenic genes like Runx2 and Osteopontin (Spp1; Fig 1E). Osteopontin is not found in normal arteries, but is upregulated at sites of calcification in human atherosclerotic plaques and in calcified aortic valves 20. Importantly, the expression of HDAC4 was also significantly upregulated in this model by 1.6‐fold (Fig 1E). Matrix mineralization in the rings was evident by Von Kossa stain (Fig 1F). Next, human aortic valves were collected during valve replacement surgery. Expression analysis using qRT–PCR revealed significant upregulation of the valve calcification markers RUNX2 and Osteopontin (SPP1) as well as in HDAC4 by 7.16‐fold in severely calcified valves, compared to controls (Fig 1G).
Figure 1. Histone deacetylase 4 (HDAC4) is upregulated during vascular and valve calcification.
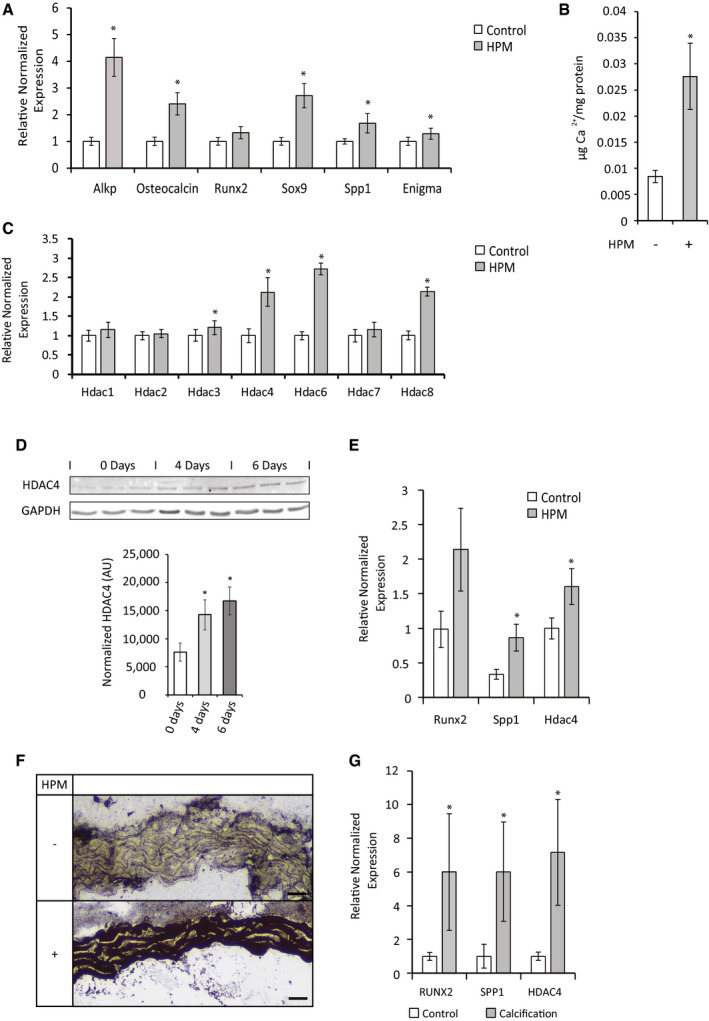
- qRT–PCR gene expression analysis of osteochondrogenic markers in VSMCs following 7‐day treatment with high phosphate media (HPM) (gray) or control media (white). Data are shown as means ± SEM (n = 6), normalized to control. Two‐tailed unpaired Student's t‐test, *P < 0.05.
- O‐cresolphthalein calcium colorimetric assay, normalized to protein concentration, of VSMCs after 2 weeks in HPM (gray) or control media (white). Data are shown as means ± SEM (n = 9). Two‐tailed unpaired Student's t‐test, *P < 0.05.
- qRT–PCR gene expression analysis of HDACs in VSMCs following 7‐day treatment with high phosphate media (HPM) (gray) or control media (white). Data are shown as means ± SEM (n = 6), normalized to control. Two‐tailed unpaired Student's t‐test, *P < 0.05.
- Western blot analysis and quantification of HDAC4 protein levels in VSMCs after 4 or 6 days of HPM treatment. HDAC4 levels were normalized to GAPDH levels in arbitrary density units (AU). Data are shown as means ± SEM (n = 3). Two‐tailed unpaired Student's t‐test, *P < 0.05.
- qRT–PCR gene expression analysis of osteochondrogenic markers and HDAC4 in the mouse aortic rings assay treated for 14 days with (gray) or without (white) HPM. Data are shown as means ± SEM (n = 4), relative to zero. Two‐tailed unpaired Student's t‐test, *P < 0.05.
- Representative images of histological sections of aortic rings grown for 14 days in control medium or HPM, stained black for calcium using Von Kossa stain. Scale bar = 10 μm.
- qRT–PCR gene expression analysis of osteochondrogenic markers and HDAC4 in calcified human aortic valves compared to controls. Data are shown as means ± SEM (n = 3), normalized to control. Two‐tailed unpaired Student's t‐test, *P < 0.05.
Source data are available online for this figure.
Figure EV1. HDACs expression levels in VSMCs.

- Gene expression qRT–PCR analysis of HDAC5 and HDAC9 in VSMCs following treatment with high phosphate media (HPM) (gray) or control media (white). Data are shown as means ± SEM (n = 6), normalized to control, with two‐tailed unpaired Student's t‐test, *P < 0.05.
- Expression levels of HDACs 1–9 in VSMCs grown in control media analyzed using qRT–PCR. Data are shown as means ± SEM (n = 6), relative to zero.
HDAC4 is a positive regulator of vascular calcification
The two models and the in vivo data from patients showed that HDAC4 was significantly upregulated in vascular and valve calcification. To assess the significance of this upregulation, we overexpressed HDAC4, without adding high phosphate media. The overexpression of human HDAC4 in cultured VSMCs resulted in the upregulation of osteochondrogenic marker genes and a significant increase in matrix calcium by o‐cresolphthalein colorimetric assay (Figs 2A and B, and EV2A). Similarly, the overexpression of HDAC4 in aortic rings without the addition of high phosphate media resulted in upregulation of osteochondrogenic marker genes and a significant increase in matrix calcium (Figs 2C and D, and EV2B). These data show that the upregulation of HDAC4 is sufficient to induce the expression of osteochondrogenic genes and drive matrix calcification. Overexpression of HDAC4 in HPM treated aortic rings did not result in additional markers upregulation (Fig EV2C). Conversely, the knockdown of HDAC4 using two different siRNAs by 75 and 74% resulted in downregulation of the calcification marker Osteocalcin (0.21‐ and 0.3‐fold, respectively; Figs 2E and EV2D). Importantly, the knockdown of HDAC4 significantly blunted the accumulation of matrix calcification induce by HPM (Fig 2F). Interestingly, Runx2 showed only a trend for reduction with knockdown of HDAC4 (Fig 2E). Together, these data identify HDAC4 as a positive regulator of the vascular calcification process.
Figure 2. Effects of overexpression and knockdown of HDAC4 on calcification.
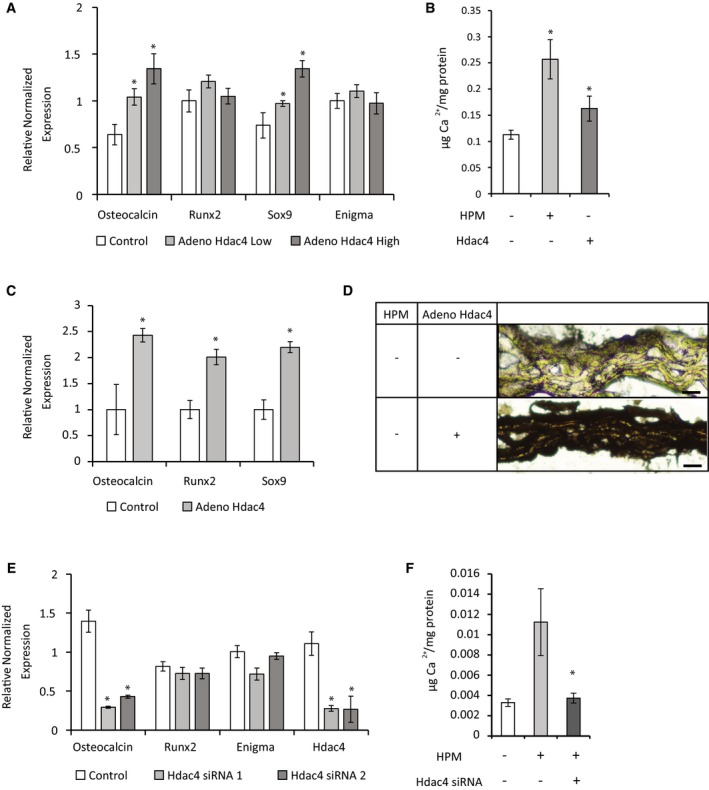
- VSMCs were transduced with two different concentrations of adenoviral vector encoding for Flag‐tagged HDAC4 or control beta‐gal virus. Gene expression qRT–PCR analysis of calcification markers was performed. Data are shown as means ± SEM (n = 6), relative to zero. Two‐tailed unpaired Student's t‐test, *P < 0.05 vs. control.
- O‐cresolphthalein calcium colorimetric assay of VSMCs after 2 weeks of control media (white) or HPM (light gray), or VSMCs transfected with HDAC4 in control media (dark gray). Data are shown as means ± SEM (n = 6), normalized to protein concentration. Two‐tailed unpaired Student's t‐test, *P < 0.05 vs. control.
- Aortic rings were transduced with adenoviral vector encoding for Flag‐tagged HDAC4 or control beta‐gal and were grown for 14 days in control media. Osteochondrogenic markers were analyzed using qRT–PCR gene expression. Data are shown as means ± SEM (n = 6), normalized to control. Two‐tailed unpaired Student's t‐test, *P < 0.05.
- Histological sections of control beta‐gal or HDAC4 transduced aortic rings in control medium after 14 days, stained black for calcium with Von Kossa stain. Representative images are shown. Scale bar = 20 μm.
- VSMCs were transfected with two different siRNAs for HDAC4 or with control siRNA. Gene expression qRT–PCR analysis shows similar level of knockdown of HDAC4 for the two siRNAs and inhibition of the osteochondrogenic marker Osteocalcin. Data are shown as means ± SEM (n = 5), relative to zero. Two‐tailed unpaired Student's t‐test, *P < 0.05 vs. control.
- O‐cresolphthalein calcium colorimetric assay of VSMCs transfected with scrambled siRNA after 2 weeks treatment with control media (white) or HPM (light gray), or VSMCs transfected with HDAC4 siRNA in HPM (dark gray). Data are shown as means ± SEM (n = 8), normalized to protein concentration. Two‐tailed unpaired Student's t‐test, *P < 0.05 vs. control siRNA.
Figure EV2. Degree of HDAC4 knockdown and overexpression.
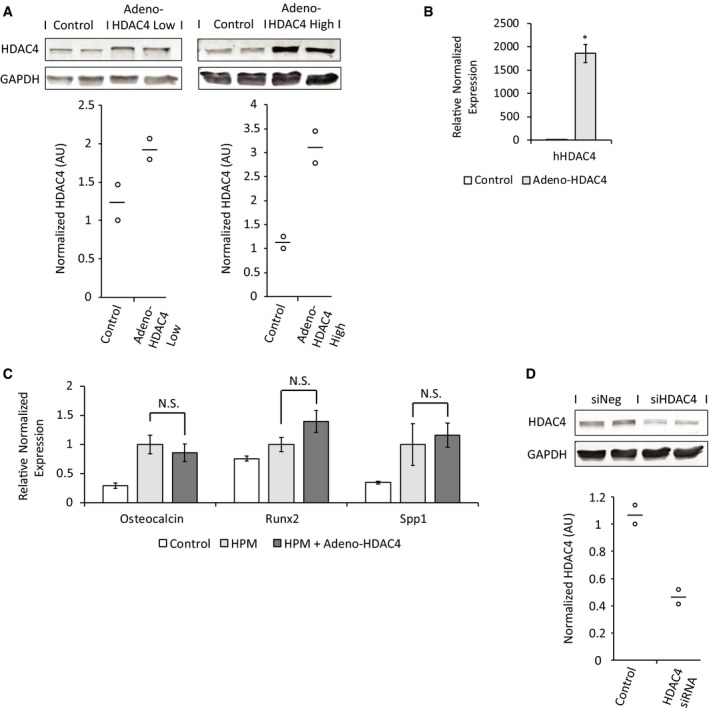
- Western blot analysis and quantification showing the degree of HDAC4 protein overexpression after viral transduction in VSMCs. Data are shown as single data points and mean (n = 2).
- qRT–PCR with human‐specific HDAC4 primers in aortic rings showing effective viral transduction of Ad‐HDAC4. This analysis, however, cannot be used to quantify the degree (fold‐ratio) of HDAC4 overexpression over endogenous mouse HDAC4, since the level of human HDAC4 in control rings is zero. Data are shown as means ± SEM (n = 6), normalized to control. Two‐tailed unpaired Student's t‐test, *P < 0.05.
- Aortic rings were transduced with adenoviral vector encoding for Flag‐tagged HDAC4 or control beta‐gal and were grown in HPM or control media. Gene expression qRT–PCR analysis for osteochondrogenic markers was performed. Data are shown as means ± SEM (n = 4), relative to zero. Two‐tailed unpaired Student's t‐test. N.S., P > 0.05.
- Western blot analysis and quantification showing the degree of HDAC4 protein knockdown in VSMCs in response to HDAC4 siRNA transfection. Data are shown as single data points and mean (n = 2).
Source data are available online for this figure.
Cytoplasmic localization of HDAC4 in VSMCs
Class IIa HDACs are considered nuclear proteins that are exported out of the nucleus in response to stimulus dependent kinase activation 16. However, in certain cell types, in the absence of external signals, the class IIa HDAC4 can be found in both the nucleus and the cytoplasm 11. To track the location of HDAC4 in VSMCs, we used green fluorescent protein (GFP)‐tagged constructs of HDAC4 (Fig EV3A). Wild‐type HDAC4 was almost exclusively cytoplasmic in VSMCs and remained almost exclusively cytoplasmic even under treatment with HPM (Fig 3A). The nuclear export signal (NES) in the C‐terminal tail of HDAC4 allows its nuclear export, and the phosphorylation of three serine residues in the N‐terminal tail is known to mediate cytoplasmic retention through binding to 14‐3‐3 proteins. To further explore the nucleo‐cytoplasmic shuttling of HDAC4, we used three different constructs: a truncated N‐terminal construct containing only the first 625 amino acids of HDAC4 that includes the nuclear localization signal (NLS) but not the NES (HDAC4 3‐625), a mutant in which the three serine residues (Ser246, Ser467, and Ser632) in the N‐terminal tail were mutated to alanine (3SA), or the wild‐type HDAC4. We performed a detailed quantitative analysis of localization in VSMCs and control HeLa epithelial cells using these constructs (Figs 3B and EV3B). To avoid any bias, the analysis was performed automatically using CellProfiler analysis software 22. This quantitative analysis showed that the wild‐type HDAC4 was indeed almost exclusively cytoplasmic in VSMCs (92.3% of cells exclusively cytoplasmic and 7.7% of cells both nuclear and cytoplasmic distribution), but not in control HeLa epithelial cells in which wild‐type HDAC4 was exclusively cytoplasmic only in 23.7% of cells (Figs 3B and EV3B), indicating that shuttling of the GFP‐tagged constructs is intact and that the localization of HDAC4 in VSMCs is inherently different from epithelial cells. Both the truncated N‐terminal 3‐625 mutant and the 3SA mutants were predominantly nuclear in both VSMCs and Hela cells (Figs 3B and EV3B). These data suggest that nucleo‐cytoplasmic shuttling and cytoplasmic retention of HDAC4 is intact in VSMCs and requires the NES and the phosphorylation of the N‐terminal serine residues, respectively. The ability of HDAC4 to modify the calcification process despite its exclusive cytoplasmic localization, both before and after osteochondral differentiation, strongly suggests that HDAC4 functions in the cytoplasm to promote VSMCs calcification. To further test this point, we examined the ability of the nuclear 3SA mutant of HDAC4 to drive calcification. In contrast with the wild‐type HDAC4 which is exclusively cytoplasmic in 92.3% of the cells, the 3SA mutant is predominantly nuclear and can be found in an exclusive cytoplasmic location only in 17% of the VSMCs (Fig 3B). We further confirmed the cytoplasmic localization of wild‐type HDAC4 and the nuclear localization of 3SA HDAC4 using biochemical fractionation (Fig EV3C). When overexpressed in VSMCs, the wild‐type cytoplasmic HDAC4 drove the upregulation of osteochondrogenic genes and matrix calcification, while the overexpression of the 3SA nuclear mutant failed to induce calcification (Fig 3C and D). Taken together, these data show that cytoplasmic but not nuclear HDAC4 drives the calcification process.
Figure EV3. HDAC4 constructs and localization in HeLa cells.
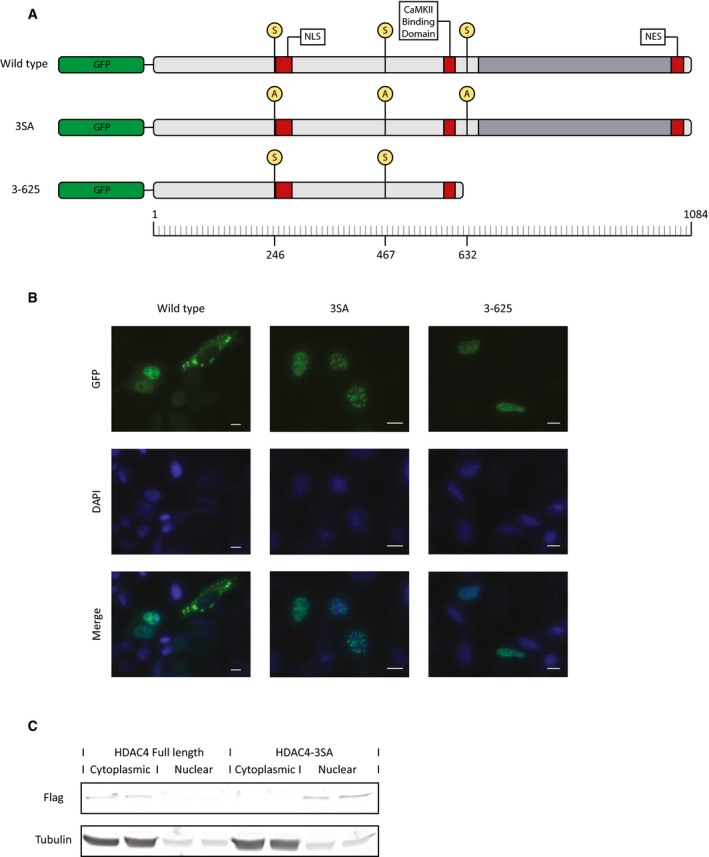
- GFP‐tagged constructs of HDAC4: Wild‐type, full‐length HDAC4 protein; 3SA, full‐length HDAC4 protein, in which three amino acids (Ser246, Ser467, and Ser632) were mutated to alanine; 3–625, the N‐terminal fragment of HDAC4‐containing amino acids 3‐625 of the protein that includes the NLS but not the NES.
- HeLa cells were transfected with the different HDAC4 constructs to examine their intracellular localization. Cells were fixed with formaldehyde, and nuclei were counterstained with DAPI. High magnification representative images are shown. Scale bar = 10 μm.
- VSMCs were transduced with adenoviral vector encoding for Flag‐tagged HDAC4 or Flag‐tagged 3SA HDAC4. Cytoplasmic and nuclear protein extracts were obtained and Western blot was performed using anti‐Flag antibody. Anti‐tubulin immunoblot was used as a loading control and to mark the cytoplasmic fraction.
Source data are available online for this figure.
Figure 3. HDAC4 shows exclusive cytoplasmic localization in VSMCs.
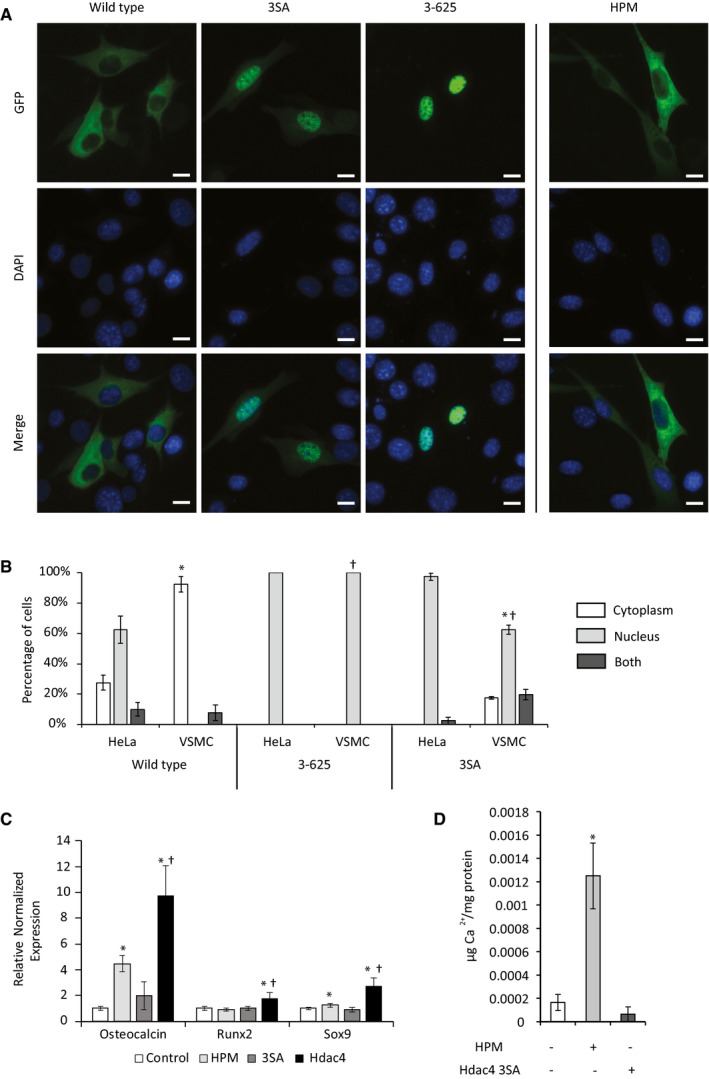
- VSMCs were transfected with the indicated HDAC4 constructs (Fig EV3A) to examine their intracellular localization. VSMCs transfected with the wild‐type HDAC4 were also grown in HPM to observe its effect on HDAC4 localization. Nuclei were counterstained with DAPI. High magnification representative images are shown, demonstrating that wild‐type HDAC4 was exclusively cytoplasmic in control and HPM media, and the 3SA and 3‐625 HDAC4 constructs are entirely nuclear. Scale bar = 10 μm.
- VSMCs or control HeLa epithelial cells were transfected with the indicated HDAC4‐GFP constructs. DAPI staining was used to mark the nucleus. HDAC4 localization was scored automatically using CellProfiler analysis software as being exclusively cytoplasmic (white), exclusively nuclear (light gray), or as occupying both a cytoplasmic and nuclear localization (dark gray). Data are shown as means ± SD (n = 80 cells at least in each group). Chi‐square proportion test, *P < 0.001 between VSMCs and HeLa cells for each construct, †P < 0.001 between indicated construct distribution and wild‐type HDAC4 in VSMCs.
- VSMCs were transfected with wild‐type HDAC4 or 3SA HDAC4 and grown in normal media for 7 days, or HPM as a positive control. qRT–PCR analysis of osteochondrogenic markers is shown. Data are shown as means ± SEM (n = 9), normalized to control. Two‐tailed unpaired Student's t‐test, *P < 0.05 vs. control, †P < 0.05 vs. 3SA HDAC4.
- O‐cresolphthalein calcium colorimetric assay of VSMCs transfected with lacZ in control media (white) or HPM (light gray), or VSMCs transfected with 3SA HDAC4 in control media (dark gray). Data are shown as means ± SEM (n = 8), normalized to protein concentration. Two‐tailed unpaired Student's t‐test, *P < 0.05.
SIK activity controls the cytoplasmic localization of HDAC4
The nuclear localization of the 3SA HDAC4 mutant in VSMCs shows that the cytoplasmic retention of wild‐type HDAC4 depends on the phosphorylation of the three serine residues in the N‐terminal tail of HDAC4. Several protein kinases, such as CamK, PKD, and SIK, were reported to phosphorylate the N‐terminal tail of HDAC4. We used chemical blockers of these kinases to investigate their possible role in the cytoplasmic retention of HDAC4 in VSMCs. We used the cell permeable pan‐PKD inhibitor CID 2011756 that was reported to block PKD1, PKD2, and PKD3 23, and the CamK inhibitor KN‐93 that inhibits CamK I, II, and IV 24. Both inhibitors did not significantly affect the location of HDAC4, which remained completely cytoplasmic even at doses as high as 10 μmol/l: 96.8, 99.6, and 91.6% cytoplasmic localization of HDAC4 with vehicle, PKD inhibitor or CamK inhibitor, respectively (Fig 4A and B). In contrast, the specific pan‐SIK inhibitor HG‐9‐91‐01 that can inhibit SIK1, SIK2, and SIK3 25 induced nuclear import of HDAC4 in a dose‐dependent manner: 96.8, 97.4, 75.7, and 14.4% cytoplasmic localization of HDAC4 with vehicle, 0.5, 2, or 10 μmol/l of HG‐9‐91‐01, respectively (Fig 4A and B). We also tested two other SIK inhibitors—WH‐4‐023 and MRT67307. Both of these agents induced the shuttling of HDAC4 to the nucleus (Fig EV4A). The similar activity of three independent small molecule inhibitors of SIK on HDAC4 localization strongly indicates that the effects on HDAC4 result specifically from the inhibition of SIK.
Figure 4. HDAC4 cytoplasmic localization is controlled by the activity of salt‐inducible kinase (SIK).
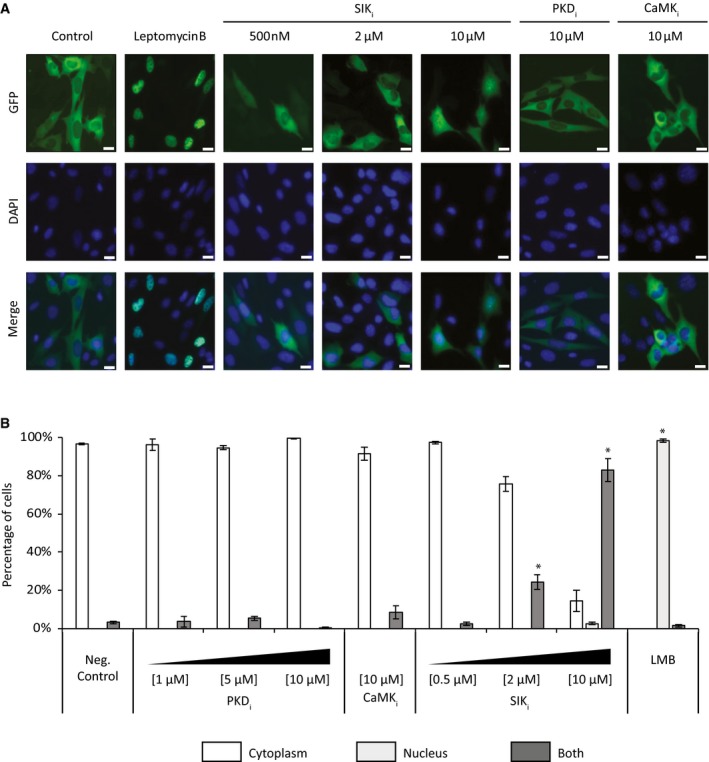
- Representative images of VSMCs transfected with wild‐type GFP‐HDAC4 and treated with the indicated inhibitor and concentration: LMB, leptomycin B; PKDi, CID 2011756; CaMKi, KN‐93; SIKi, HG‐9‐91‐01. DAPI staining was used to mark the nucleus. The nuclear export inhibitor leptomycin B was used as a positive control and induced nuclear accumulation of GFP‐HDAC4. The pan‐SIK inhibitor induced dose‐dependent nuclear accumulation of GFP‐HDAC4. Scale bar = 10 μm.
- HDAC4 localization was scored automatically as being exclusively cytoplasmic (white), exclusively nuclear (light gray) or as occupying both a cytoplasmic and nuclear localization (dark gray). Data are shown as means ± SD (n = 250 cells at least in each group). Chi‐square proportion test, *P < 0.001 vs. negative control.
Figure EV4. Different SIK inhibitors control HDAC4 localization.
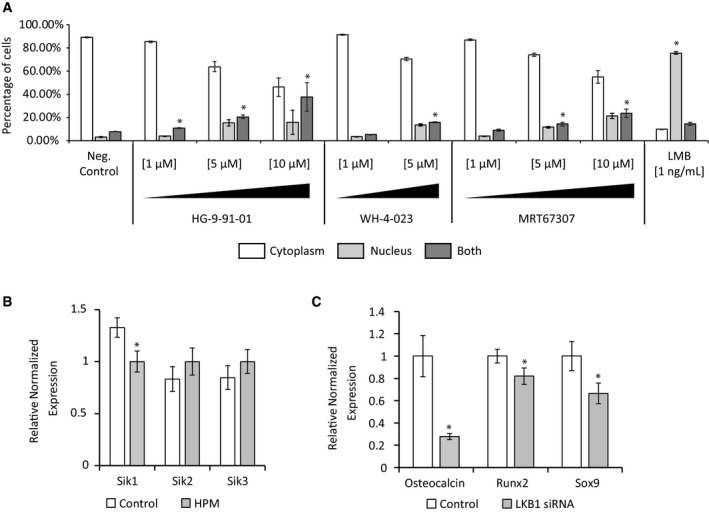
- GFP‐HDAC4 localization after treatment with the indicated SIK inhibitors and concentration was scored automatically as being exclusively cytoplasmic (white), exclusively nuclear (light gray) or as occupying both a cytoplasmic and nuclear localization (dark gray) using CellProfiler cell image and analysis software 22. All three pan‐SIK inhibitors induced dose‐dependent nuclear accumulation of HDAC4. Data are shown as means ± SD (n = 275 cells at least in each group). Chi‐square proportion test, *P < 0.001.
- Gene expression qRT–PCR analysis of the three SIK isoforms in VSMCs shows modest downregulation of SIK1 and modest upregulation of SIK2 and SIK3 following treatment with HPM (gray). Data are shown as means ± SEM (n = 4), relative to control. Two‐tailed unpaired Student's t‐test, *P < 0.05.
- Gene expression qRT–PCR analysis of VSMCs transfected with control or LKB1 siRNA and grown in HPM for 7 days. Data are shown as means ± SEM (n = 4), normalized to control. Two‐tailed unpaired Student's t‐test, *P < 0.05.
SIK activity promotes vascular calcification
Our data show that HDAC4 functions in the cytoplasm to promote the calcification of VSMCs. Therefore, the blockade of SIK kinase that phosphorylates HDAC4 to promote its association with cytoplasmic proteins and controls its cytoplasmic localization is expected to inhibit HDAC4 activity and blunt the calcification process. We therefore induced calcification in both cultured VSMCs and in the aortic ring model with HPM in the presence of the pan‐SIK inhibitor HG‐9‐91‐01 or vehicle. The inhibition of SIK blunted the upregulation of the osteochondrogenic genes and matrix calcification in VSMCs (Fig 5A and B), as well as in aortic rings (Fig 5C and D). SIK has three isoforms (SIK1, SIK2, and SIK3), and all three are expressed in VSMCs (Fig EV4B). This redundancy prevented us from knocking down SIK efficiently. LKB1 is a master kinase that directly phosphorylates the activation loop of SIK as well as other 5′‐AMP‐activated protein kinase (AMPK)‐related kinases 26. Knockdown of LKB1 with siRNA blunted the upregulation of the osteochondrogenic genes (Fig EV4C), further showing the importance of the SIK pathway in vascular calcification.
Figure 5. SIK inhibition blunts the calcification process in vitro and ex vivo .
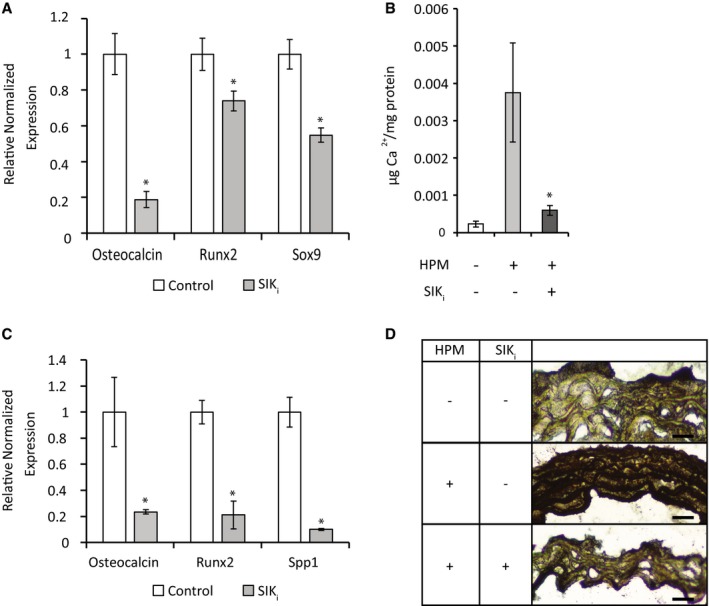
- VSMCs were grown for 7 days in HPM with control (DMSO) or 1 μM HG‐9‐91‐01 (SIKi). Osteochondrogenic marker expression was analyzed using qRT–PCR. Data are shown as means ± SEM (n = 4), normalized to control. Two‐tailed unpaired Student's t‐test, *P < 0.05.
- O‐cresolphthalein calcium colorimetric assay of VSMCs grown in HPM in the presence of HG‐9‐91‐01 for 14 days. Data are shown as means ± SEM (n = 7), normalized to protein concentration. Two‐tailed unpaired Student's t‐test, *P < 0.05 vs. HPM control treatment.
- Aortic rings were grown for 14 days in HPM with control (DMSO) or 1 μM HG‐9‐91‐01 (SIKi). Osteochondrogenic marker expression was analyzed using qRT–PCR. Data are shown as means ± SEM (n = 6), normalized to control. Two‐tailed unpaired Student's t‐test, *P < 0.05.
- Representative images of aortic rings histological sections in control, HPM and HPM with HG‐9‐91‐01 media, stained black for calcium with Von Kossa stain. Scale bar = 30 μm.
Next, we tested the importance of SIK activity for vascular calcification in vivo. ApoE−/− mice were treated with high‐dose vitamin D3 for 6 days as previously described 27. We concomitantly treated the animals with the pan‐SIK inhibitor HG‐9‐91‐01 or vehicle for 3 weeks. Von Kossa staining of whole mount aortic slices (Fig 6A) and Von Kossa and alizarin red staining of fixed and paraffin‐embedded thin aortic sections (Fig 6B and C) showed that vitamin D3 treatment resulted in aortic medial calcification in the mice within 3 weeks, but concomitant treatment with a pan‐SIK inhibitor markedly blunted the development of these calcifications.
Figure 6. SIK inhibition blunts the calcification process in vivo .
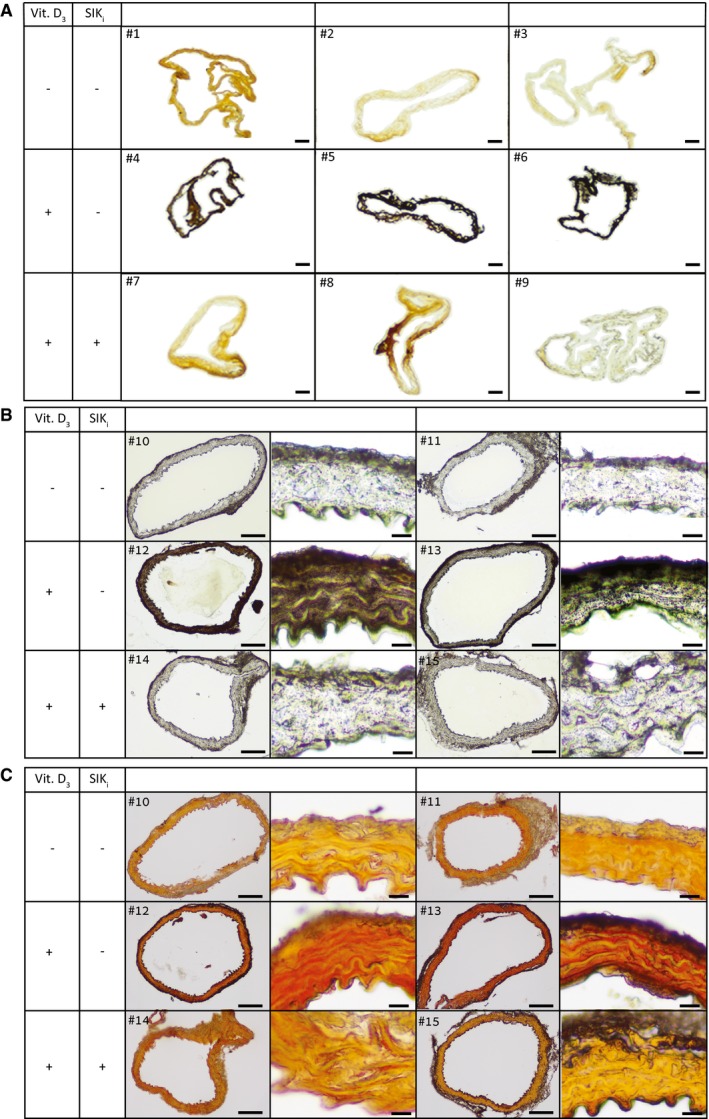
- Mice aortic cryosections of three groups: (i) control (top, mice #1–3), (ii) vitamin D3 (middle, mice #4–6), and (iii) vitamin D3 and SIK inhibitor (bottom, mice #7–9), stained black for calcium with Von Kossa stain. Vitamin D3 causes excessive aortic calcification which is blunted by SIK inhibitor treatment. Scale bar = 100 μm.
- Representative mice aortic paraffin thin sections of three groups: (i) control (top, mice #10–11), (ii) vitamin D3 (middle, mice #12–13), and (iii) vitamin D3 and SIK inhibitor (bottom, mice #14–15), stained black for calcium with Von Kossa stain in low and high magnifications. Scale bars are 100 and 10 μm, respectively.
- Same mice aortic paraffin sections shown in (B) of three groups: (i) control (top, mice #10–11), (ii) vitamin D3 (middle, mice #12–13), and (iii) vitamin D3 and SIK inhibitor (bottom, mice #14–15), stained red for calcium with alizarin red calcium staining, in low and high magnifications. Scale bars are 100 and 10 μm, respectively.
Source data are available online for this figure.
ENIGMA binds HDAC4 in the cytoplasm and promotes vascular calcification
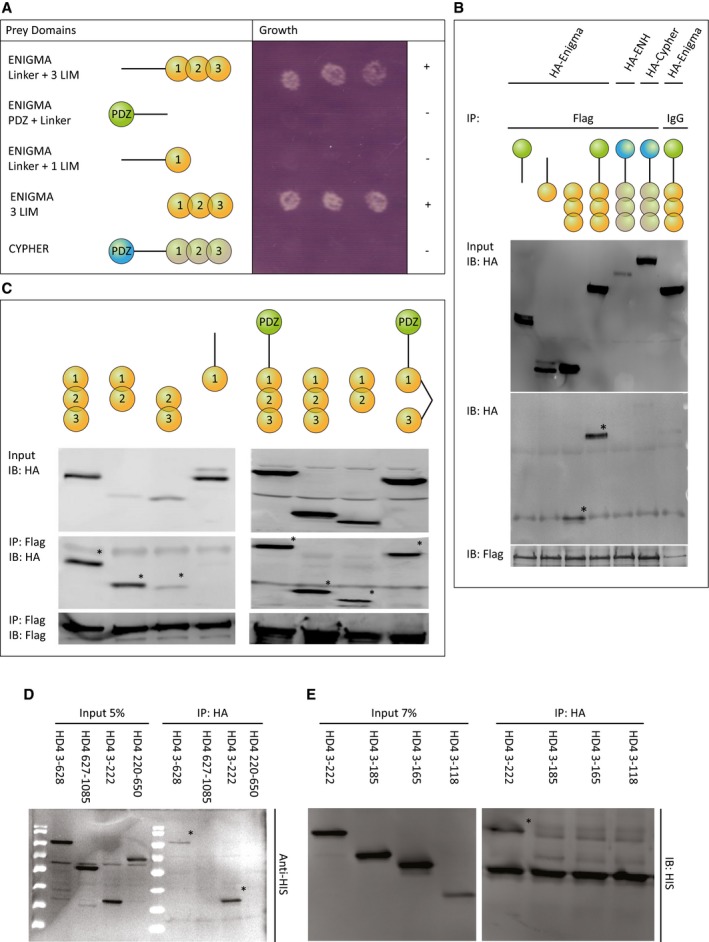
The cytoplasmic function of HDAC4 likely occurs in the context of a protein complex. To identify its members, we searched for HDAC4‐binding partners using the Ras Recruitment System (RRS)‐modified yeast‐two‐hybrid system 28. In the RRS system, the interaction between the bait and prey proteins allows the Cdc25‐2 temperature‐sensitive yeast strain to grow at 36°C. Using the N‐terminal tail of HDAC4 (amino acids 3‐666) as bait, we identified three independent clones of ANKRA2, a known binding partner of HDAC4 29, and three independent clones of the protein ENIGMA (Pdlim7). ENIGMA is a cytoplasmic protein that localizes to actin‐rich structures in vascular smooth muscle, heart, and platelets. Structurally, ENIGMA is composed of an N‐terminal PDZ domain, a linker, and three LIM domains. We initially validated the screen results in yeast with the RRS system using the N‐terminal HDAC4 fragment as bait and different fragments of ENIGMA or the homologous protein CYPHER (Ldb3) as prey (Fig 7A). This analysis showed that constructs containing the three LIM domains of ENIGMA, with or without the linker domain, interacted with the N‐terminal domain of HDAC4 and conferred yeast growth, while constructs containing the PDZ domain and linker, linker and first LIM domain, or the PDZ and LIM domains of the protein CYPHER did not (Fig 7A). We also validated the results using co‐immunoprecipitation in cultured cells with 3HA‐tagged ENIGMA fragments or with 3HA‐tagged ENIGMA family protein Enigma Homologue (ENH, Pdlim5) and CYPHER (Ldb3), and Flag‐tagged full‐length HDAC4. In agreement with the yeast experiments, both the full‐length ENIGMA protein and a fragment containing only the three LIM domains interacted with full‐length Flag‐tagged HDAC4 (Fig 7B), while the 3HA‐tagged ENIGMA fragments containing either the PDZ domain and linker or the linker and first LIM domain did not interact. The 3HA‐tagged Enigma Homologue (ENH, Pdlim5) and CYPHER (Ldb3) showed very little binding (Fig 7B). For more detailed mapping of the interacting domains in ENIGMA, we co‐immunoprecipitated constructs containing one, two, or three of the LIM domains and various combination of two LIM domains of ENIGMA (1 + 2, 2 + 3, or 1 + 3) with the full‐length Flag‐tagged HDAC4 (Fig 7C). This analysis showed that two LIM domains of ENIGMA were required for the interaction with HDAC4, but any two of the three sufficed. We continued with a more detailed mapping of the interacting domains of HDAC4. We co‐immunoprecipitated 3HA‐tagged full‐length ENIGMA and assessed the interaction with 6xHis‐tagged HDAC4 fragments. Initial mapping showed that both the whole N‐terminal fragment of HDAC4 (aa 3‐628) and a smaller fragment containing amino acids 3‐222 of HDAC4 were able to bind ENIGMA (Fig 7D). A finer mapping experiment again showed that an N‐terminal fragment of amino acids 3‐222 of HDAC4 was able to bind ENIGMA, but a fragment of amino acids 3‐185 of HDAC4, or smaller fragments, showed very little binding (Fig 7E). This mapping indicates that the N‐terminal amino acids 185‐222 of HDAC4 interact with two of the three LIM domains of ENIGMA. This domain of HDAC4 does not include any of the three phosphorylated serine residues and indicates that the phosphorylation of HDAC4 is not required for the interaction with ENIGMA.
Figure 7. HDAC4 N‐terminus binds ENIGMA LIM domains.
-
AThe yeast Ras recruitment system (RRS) was used to discover HDAC4‐binding partners. Interaction between the bait and prey proteins allows the Cdc25‐2 temperature‐sensitive yeast strain to grow at 36°C. Cdc25‐2 yeast cells were co‐transfected with HDAC4 N‐terminus (aa 3‐625) and the indicated myristoylated ENIGMA constructs or CYPHER and grown at 36°C. Only constructs containing the three LIM domains of ENIGMA conferred growth.
-
B, CCells were co‐transfected with Flag‐HDAC4 and the indicated 3HA‐tagged ENIGMA constructs, 3HA‐tagged Enigma Homologue (ENH), or 3HA‐tagged CYPHER. Protein lysate was immunoprecipitated (IP) with an antibody recognizing Flag or IgG (negative control). Proteins were separated on SDS–PAGE gel and immunoblotted (IB) with an antibody recognizing HA or Flag. Total protein extract (input, 10% of lysate) is also shown. The analysis shows that any combinations of two of the three LIM domains of ENIGMA, or all three LIM domains are sufficient for the interaction (C). * marks the interacting fragments.
-
D, ECells were co‐transfected with HA‐Enigma and the indicated 6xHIS‐tagged HDAC4 N‐terminal construct. Protein lysate was immunoprecipitated (IP) with an antibody recognizing HA. Proteins were separated on SDS–PAGE gel and immunoblotted (IB) with an antibody recognizing HIS. Total protein extract (input, 5% and 7% of lysate) is also shown. The analysis shows that ENIGMA binds the N‐terminus of HDAC4, specifically the interaction requires amino acids 185‐222. * marks the interacting fragments.
Source data are available online for this figure.
To assess the location of ENIGMA and its relationship with HDAC4, we used immunofluorescence staining in VSMCs. The actin‐binding ENIGMA showed cytoplasmic staining, and the distribution of ENIGMA co‐localized with that of HDAC4 (Fig 8A). Since ENIGMA is an actin‐interacting cytoplasmic protein that binds HDAC4, we checked whether the cytoplasmic retention of HDAC4 in VSMCs was dependent on ENIGMA. To this end, we knocked down ENIGMA expression using siRNAs and assessed the location of HDAC4. Despite achieving a high degree of ENIGMA knockdown (Fig EV5A), the location of HDAC4 was unchanged and remained cytoplasmic (Fig 8B). We also show that overexpression of ENIGMA cannot force the cytoplasmic localization of HDAC4 3SA mutant (Fig EV5B). These observations are not surprising since the phosphorylation of HDAC4 is required for its cytoplasmic localization, and our mapping suggested that phosphorylation of HDAC4 was not required for its binding to ENIGMA.
Figure 8. ENIGMA co‐localizes with HDAC4 in the cytoplasm and promotes calcification in VSMCs.
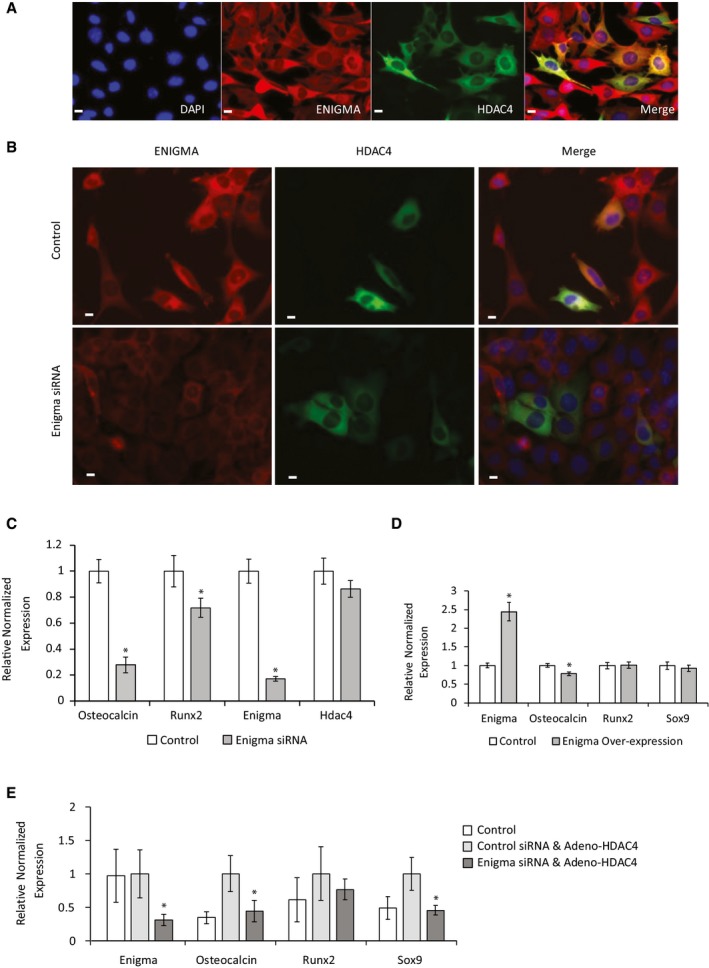
- VSMCs were transfected with GFP‐HDAC4, cells were immunostained with an anti‐ENIGMA antibody (red), and nuclei were counterstained with DAPI (blue). Representative images show cytoplasmic co‐localization of ENIGMA and HDAC4. Scale bar = 10 μm.
- VSMCs were transfected with GFP‐HDAC4 and ENIGMA siRNA or control scrambled siRNA and immunostained with an antibody recognizing ENIGMA. Nuclei were counterstained with DAPI. Knockdown of ENGIMA did not change the cytoplasmic localization of HDAC4. Scale bar = 10 μm.
- VSMCs were transfected with ENIGMA siRNA or control scrambled siRNA, and osteochondrogenic markers were analyzed by qRT–PCR. Data are shown as means ± SEM (n = 8), normalized to control. Two‐tailed unpaired Student's t‐test, *P < 0.05.
- VSMCs were transfected with an ENIGMA encoding plasmid or control lacZ plasmid and grown in control media. Osteochondrogenic markers were analyzed using qRT–PCR. Data are shown as means ± SEM (n = 4), normalized to control. Two‐tailed unpaired Student's t‐test, *P < 0.05.
- VSMCs were transduced with adenoviral vector encoding for Flag‐tagged HDAC4 or control beta‐gal virus and then transfected with ENIGMA or control scrambled siRNA. Osteochondrogenic markers were analyzed using qRT–PCR. Data are shown as means ± SEM (n = 9), relative to control. Two‐tailed unpaired Student's t‐test, *P < 0.05 vs. control siRNA.
Figure EV5. Enigma knockdown and overexpression.
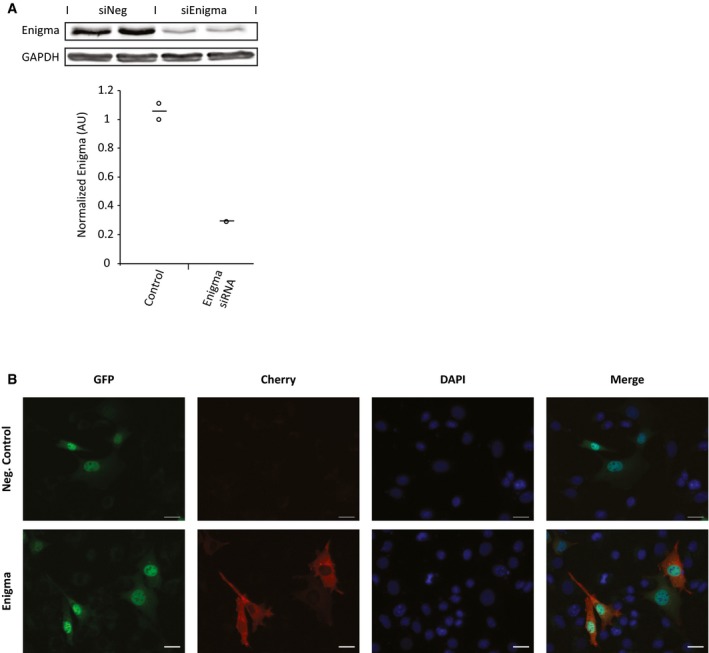
- Western blot analysis and quantification showing the degree of ENIGMA protein knockdown in VSMCs in response to ENIGMA siRNA transfection. Data are shown as single data points and mean (n = 2).
- VSMCs were co‐transfected with GFP‐3SA HDAC4 and Cherry‐ENIGMA plasmids to observe whether ENIGMA overexpression can force cytoplasmic localization of 3SA HDAC4. Representative images are shown. Scale bar = 10 μm.
Source data are available online for this figure.
ENIGMA was reported to promote bone formation 30, and ENIGMA knockout mice displayed reduced trabecular bone density 31. We therefore tested the role of ENIGMA in VSMCs calcification. Indeed, knockdown of ENIGMA significantly impeded the osteochondral differentiation of VSMCs (Fig 8C). Together these data indicate that proteins other than ENIGMA are required to retain HDAC4 in the cytoplasm, but that ENIGMA is required as part of the cytoplasmic complex that promotes calcification in VSMCs. To assess whether HDAC4 and ENIGMA not only act in parallel but that they indeed depend on each other, we initially overexpressed ENIGMA and assessed the effects on osteochondral genes. The overexpression of ENIGMA did not result in upregulation of osteochondral markers and in fact resulted in a very modest, yet significant downregulation of Osteocalcin expression (Fig 8D). This downregulation likely resulted from perturbation of the cytoskeleton‐ENIGMA‐HDAC4 cytoplasmic complex stoichiometry by ENIGMA overexpression. The requirement of ENIGMA together with the inability of ENIGMA overexpression to promote osteochondral differentiation on its own shows that ENIGMA depends on other proteins for this function. We next overexpressed HDAC4 together with control or ENIGMA siRNA. While HDAC4 overexpression was sufficient to induce osteochondral differentiation, the concomitant knockdown of ENIGMA significantly blunted this ability (Fig 8E). These data show that HDAC4 and ENIGMA depend on each other to drive vascular calcification.
To further understand the ENIGMA‐HDAC4 cytoplasmic complex, and to understand how this cytoplasmic complex drives vascular calcification, we performed a second RRS screen with ENIGMA PDZ domain. This screen (Fig EV6A–C) identified the cytoskeletal proteins alpha‐actinin and palladin as ENIGMA PDZ domain binding partners. The α‐actinins are a family of spectrin‐like actin‐binding proteins with critical roles in cytoskeleton maintenance. Stiff substrates led to increased expression of focal adhesion components, including α‐actinin 32, and α‐actinin‐3 deficiency is associated with reduced bone mass in human and mice 33. Palladin is an actin filament‐binding protein that directly crosslinks actin filaments 34. Mutations in palladin that interrupt actin‐binding result in disruption of the actin cytoskeleton 35. Palladin was shown to be upregulated in response to both cyclic tensile strain and osteogenic differentiation 36. These data show that Enigma binds cytoskeletal proteins with its PDZ domain and HDAC4 with its 3‐LIM domain and suggest that this complex in involved in the cytoskeleton response to mechanical stress.
Figure EV6. ENIGMA binds the cytoskeletal proteins α‐actinin and palladin and affects gene expression through the LINC complex.
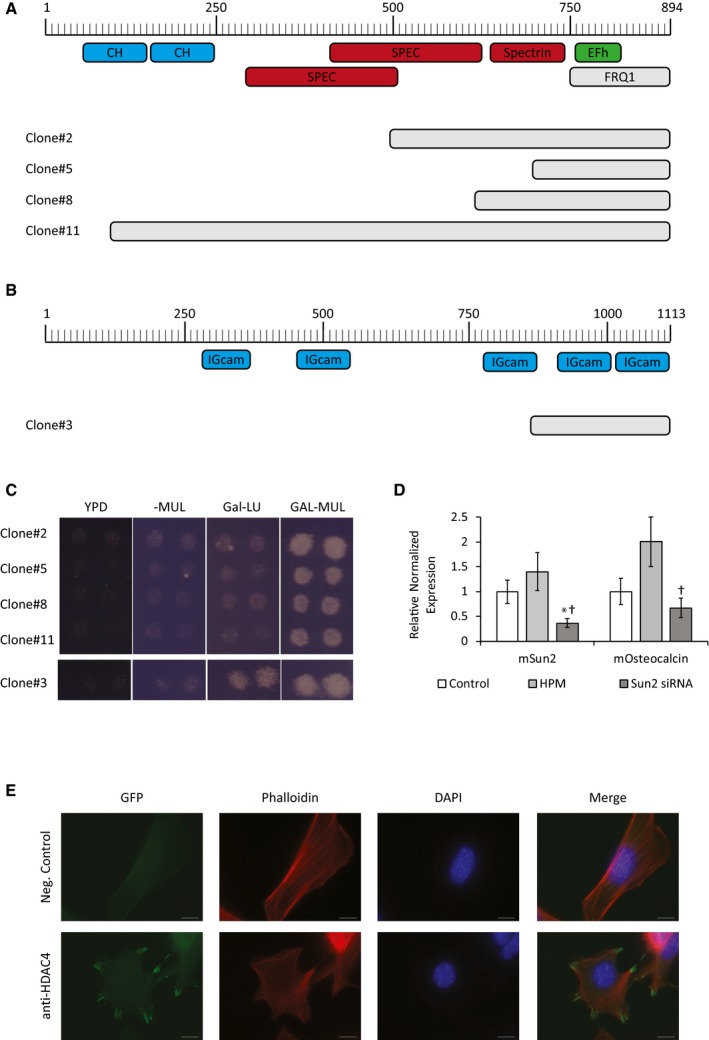
- Cartoon of the α‐actinin protein with its known structural domains. Four independent α‐actinin clones, B1, B5, B8, and B11 (gray), were found to bind ENIGMA PDZ domain using the yeast Ras recruitment system (RRS). All clones contained the C‐terminal domain of α‐actinin.
- Cartoon of the palladin protein with its known structural domains. One clone, B2 (gray), was found to bind ENIGMA through its C‐terminal domain, using the yeast Ras recruitment system (RRS).
- Expression from the bait plasmid is induced in media without methionine (‐M), while expression from the prey plasmid is induced by galactose containing media (GAL). All five positive clones conferred growth at 36°C, only when the expression from both bait and prey plasmid was turned on (GAL‐MUL media), indicating true interaction.
- VSMCs were transfected with SUN2 siRNA or control scrambled siRNA, and Osteocalcin levels were analyzed by qRT–PCR. Data are shown as means ± SEM (n = 4), normalized to control. Two‐tailed unpaired Student's t‐test, *P < 0.05 vs. control, †P < 0.05 vs. HPM.
- Wild‐type VSMCs were fixed with formaldehyde, immunostained with an anti‐HDAC4 antibody (green), phalloidin (red), and nuclei were counterstained with DAPI (blue). Representative images are shown. Scale bar = 10 μm.
Source data are available online for this figure.
Multiple lines of evidence show that VSMCs respond to mechanical signals 2, and it was shown that differentiation of cells to osteoblasts in response to biochemical cues can be modulated by matrix stiffness 32, 37. Data also suggest that mechanical stress can be channeled along cytoskeletal filaments and act directly on the nucleus to regulate gene expression (reviewed in 38). The nucleus is physically connected to the cytoskeleton through the linker of nucleoskeleton and cytoskeleton (LINC) complex 38, that is composed of SUN and KASH family members. KASH proteins interact with cytoskeletal elements through their C‐terminal extremity, whereas SUN proteins are connected to nuclear lamins. The LINC complex was shown to transfer mechanical stresses from the cytoskeleton to the genome and control gene expression 39. To investigate the role of direct transmission of stress from the cytoskeleton to the nucleus, we examined the members of the LINC complex. Sun2, a member of the LINC complex, is an integral membrane protein of the inner nuclear membrane connecting the nuclear envelope to the cytoskeleton 40. The knockdown of Sun2 using siRNA resulted in blunting of HPM‐induced upregulation of Osteocalcin (Fig EV6D), showing that the integrity of the LINC complex is required for osteogenic differentiation of VSMCs and that Osteocalcin gene expression is controlled by the nuclear mechanosensing apparatus. We propose that during vascular calcification, HDAC4 is upregulated and accumulates in the cytoplasm in response to phosphorylation by SIK. Cytoplasmic HDAC4 is recruited to the cytoskeleton (Fig EV6E) to associate with the protein Enigma. We speculate that the ENIGMA‐HDAC4 is part of the cytoskeletal mechanosensing apparatus. Enigma‐mediated recruitment of HDAC4 to the cytoskeleton may modify the response of the cytoskeleton to the extracellular matrix stiffness, and this modified stress is transmitted directly to the nucleus via the LINC complex to change gene expression.
In summary, we showed that the expression of HDAC4 is upregulated during vascular calcification in cultured VSMCs, in aortic rings, and in patient calcifying valves. Using both loss‐ and gain‐of‐function approaches, we further showed that HDAC4 promotes this calcification process. HDAC4 functions to promote calcification in the cytoplasm. It is almost exclusively cytoplasmic in VSMCs, and a nuclear mutant of HDAC4 does not promote calcification. The cytoplasmic location of HDAC4 and its role in calcification depends on the activity of the protein kinase SIK. The inhibition of SIK shuttles HDAC4 to the nucleus and impedes the calcification process. Mechanistically, we showed that in the cytoplasm, HDAC4 binds the cytoskeleton‐associated protein ENIGMA, which is required for vascular calcification (Fig 9).
Figure 9. Model of vascular calcification induction in VSMCs by cytoplasmic HDAC4.
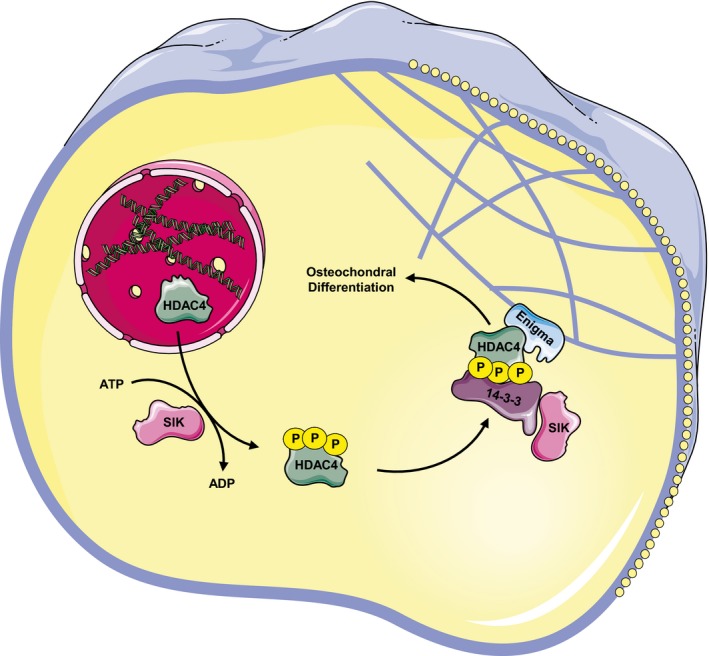
Extracellular stimuli such as high extracellular phosphate induce the upregulation of HDAC4 expression. HDAC4 can shuttle between the nucleus and cytoplasm, but phosphorylation by SIK kinase in VSMCs promotes its cytoplasmic accumulation through binding to 14‐3‐3 proteins. SIK was reported to directly bind 14‐3‐3 proteins. In the cytoplasm, HDAC4 binds the actinin‐associated protein ENIGMA. All the components of this cytoskeletal complex are required to promote vascular calcification, as knockdown of either HDAC4 or ENIGMA or the inhibition of SIK results in blunted calcification.
Discussion
Here, we have identified three novel modulators of vascular calcification: cytoplasmic class IIa HDAC4, the cytoplasmic adaptor protein ENIGMA, and the protein kinase SIK.
Our data show that HDAC4 is upregulated early in vascular calcification and promotes the process. Vascular calcification shares some similarities with early cartilage and bone formation, and HDAC4 has documented activities in both cartilage and bone development. The global deletion of HDAC4 in mice resulted in premature ossification of developing bones due to early onset chondrocyte hypertrophy with early death. Conversely, overexpression of HDAC4 in proliferating chondrocytes in transgenic mice inhibited chondrocyte hypertrophy 17. These observations establish the role of HDAC4 as a suppressor of chondrocyte hypertrophy, a late stage in chondrocyte development. In developing bone, an osteoblast‐specific deletion of HDAC4 resulted in bone loss, suggesting that HDAC4 is a positive regulator of bone formation 18.
The transcription factor Runx2 is a master gene of skeletogenesis. Reporter assays in cultured cells showed that nuclear HDAC4 can repress the transcriptional activity of Runx2. In fact, the constitutively nuclear mutant HDAC4‐3SA was a more potent inhibitor of Runx2 activity than the wild‐type one 17. Another study showed that HDAC4 can bind Runx2 and prevent its acetylation 41. The mechanism of this action is unclear, as HDAC4 has very low deacetylase activity 42. Despite the ability of HDAC4 to repress Runx2 activity in promoter assays, the role of HDAC4 as suppressor of Runx2 in vivo was called into question. The cartilage phenotype of the HDAC4 knockout mice was initially ascribed to the release of Runx2 from HDAC4 inhibitory activity 17, but a later study from the same group showed that the effects were mostly mediated through the release from inhibition of Mef2 in chondrocytes 43. Using an osteoblast‐specific knockout of HDAC4, it was also shown that HDAC4 does not inhibit Runx2 function in osteoblasts in vivo 18. Since HDAC4 is almost exclusively cytoplasmic in VSMCs and Runx2 is a nuclear protein, it is not surprising that HDAC4 does not functionally inhibit Runx2 activity in VSMCs.
Runx2 is necessary but not sufficient for the development of vascular calcification. The elimination of Runx2 from smooth muscle cells blunted the development of vascular calcification 44, but VSMC‐specific overexpression of Runx2 in transgenic mice did not induce aortic calcification 45. Here, high phosphate medium induced a robust calcification in VSMCs with significant upregulation of bone and cartilage marker genes and marked accumulation of matrix calcium. The level of Runx2, however, showed only a non‐significant trend for increase in this system (Fig 1A). In the aortic ring model, induction with HPM did result in a more pronounced increase in Runx2 levels (Fig 1E). These data suggest that the levels of Runx2 are likely higher at baseline in VSMCs than in aortic rings and show that a significant upregulation of Runx2 is not required for the development of calcification. Similarly, the overexpression or knockdown of HDAC4 had only modest non‐significant effects on the expression level of Runx2 in VSMCs (Fig 2A and E) and more significant effects in the aortic ring model (Fig 2C), despite having pronounced effects on the development of calcification in both systems. Together these data imply that other pathways are needed to work in concert with or downstream of Runx2 to promote vascular calcification. Our data suggest that the cytoplasmic HDAC4‐ENIGMA containing complex activates such a pathway.
Osteocalcin is upregulated during VSMCs calcification, and our data are in agreement with vascular calcification data in patients and rodents that also showed the presence of Osteocalcin in calcified plaques 46. We show that Osteocalcin is a major target gene for the cytoplasmic HDAC4‐ENIGMA complex. HDAC4 induces the upregulation of Osteocalcin in cultured VSMCs and in aortic rings, and knockdown of HDAC4 suppresses it. This induction depends on the cytoplasmic protein ENIGMA as overexpression of HDAC4 with knockdown of ENIGMA does not result in Osteocalcin upregulation. We also show that the nuclear 3SA mutant of HDAC4 does not induce the upregulation of Osteocalcin. Finally, we show that disruption of the nuclear mechanosensing LINC complex prevents HPM‐induced Osteocalcin upregulation and that HDAC4 is localized to focal adhesion structures. These findings suggest that the ENIGMA‐HDAC4 cytoplasmic complex is involved in a mechanosensing mechanism that can transmit signals directly to the nucleus to control the expression of genes such as Osteocalcin. In agreement with our results, Osteocalcin gene expression in bone was decreased nearly fourfold in mice with osteoblast‐specific knockout of HDAC4 compared with control mice 47. This regulation of Osteocalcin expression by class II HDACs appeared to be specific to HDAC4, as mice lacking HDAC5, did not demonstrate a decrease in bone Osteocalcin expression 47.
Osteocalcin knockout mice develop bones normally, showing that Osteocalcin can serve as a marker but is not required for normal bone formation 48. Surprisingly, it was shown that when overexpressed, Osteocalcin functions as a stimulator of VSMCs calcification, upregulating Sox9, Runx2, ALP, proteoglycans, and calcium mineral accumulation. Moreover, in vivo administration of Osteocalcin siRNA prevented vitamin D‐induced vascular calcification development 27. This study shows that in contrast with bone, Osteocalcin is both necessary and sufficient for the induction of vascular calcification and that the upregulation of Osteocalcin predates and induces the upregulation of Sox9 and Runx2, rather than result from it. Together, these data suggest that Osteocalcin may be the primary target gene of the cytoplasmic HDAC4‐ENIGMA complex in VSMCs.
Despite tremendous discoveries about the function, nucleo‐cytoplasmic shuttling, structure, and binding partners of class IIa HDACs, several key questions about their mechanism of actions remain unsolved. Depending on the cell type, HDAC4 can be found either in the nucleus or in the cytoplasm under basal conditions. In addition to the well‐documented actions of HDAC4 in the nucleus, indirect evidence suggests that HDAC4 may have additional cytoplasmic functions. For example, the predominant cytoplasmic localization of HDAC4 in neurons, combined with localization to specific cytoplasmic regions such as dendritic spines, suggests a non‐nuclear role for HDAC4 in memory formation 49. The accumulating evidence indicates that HDAC4 function in memory is not through global alteration in histone acetylation, nor through a significant effect on transcription, further suggesting a cytoplasmic role 49. Here, we conclusively establish a cytoplasmic role for HDAC4. HDAC4 is almost exclusively cytoplasmic in VSMCs at baseline and following osteochondral differentiation. The ability of HDAC4 to promote calcification, despite this exclusive cytoplasmic localization, strongly indicates that HDAC4 functions in the cytoplasm in this context. Importantly, the nuclear 3SA mutant of HDAC4 did not drive calcification. We also show that inhibition of SIK sends HDAC4 to the nucleus and blocks its ability to promote calcification and that HDAC4 binds a cytoplasmic protein—ENIGMA that is required for its function, further supporting a cytoplasmic function of HDAC4. While a nuclear role for HDAC4 is well established and is likely the predominant mechanism of action in cardiomyocytes and maturing chondrocytes, we provide conclusive evidence that in VSMCs, HDAC4 has a cytoplasmic role.
An evolutionary replacement of a class I HDAC catalytic tyrosine by histidine in class IIa HDACs catalytic pocket results in almost complete abolition of their catalytic activity 42. It is hypothesized that class IIa HDACs could function as readers of acetylated proteins, rather than enzymes, acting as molecular scaffolds that recruit additional enzymes and proteins 50. We identified the cytoplasmic protein ENIGMA as a binding partner of HDAC4. The PDZ and LIM domains of ENIGMA act as protein‐binding interfaces to facilitate dynamic interactions of signaling molecules 51. We show that HDAC4 co‐localizes with ENIGMA in the cytoplasm of VSMCs and that ENIGMA was required for the calcification process. Thousands of proteins are acetylated in different cellular compartments to mediate a wide variety of biological processes 52. HDAC4 binds ENIGMA by its N‐terminal tail, and we speculate that it binds or “reads” cytoplasmic‐acetylated proteins with its C‐terminal deacetylase domain to form the ENIGMA pro‐calcification protein complex. ENIGMA binds alpha‐actinin and palladin with its PDZ domain, and we hypothesize that the ENIGMA‐HDAC4 complex controls a mechanosensing cytoskeletal element that signals the activation of the osteochondrogenic gene program in VSMCs.
SIK1, SIK2, and SIK3 are members of AMPK family. SIK1 was shown to phosphorylate HDAC5 and promote its cytoplasmic accumulation 14. SIK3 expression was observed in the cytoplasm of prehypertrophic and hypertrophic chondrocytes, and SIK3 knockout mice showed impaired chondrocyte hypertrophy 53. Mechanistically, SIK3 was shown to bind, phosphorylate, and induce the cytoplasmic accumulation of HDAC4. We show here that the inhibition of CaMK or PKD did not induce nuclear accumulation of HDAC4 in VSMCs. In contrast, the inhibition of SIK activity resulted in a dose‐dependent nuclear accumulation of HDAC4 and blunting of the calcification process in cultured VSMCs, in aortic rings, and in vivo. The ability of two other molecules that inhibit SIK or knockdown of an upstream kinase LKB1 to interfere with the process is further evidence for the role of SIK in vascular calcification. The phosphorylation of HDAC4 is required for its binding to proteins such as 14‐3‐3. This binding likely serves more functions than retaining HDAC4 in the cytoplasm and is probably required for HDAC4 cytoplasmic activity. SIK was shown to bind 14‐3‐3 following phosphorylation by LKB1 54. It was recently shown that parathyroid hormone inhibition of SOST (sclerostin), a WNT antagonist, requires HDAC4 and HDAC5 and is dependent on the inhibition of SIK2 to promote bone growth 55. In contrast with bone, parathyroid hormone suppresses vascular calcification 56, and sclerostin is upregulated in the calcification process 57. The SIKs are expressed in several tissues. The inhibition of SIK was shown to reprogram macrophages to an anti‐inflammatory phenotype 25. HG‐9‐91‐01 was shown to enhance gluconeogenic gene expression and glucose production in hepatocytes 26. Once‐daily treatment with the small molecule SIK inhibitor YKL‐05‐099 was shown to mimic skeletal effects of PTH and increase bone mass 55. Therefore, any potential use of SIK inhibitor should include a thorough analysis of off‐target effects.
The understanding that vascular calcification is an active process suggests that therapeutic agents may be able to modify its development. However, to date, no such therapies are available. We identified here three novel modulators—the class IIa HDAC4, the adaptor protein ENIGMA, and the protein kinase SIK that together positively regulate this pathological process. We show that inhibition of each of these proteins can blunt the calcification process. Importantly, the ability of a small molecule inhibitor of SIK to blunt vascular calcification in vivo suggests that inhibition of this pathway may be able to target vascular calcification and prevent disease progression, although further studies are needed to assess the efficacy of such an approach.
Materials and Methods
Animal experiments
ApoE−/− mice were purchased from The Jackson Laboratory. All animals were housed in a temperature‐controlled environment with 12‐h light/dark cycles with food and water available ad libitum. Mice were aged 8 weeks when entering the study. Aortic calcification was induced via vitamin D3 overload as previously described 27. 1α,25‐Dihydroxyvitamin D3 (Sigma‐Aldrich) was dissolved in 100% ethanol and diluted freshly. Mice received IP injections of 1α,25‐dihydroxyvitamin D3 for six consecutive days at a final concentration of 5 μg/kg in 5% ethanol. SIK inhibition was achieved by daily administration of HG‐9‐91‐01 (ApexBio #B1052) in DMSO at a final concentration of 5 mg/kg/day. Littermate ApoE−/− mice were arbitrarily divided to receive treatment or control. In the first 4 days, HG‐9‐91‐01 was injected IP, and on day 5, osmotic pumps (Alzet model 1002) were implanted. Animals were monitored daily and terminated for study at day 18. Specifically, mice were sacrificed in isoflurane and aortas were collected for histology. All mice procedures were performed in accordance with institutional guidelines.
Histochemical staining
Aortas were either fresh‐frozen in OCT sliced into section with a cryostat or fixed in 4% formaldehyde, embedded in paraffin, and cut into thin sections. Slides were stained to detect calcium depositions with alizarin red or Von Kossa stains. Alizarin red: Slides were incubated in 2% alizarin red (Sigma‐Aldrich) for 5 min at room temperature, and excess stain was washed in DDW. Von Kossa: Slides were incubated for 20 min in 5% silver nitrate (Sigma‐Aldrich), washed twice in DDW, and immersed in 0.5% hydroquinone (Sigma‐Aldrich) for 2 min followed by 2 min of 5% sodium thiosulfate (Alfa Aesar).
Cell culture
Mouse aortic smooth muscle cells were purchased from ATCC (CRL‐2797) and grown in DMEM supplemented with 10% FBS. 10 mmol/l beta‐glycerophosphate (Sigma‐Aldrich) and 0.2 mmol/l 2‐phospho‐L‐ascorbic acid (Sigma‐Aldrich) was added to the growth media for 3–14 days to induce calcification (HPM). All cultured cells were maintained at 37°C with 5% CO2.
Calcium quantification assay
After 14 days of growth, cells were washed in PBS and incubated overnight in 0.6 N HCl. HCl was collected, and calcium content was measured using o‐cresolphthalein Calcium colorimetric assay kit (Sigma‐Aldrich) according to manufacturer's instructions. Calcium concentration was then normalized to cells protein concentration.
Aortic rings assay
Aortic rings were prepared as described 21. In brief, adult C57BL/6 mice were euthanized with isoflurane; thoracic aorta was dissected, cleaned under a microscope, and cut into rings. Aortic rings were grown in serum‐free DMEM overnight to uniform baseline state, embedded in collagen the next morning, and grown for 2 weeks. Viral transduction was performed in the serum‐starvation stage. 10 mmol/l beta‐glycerophosphate (Sigma‐Aldrich) and 0.2 mmol/l 2‐phospho‐L‐ascorbic acid (Sigma‐Aldrich) were added to the growth media for 14 days to induce calcification (HPM).
Human aortic valves
The study was approved by an institutional review committee and subjects gave informed consent. Human aortic valves samples were obtained at Rambam Health Care Campus during aortic valve replacement surgeries. The donors were males and females aged 60–80 with different degrees of aortic valve calcification. Samples were transported to the laboratory in RNA later (Thermo‐Fisher Scientific); macroscopic healthy parts were used as control.
RNA extraction RT and qRT–PCR
RNA was extracted from cultured cell using the NucleoSpin RNA kit (MACHEREY‐NAGEL). The RNeasy Fibrous Tissue mini and midi kits (Qiagen) were used to extract RNA from aortic rings and human tissue (respectively). All kits were used in accordance with manufacturer protocol. Reverse transcription was done using iScript reagent (Bio‐Rad). Quantitative real‐time PCR was performed with iTaq universal SYBR green supermix (Bio‐Rad) using Bio‐Rad CFX96 real‐time system. Previous study has shown that Actb was among the most stably expressed genes in differentiating osteoblasts 58, and therefore, expression data were normalized to the expression of Actb. For each expression analysis, we used at least two different experiments, at least four biological replicates, and two technical replicates for each biological replicates for each gene. We performed a standard curve for each primer pair. All primers and probes were ordered from IDT (see Tables 1 and 2):
Table 1.
Primers used in this study
| Species | Gene | Forward | Backward |
|---|---|---|---|
| Human | HDAC4 | GGC CCA CCG GAA TCT GAA C | GAA CTC TGG TCA AGG GAA CTG |
| Mouse | Actb | CTC TGG CTC CTA GCA CCA TGA AGA | GTA AAA CGC AGC TCA GTA ACA GTC CG |
| Mouse | Runx2 | CGG CCC TCC CTG AAC TCT | TGC CTG CCT GGG ATC TGT A |
| Mouse | Osteocalcin | GCA ATA AGG TAG TGA ACA GAC TCC | GTT TGT AGG CGG TCT TCA AGC |
| Mouse | Sox9 | CGA CCC ATG AAC GCC TT | GTC TCT TCT CGC TCT CGT TC |
| Mouse | Alkp | GGC TGG AGA TGG ACA AAT TCC | CCG AGT GGT AGT CAC AAT GCC |
| Mouse | Spp1 | ATC TCA CCA TTC GGA TGA GTC T | TGT AGG GAC GAT TGG AGT GAA A |
| Mouse | Enigma | TGC AAG AAG AAG ATC ACT GGA G | CAT TGA AGT CCT TGC CCC CT |
| Mouse | Hdac1 | AGT CTG TTA CTA CTA CGA CGG G | TGA GCA GCA AAT TGT GAG TCA T |
| Mouse | Hdac2 | GGA GGA GGC TAC ACA ATC CG | TCT GGA GTG TTC TGG TTT GTC A |
| Mouse | Hdac3 | ACC GTG GCG TAT TTC TAC GAC | CAG GCG ATG AGG TTT CAT TGG |
| Mouse | Hdac4 | CAC TGC ATT TCC AGC GAT CC | AAG ACG GGG TGG TTG TAG GA |
| Mouse | Hdac5 | TGC AGC ACG TTT TGC TCC T | GAC AGC TCC CCA GTT TTG GT |
| Mouse | Hdac6 | TCC ACC GGC CAA GAT TCT TC | CAG CAC ACT TCT TTC CAC CAC |
| Mouse | Hdac7 | GAA CTC TTG AGC CCT TGG ACA | GGT GTG CTG CTA CTA CTG GG |
| Mouse | Hdac8 | ACT ATT GC GGA GAT CCA ATG T | CCT CCT AAA ATC AGA GTT GCC AG |
| Mouse | Hdac9 | CAG AAG CAG CAC GAG AAT TTG A | CTC TCT GCG ATG CCT CTC TAC |
| Mouse | Sik1 | TCA TGT CGG AGT TCA GTG CG | ACC TGC GTT TTG GTG ACT CG |
| Mouse | Sik2 | CTG CTG GCA ACA TGG TGT G | GGG AGA GTT GGT CCA TCA AAA G |
| Mouse | Sik3 | GCC ATC CAC ACA TCA TCA GAC | CCA AGT GGT CAA ATA TCT CCC C |
| Mouse | Lkb1 | TTG GGC CTT TTC TCC GAG G | CAG GTC CCC CAT CAG GTA CT |
| Mouse | Sun2 | ATC CAG ACC TTC TAT TTC CAG GC | CCC GGA AGC GGT AGA TAC AC |
Table 2.
Probes used in this study
| Species | Gene | Probe |
|---|---|---|
| Human | ACTB | Hs.PT.39a.22214847 |
| Human | RUNX2 | Hs.PT.58.19252426 |
| Human | SPP1 | Hs.PT.53a.19568141 |
| Human | HDAC4 | Hs.PT.58.19252426 |
Cell transfection + siRNA
Cells were transfected with pEGFP‐HDAC4, pEGFP‐HDAC4 3SA, pcDNA HDAC4‐Flag that were a gift from Tso‐Pang Yao (Addgene plasmid #45636, #45637, #30485) 59 or pEGFP‐HDAC4 3‐625 plasmid. Mouse ENIGMA (Pdlim7) or truncation mutants were cloned to pcDNA‐3HA backbone plasmid. Transfections were performed using PolyJet reagent (SignaGen) according to manufacturer's instructions. Hdac4 siRNA (IDT), ENIGMA siRNA (GE Healthcare Life Sciences Dharmacon) LKB1 siRNA (IDT), and Sun2 siRNA (IDT) were transfected to the cells using Stemfect RNA Transfection Kit (Stemgent Inc.) according to manufacturer's instructions.
The ras recruitment system
The RRS screen was performed as described previously 28. The bait was a hybrid protein with the mammalian activated Ras protein lacking its farnesylation CAAX box fused to the human HDAC4 N‐terminus (aa 3–666). The bait plasmid was co‐transfected into Cdc25‐2 yeast cells with prey plasmids of different myristoylated ENIGMA constructs. The prey plasmids were designed under the control of the Gal1‐inducible promoter, while the expression of the bait was controlled by a Met‐off inducible promoter. Plates were incubated for 7 days at the permissive temperature of 24°C and were subsequently replica plated onto inductive medium and incubated at the restrictive temperature of 36°C.
Immunoprecipitation and Western blot
Cultured cells were washed with ice‐cold phosphate‐buffered saline (PBS) buffer and lysed in buffer containing 50 mM Tris, pH 7.5, 150 mM NaCl, 1 mM EDTA, and 1% NP‐40. 400 μg of protein was immunoprecipitated with anti‐Flag (Sigma‐Aldrich), or IgG antibodies (negative control) and protein A/G agarose beads (Santa Cruz Biotechnology, Inc.) as described previously 60. Beads were washed three times with buffer and suspended in 30 μl of Laemmli buffer. Proteins were separated on an SDS gel, blotted, and detected with primary antibody recognizing HA (Santa Cruz Biotechnology, Inc. sc‐805) or Flag (Sigma‐Aldrich).
Western blot and protein fractionation
Cultured cells were washed with ice‐cold phosphate‐buffered saline (PBS) buffer and lysed in buffer containing 50 mM Tris, pH 7.5, 150 mM NaCl, 1 mM EDTA, and 1% NP‐40. Proteins were separated on an SDS gel, blotted, and detected with primary antibodies recognizing HDAC4 (cell signaling 7,628 s) or Pdlim7 (ProteinTech #10221‐1‐AP).
For cytoplasmic and nuclear fractionation, we used lysis buffer containing 10 mM HEPES, pH 7.9, 10 mM KCl, 1 mM EDTA, 1 mM DTT, and 1% NP‐40 for the cytoplasmic fraction and lysis buffer containing 20 mM HEPES, pH 7.9, 400 mM NaCl, 1 mM EDTA and 1 mM DTT for the nuclear fraction. Proteins were separated on an SDS gel, blotted, and detected with primary anti‐Flag antibody (Sigma‐Aldrich).
Chemicals (inhibitors)
The pan‐SIK inhibitors: HG‐9‐91‐01 (ApexBio #B1052), WH‐4‐023 (Sigma‐Aldrich), MRT67307 (Sigma‐Aldrich), and the pan‐PKD and CamK inhibitors: CID‐2011756 (Cayman #15317), KN‐93 (Sigma‐Aldrich K1285), were added to the HPM at final concentrations of 0.5, 1, 2, 5, and 10 μmol/l.
Immunofluorescence and image analysis
For localization and co‐localization assays, cells were transfected with pEGFP‐HDAC4 plasmids, fixed with 4% formaldehyde in PBS, and blocked in 5% FBS in PBS. Staining for ENIGMA was done with overnight incubation of an antibody recognizing Pdlim7 (ProteinTech #10221‐1‐AP) in 2% FBS. Cy3‐conjugated AffiniPure Donkey Anti‐Rabbit IgG secondary antibody (Jackson ImmunoResearch) was used for detection. Nuclei were counterstained with DAPI 1 μg/ml. Cells were imaged using Zeiss Axio observer fluorescent microscope. Cytoplasmic and nuclear localization analysis was performed automatically on acquired images using CellProfiler cell image and analysis software 22.
Adenoviral vectors
The Gateway system (Invitrogen) was used to generate pEntry clones for adenoviral vector production. Adenoviral vectors were generated as described previously 60.
Statistical analysis
Data were expressed as mean ± SEM or mean ± SD where indicated. Sample size was chosen based on the size of similar studies in the literature. Comparisons between groups were performed using the Student's t‐test where indicated. The chi‐square proportion test was used to compare percentages where indicated. At least two independent sets of experiments containing at least two biological replicated each were performed.
Author contributions
AA, OS, MF, LHC, and IK performed experiments. AA, OS, and IK designed the project and performed data analysis. AA, OS, and IK wrote the manuscript. All authors discussed the results and commented on the manuscript.
Conflict of interest
The authors declare that they have no conflict of interest. A provisional patent application was applied based on results from this manuscript.
Supporting information
Expanded View Figures PDF
Source Data for Expanded View
Review Process File
Source Data for Figure 1
Source Data for Figure 6
Source Data for Figure 7
Acknowledgements
We thank the Biomedical Core Facility at the faculty of Medicine, Technion, and the Pre‐Clinical Research Authority at the Technion for their invaluable assistance. This study was supported in part by the Rappaport Family Institute for Research in the Medical Sciences, the Clinical Research Institute at Rambam, Rambam Medical Center, the MARIE CURIE Action Career Integration Grants, the Simon and Beatrice Apple Research Fund, the Israel Science Foundation (873/12), and Israel Ministry of Health (3‐9848).
EMBO Reports (2017) 18: 1166–1185
References
- 1. Ho CY, Shanahan CM (2016) Medial arterial calcification highlights. Arterioscler Thromb Vasc Biol 36: 1475–1482 [DOI] [PubMed] [Google Scholar]
- 2. Sage AP, Tintut Y, Demer LL (2010) Regulatory mechanisms in vascular calcification. Nat Rev Cardiol 7: 528–536 [DOI] [PMC free article] [PubMed] [Google Scholar]
- 3. Rennenberg RJ, Kessels AG, Schurgers LJ, van Engelshoven JM, de Leeuw PW, Kroon AA (2009) Vascular calcifications as a marker of increased cardiovascular risk: a meta‐analysis. Vasc Health Risk Manag 5: 185–197 [DOI] [PMC free article] [PubMed] [Google Scholar]
- 4. Speer MY, Yang HY, Brabb T, Leaf E, Look A, Lin WL, Frutkin A, Dichek D, Giachelli CM (2009) Smooth muscle cells give rise to osteochondrogenic precursors and chondrocytes in calcifying arteries. Circ Res 104: 733–741 [DOI] [PMC free article] [PubMed] [Google Scholar]
- 5. Leopold JA (2015) Vascular calcification: mechanisms of vascular smooth muscle cell calcification. Trends Cardiovasc Med 25: 267–274 [DOI] [PMC free article] [PubMed] [Google Scholar]
- 6. Paloian NJ, Giachelli CM (2014) A current understanding of vascular calcification in CKD. Am J Physiol Renal Physiol 307: F891–F900 [DOI] [PMC free article] [PubMed] [Google Scholar]
- 7. Aikawa E, Aikawa M, Libby P, Figueiredo J‐L, Rusanescu G, Iwamoto Y, Fukuda D, Kohler RH, Shi G‐P, Jaffer FA et al (2009) Arterial and aortic valve calcification abolished by elastolytic cathepsin S deficiency in chronic renal disease. Circulation 119: 1785–1794 [DOI] [PMC free article] [PubMed] [Google Scholar]
- 8. Vassalle C, Mazzone A (2016) Bone loss and vascular calcification: a bi‐directional interplay? Vascul Pharmacol 86: 77–86 [DOI] [PubMed] [Google Scholar]
- 9. Haberland M, Montgomery RL, Olson EN (2009) The many roles of histone deacetylases in development and physiology: implications for disease and therapy. Nat Rev Genet 10: 32–42 [DOI] [PMC free article] [PubMed] [Google Scholar]
- 10. Chakraborty S, Reineke EL, Lam M, Li X, Liu Y, Gao C, Khurana S, Kao H‐Y (2006) Alpha‐actinin 4 potentiates myocyte enhancer factor‐2 transcription activity by antagonizing histone deacetylase 7. J Biol Chem 281: 35070–35080 [DOI] [PubMed] [Google Scholar]
- 11. Parra M (2015) Class IIa HDACs – new insights into their functions in physiology and pathology. FEBS J 282: 1736–1744 [DOI] [PubMed] [Google Scholar]
- 12. Backs J, Song K, Bezprozvannaya S, Chang S, Olson EN (2006) CaM kinase II selectively signals to histone deacetylase 4 during cardiomyocyte hypertrophy. J Clin Invest 116: 1853–1864 [DOI] [PMC free article] [PubMed] [Google Scholar]
- 13. Vega RB, Harrison BC, Meadows E, Roberts CR, Papst PJ, Olson EN, McKinsey TA (2004) Protein kinases C and D mediate agonist‐dependent cardiac hypertrophy through nuclear export of histone deacetylase 5. Mol Cell Biol 24: 8374–8385 [DOI] [PMC free article] [PubMed] [Google Scholar]
- 14. Berdeaux R, Goebel N, Banaszynski L, Takemori H, Wandless T, Shelton GD, Montminy M (2007) SIK1 is a class II HDAC kinase that promotes survival of skeletal myocytes. Nat Med 13: 597–603 [DOI] [PubMed] [Google Scholar]
- 15. Walkinshaw DR, Weist R, Kim G‐W, You L, Xiao L, Nie J, Li CS, Zhao S, Xu M, Yang X‐J (2013) The tumor suppressor kinase LKB1 activates the downstream kinases SIK2 and SIK3 to stimulate nuclear export of class IIa histone deacetylases. J Biol Chem 288: 9345–9362 [DOI] [PMC free article] [PubMed] [Google Scholar]
- 16. Parra M, Verdin E (2010) Regulatory signal transduction pathways for class IIa histone deacetylases. Curr Opin Pharmacol 10: 454–460 [DOI] [PubMed] [Google Scholar]
- 17. Vega RB, Matsuda K, Oh J, Barbosa AC, Yang X, Meadows E, McAnally J, Pomajzl C, Shelton JM, Richardson JA et al (2004) Histone deacetylase 4 controls chondrocyte hypertrophy during skeletogenesis. Cell 119: 555–566 [DOI] [PubMed] [Google Scholar]
- 18. Obri A, Makinistoglu MP, Zhang H, Karsenty G (2014) HDAC4 integrates PTH and sympathetic signaling in osteoblasts. J Cell Biol 205: 771–780 [DOI] [PMC free article] [PubMed] [Google Scholar]
- 19. Mackenzie NCW, Zhu D, Longley L, Patterson CS, Kommareddy S, MacRae VE (2011) MOVAS‐1 cell line: a new in vitro model of vascular calcification. Int J Mol Med 27: 663–668 [DOI] [PubMed] [Google Scholar]
- 20. Giachelli CM, Speer MY, Li X, Rajachar RM, Yang H (2005) Regulation of vascular calcification: roles of phosphate and osteopontin. Circ Res 96: 717–722 [DOI] [PubMed] [Google Scholar]
- 21. Baker M, Robinson SD, Lechertier T, Barber PR, Tavora B, D'Amico G, Jones DT, Vojnovic B, Hodivala‐Dilke K (2012) Use of the mouse aortic ring assay to study angiogenesis. Nat Protoc 7: 89–104 [DOI] [PubMed] [Google Scholar]
- 22. Carpenter AE, Jones TR, Lamprecht MR, Clarke C, Kang IH, Friman O, Guertin DA, Chang JH, Lindquist RA, Moffat J et al (2006) Cell Profiler: image analysis software for identifying and quantifying cell phenotypes. Genome Biol 7: R100 [DOI] [PMC free article] [PubMed] [Google Scholar]
- 23. Sharlow ER, Mustata Wilson G, Close D, Leimgruber S, Tandon M, Reed RB, Shun TY, Wang QJ, Wipf P, Lazo JS (2011) Discovery of diverse small molecule chemotypes with cell‐based PKD1 inhibitory activity. PLoS One 6: e25134 [DOI] [PMC free article] [PubMed] [Google Scholar]
- 24. Pellicena P, Schulman H (2014) CaMKII inhibitors: from research tools to therapeutic agents. Front Pharmacol 5: 21 24600394 [Google Scholar]
- 25. Clark K, MacKenzie KF, Petkevicius K, Kristariyanto Y, Zhang J, Choi HG, Peggie M, Plater L, Pedrioli PGA, McIver E et al (2012) Phosphorylation of CRTC3 by the salt‐inducible kinases controls the interconversion of classically activated and regulatory macrophages. Proc Natl Acad Sci 109: 16986–16991 [DOI] [PMC free article] [PubMed] [Google Scholar]
- 26. Patel K, Foretz M, Marion A, Campbell DG, Gourlay R, Boudaba N, Tournier E, Titchenell P, Peggie M, Deak M et al (2014) The LKB1‐salt‐inducible kinase pathway functions as a key gluconeogenic suppressor in the liver. Nat Commun 5: 4535 [DOI] [PMC free article] [PubMed] [Google Scholar]
- 27. Idelevich A, Rais Y, Monsonego‐Ornan E (2011) Bone gla protein increases HIF‐1‐dependent glucose metabolism and induces cartilage and vascular calcification. Arterioscler Thromb Vasc Biol 31: e55–e71 [DOI] [PubMed] [Google Scholar]
- 28. Broder YC, Katz S, Aronheim A (1998) The ras recruitment system, a novel approach to the study of protein‐protein interactions. Curr Biol 8: 1121–1124 [DOI] [PubMed] [Google Scholar]
- 29. McKinsey TA, Kuwahara K, Bezprozvannaya S, Olson EN (2006) Class II histone deacetylases confer signal responsiveness to the ankyrin‐repeat proteins ANKRA2 and RFXANK. Mol Biol Cell 17: 438–447 [DOI] [PMC free article] [PubMed] [Google Scholar]
- 30. Liu H, Bargouti M, Zughaier S, Zheng Z, Liu Y, Sangadala S, Boden SD, Titus L (2010) Osteoinductive LIM mineralization protein‐1 suppresses activation of NF‐kappaB and selectively regulates MAPK pathways in pre‐osteoclasts. Bone 46: 1328–1335 [DOI] [PMC free article] [PubMed] [Google Scholar]
- 31. Gary MF, Viggeswarapu M, Oliver C, Teklemariam M, Sangadala S, Titus L, Boden SD (2014) Lim mineralization protein‐1 knockout mice have reduced spine trabecular bone density on microcomputed tomography due to decreased bone morphogenetic protein responsiveness. Neurosurgery 61(Suppl. 1): 182–186 [DOI] [PubMed] [Google Scholar]
- 32. Engler AJ, Sen S, Sweeney HL, Discher DE (2006) Matrix elasticity directs stem cell lineage specification. Cell 126: 677–689 [DOI] [PubMed] [Google Scholar]
- 33. Yang N, Schindeler A, McDonald MM, Seto JT, Houweling PJ, Lek M, Hogarth M, Morse AR, Raftery JM, Balasuriya D et al (2011) α‐Actinin‐3 deficiency is associated with reduced bone mass in human and mouse. Bone 49: 790–798 [DOI] [PubMed] [Google Scholar]
- 34. Gurung R, Yadav R, Brungardt JG, Orlova A, Egelman EH, Beck MR (2016) Actin polymerization is stimulated by actin cross‐linking protein palladin. Biochem J 473: 383–396 [DOI] [PMC free article] [PubMed] [Google Scholar]
- 35. Beck MR, Dixon RDS, Goicoechea SM, Murphy GS, Brungardt JG, Beam MT, Srinath P, Patel J, Mohiuddin J, Otey CA et al (2013) Structure and function of palladin's actin binding domain. J Mol Biol 425: 3325–3337 [DOI] [PMC free article] [PubMed] [Google Scholar]
- 36. Wall ME, Rachlin A, Otey CA, Loboa EG (2007) Human adipose‐derived adult stem cells upregulate palladin during osteogenesis and in response to cyclic tensile strain. Am J Physiol Cell Physiol 293: C1532–C1538 [DOI] [PubMed] [Google Scholar]
- 37. Yip CYY, Chen J‐H, Zhao R, Simmons CA (2009) Calcification by valve interstitial cells is regulated by the stiffness of the extracellular matrix. Arterioscler Thromb Vasc Biol 29: 936–942 [DOI] [PubMed] [Google Scholar]
- 38. Wang N, Tytell JD, Ingber DE (2009) Mechanotransduction at a distance: mechanically coupling the extracellular matrix with the nucleus. Nat Rev Mol Cell Biol 10: 75–82 [DOI] [PubMed] [Google Scholar]
- 39. Alam SG, Zhang Q, Prasad N, Li Y, Chamala S, Kuchibhotla R, KC B, Aggarwal V, Shrestha S, Jones AL et al (2016) The mammalian LINC complex regulates genome transcriptional responses to substrate rigidity. Sci Rep 6: 38063 [DOI] [PMC free article] [PubMed] [Google Scholar]
- 40. Turgay Y, Ungricht R, Rothballer A, Kiss A, Csucs G, Horvath P, Kutay U (2010) A classical NLS and the SUN domain contribute to the targeting of SUN2 to the inner nuclear membrane. EMBO J 29: 2262–2275 [DOI] [PMC free article] [PubMed] [Google Scholar]
- 41. Jeon EJ, Lee KY, Choi NS, Lee MH, Kim HN, Jin YH, Ryoo HM, Choi JY, Yoshida M, Nishino N et al (2006) Bone morphogenetic protein‐2 stimulates Runx2 acetylation. J Biol Chem 281: 16502–16511 [DOI] [PubMed] [Google Scholar]
- 42. Lahm A, Paolini C, Pallaoro M, Nardi MC, Jones P, Neddermann P, Sambucini S, Bottomley MJ, Lo Surdo P, Carfí A et al (2007) Unraveling the hidden catalytic activity of vertebrate class IIa histone deacetylases. Proc Natl Acad Sci USA 104: 17335–17340 [DOI] [PMC free article] [PubMed] [Google Scholar]
- 43. Arnold MA, Kim Y, Czubryt MP, Phan D, McAnally J, Qi X, Shelton JM, Richardson JA, Bassel‐Duby R, Olson EN (2007) MEF2C transcription factor controls chondrocyte hypertrophy and bone development. Dev Cell 12: 377–389 [DOI] [PubMed] [Google Scholar]
- 44. Sun Y, Byon CH, Yuan K, Chen J, Mao X, Heath JM, Javed A, Zhang K, Anderson PG, Chen Y (2012) Smooth muscle cell‐specific runx2 deficiency inhibits vascular calcification. Circ Res 111: 543–552 [DOI] [PMC free article] [PubMed] [Google Scholar]
- 45. Raaz U, Schellinger IN, Chernogubova E, Warnecke C, Kayama Y, Penov K, Hennigs JK, Salomons F, Eken S, Emrich FC et al (2015) Transcription factor Runx2 promotes aortic fibrosis and stiffness in type 2 diabetes mellitusnovelty and significance. Circ Res 117: 513–524 [DOI] [PMC free article] [PubMed] [Google Scholar]
- 46. Tyson KL, Reynolds JL, McNair R, Zhang Q, Weissberg PL, Shanahan CM (2003) Osteo/Chondrocytic transcription factors and their target genes exhibit distinct patterns of expression in human arterial calcification. Arterioscler Thromb Vasc Biol 23: 489–494 [DOI] [PubMed] [Google Scholar]
- 47. Makinistoglu MP, Karsenty G (2015) The class II histone deacetylase HDAC4 regulates cognitive, metabolic and endocrine functions through its expression in osteoblasts. Mol Metab 4: 64–69 [DOI] [PMC free article] [PubMed] [Google Scholar]
- 48. Ducy P, Desbois C, Boyce B, Pinero G, Story B, Dunstan C, Smith E, Bonadio J, Goldstein S, Gundberg C et al (1996) Increased bone formation in osteocalcin‐deficient mice. Nature 382: 448–452 [DOI] [PubMed] [Google Scholar]
- 49. Fitzsimons HL (2015) The Class IIa histone deacetylase HDAC4 and neuronal function: nuclear nuisance and cytoplasmic stalwart? Neurobiol Learn Mem 123: 149–158 [DOI] [PubMed] [Google Scholar]
- 50. Di Giorgio E, Gagliostro E, Brancolini C (2015) Selective class IIa HDAC inhibitors: myth or reality. Cell Mol Life Sci 72: 73–86 [DOI] [PMC free article] [PubMed] [Google Scholar]
- 51. Krcmery J, Camarata T, Kulisz A, Simon H‐GG (2011) Nucleocytoplasmic functions of the PDZ‐LIM protein family: new insights into organ development. BioEssays 32: 100–108 [DOI] [PMC free article] [PubMed] [Google Scholar]
- 52. Choudhary C, Kumar C, Gnad F, Nielsen ML, Rehman M, Walther TC, Olsen JV, Mann M (2009) Lysine acetylation targets protein complexes and co‐regulates major cellular functions. Science 325: 834–840 [DOI] [PubMed] [Google Scholar]
- 53. Sasagawa S, Takemori H, Uebi T, Ikegami D, Hiramatsu K, Ikegawa S, Yoshikawa H, Tsumaki N (2012) SIK3 is essential for chondrocyte hypertrophy during skeletal development in mice. Development 139: 1153–1163 [DOI] [PubMed] [Google Scholar]
- 54. Al‐Hakim AK, Göransson O, Deak M, Toth R, Campbell DG, Morrice NA, Prescott AR, Alessi DR (2005) 14‐3‐3 cooperates with LKB1 to regulate the activity and localization of QSK and SIK. J Cell Sci 118: 5661–5673 [DOI] [PubMed] [Google Scholar]
- 55. Wein MN, Liang Y, Goransson O, Sundberg TB, Wang J, Williams EA, O'Meara MJ, Govea N, Beqo B, Nishimori S et al (2016) SIKs control osteocyte responses to parathyroid hormone. Nat Commun 7: 13176 [DOI] [PMC free article] [PubMed] [Google Scholar]
- 56. Demer LL, Tintut Y (2008) Vascular calcification. Circulation 117: 2938–2948 [DOI] [PMC free article] [PubMed] [Google Scholar]
- 57. Zhu D, Mackenzie NCW, Millán JL, Farquharson C, MacRae VE (2011) The appearance and modulation of osteocyte marker expression during calcification of vascular smooth muscle cells. PLoS One 6: e19595 [DOI] [PMC free article] [PubMed] [Google Scholar]
- 58. Stephens AS, Stephens SR, Morrison NA (2011) Internal control genes for quantitative RT‐PCR expression analysis in mouse osteoblasts, osteoclasts and macrophages. BMC Res Notes 4: 410 [DOI] [PMC free article] [PubMed] [Google Scholar]
- 59. Cohen TJ, Waddell DS, Barrientos T, Lu Z, Feng G, Cox GA, Bodine SC, Yao T‐P (2007) The histone deacetylase HDAC4 connects neural activity to muscle transcriptional reprogramming. J Biol Chem 282: 33752–33759 [DOI] [PubMed] [Google Scholar]
- 60. Kehat I, Accornero F, Aronow BJ, Molkentin JD (2011) Modulation of chromatin position and gene expression by HDAC4 interaction with nucleoporins. J Cell Biol 193: 21–29 [DOI] [PMC free article] [PubMed] [Google Scholar]
Associated Data
This section collects any data citations, data availability statements, or supplementary materials included in this article.
Supplementary Materials
Expanded View Figures PDF
Source Data for Expanded View
Review Process File
Source Data for Figure 1
Source Data for Figure 6
Source Data for Figure 7


