

Abstract
F‐ATP synthases convert the electrochemical energy of the H+ gradient into the chemical energy of ATP with remarkable efficiency. Mitochondrial F‐ATP synthases can also undergo a Ca2+‐dependent transformation to form channels with properties matching those of the permeability transition pore (PTP), a key player in cell death. The Ca2+ binding site and the mechanism(s) through which Ca2+ can transform the energy‐conserving enzyme into a dissipative structure promoting cell death remain unknown. Through in vitro, in vivo and in silico studies we (i) pinpoint the “Ca2+‐trigger site” of the PTP to the catalytic site of the F‐ATP synthase β subunit and (ii) define a conformational change that propagates from the catalytic site through OSCP and the lateral stalk to the inner membrane. T163S mutants of the β subunit, which show a selective decrease in Ca2+‐ATP hydrolysis, confer resistance to Ca2+‐induced, PTP‐dependent death in cells and developing zebrafish embryos. These findings are a major advance in the molecular definition of the transition of F‐ATP synthase to a channel and of its role in cell death.
Keywords: ATP synthase, calcium, channels, mitochondria, permeability transition
Subject Categories: Autophagy & Cell Death, Membrane & Intracellular Transport
Introduction
F‐ATP synthases convert the energy of the H+ gradient into ATP with a remarkable efficiency 1, a process that is made possible by the very low permeability of the inner membrane to H+ and charged species 2. However, mitochondria can undergo a Ca2+‐dependent permeability increase that has detrimental consequences on energy conservation. This event was recognized very early and its key functional characteristics mostly established in the 1970s 3. Hunter and Haworth defined the permeability change as a “permeability transition” (PT) and proposed that it was due to opening of a regulated channel 4 whose role(s) and molecular nature have been a long‐standing mystery. It is now widely accepted that PTP opening may result in depolarization, cessation of ATP synthesis, and mitochondrial swelling with release of proapoptotic molecules from the intermembrane space 3 and that PTP‐dependent cell death may be particularly relevant for ischemia–reperfusion injury, muscular dystrophies, and neurodegenerative diseases 3. Brief PTP openings may also allow rapid Ca2+ release from the mitochondrial matrix and play a role in mitochondrial Ca2+ homeostasis 5, a more controversial issue that is now strongly supported by direct measurements in cardiac myocytes 6. Concerning the molecular nature, each of the proposed PTP constituents (adenine nucleotide translocase, voltage‐dependent anion channel, Pi carrier, and peripheral benzodiazepine receptor) was ruled out by targeted gene deletion 7, 8, 9, 10, 11. The PT is affected by the adenine nucleotide translocase isoform 1 12 through an effect on voltage sensing 13 and by the outer membrane through an undefined mechanism 14. The best characterized protein involved in the PT, however, is cyclophilin D (CyPD), a modulator rather than a structural component as revealed by analysis of CyPD‐null mitochondria 15, 16, 17, 18.
In order to identify possible PTP components, we searched for interactors of CyPD and showed that it binds the peripheral stalk of F‐ATP synthase resulting in partial inhibition of the enzyme 19. CyPD could be displaced by cyclosporin A (CsA), a known inhibitor of the PTP 3. This finding led to the paradigm‐shifting discovery that F‐ATP synthase forms channels 20 with the properties expected of the PTP (also called mitochondrial megachannel, MMC) 21. The channel‐forming properties of F‐ATP synthases, and their match to the corresponding PTPs, have been also established in yeast and Drosophila 22, 23 and are supported by independent studies by other laboratories 24, 25 although there is no agreement on the mechanism of pore formation (see 3 for discussion).
Matrix Ca2+ is a key factor for opening of the PTP, which is modulated by a large number of inducers (such as Pi and oxidants) and inhibitors (such as H+, adenine nucleotides, and Mg2+) 3. Interestingly, inhibition of the Ca2+‐activated PTP by Mg2+ and other divalent metal ions (Me2+) such as Sr2+, Mn2+, and Ba2+ is competitive, indicating that Me2+ shares a common binding site(s) 26, 27. We have proposed that Ca2+ binding induces a conformational change of F‐ATP synthase dimers that leads to channel formation in their inner membrane sector 20. Identification of the Ca2+ binding site(s) and of the mechanism of channel formation would represent essential steps forward in the dissection of the structural events that lead to the PT. Potential Ca2+ binding sites have been identified in F‐ATP synthase. One is localized in the e subunit 28 and faces the intermembrane space, a location that makes it an implausible candidate for the activating site of the PTP, which is in the matrix 3. A second site could be the c ring, which binds Ca2+ in plants and in Synechocystis 6803 29, 30. Subunits c purified from the plasma membrane of bovine neurons can oligomerize and form cationic channels, yet Ca2+ results in their inhibition rather than activation 31 which is the opposite of what observed for the PTP. Furthermore, atomistic simulations indicate that the lumen of the c ring cannot be occupied by water, which is a prerequisite for ion conductivity 32; and the PT still occurs with unaltered features in the absence of subunit c 33. A third possibility is Ca2+ binding to the catalytic site.
The F1 catalytic part of F‐ATP synthases is composed by a hexamer of 3α and 3β subunits surrounding the γ subunit, which together with subunits δ and ε forms the central rotor shaft 34. H+ movement through the c ring/a subunit complex of the FO sector in the inner membrane is coupled with rotation of the γ subunit 35, and co‐rotation of the F1 sector with the c ring is prevented by the peripheral stalk, which comprises the OSCP, b, d, and F6 subunits (see 36 for the structure of a complete, dimeric F‐ATP synthase from Yarrowia lipolytica). Located on top of the catalytic F1 sector 36, 37, OSCP makes stable contacts with both F1 and the peripheral stalk, ensuring the coupling of H+ flux to ATP synthesis 38. Due to this structural arrangement, rotation of the γ subunit causes conformational changes in the 3 nucleotide binding pockets that catalyze the synthesis of ATP 39. During catalysis, one of the nucleotide binding pockets contains a molecule of ATP in complex with Mg2+, one contains ADP‐Mg2+ plus a molecule of Pi, and the third is empty 40. The nucleotide binding pocket is exposed to the matrix in the αβ cleft with the majority of coordinating residues contributed by the β subunit 40. The coordinating Mg2+ in the catalytic site can be replaced by other Me2+ 41, 42. Binding of Ca2+ has major functional consequences, as Ca2+‐ATP hydrolysis does occur, yet there is no buildup of the H+ gradient 43. Thus, Ca2+ causes a conformational change in the enzyme complex that impairs energy conservation.
Intriguingly, in the proteobacterium Rhodospirillum rubrum it has been possible to modulate the relative affinity for Ca2+ and Mg2+ of F‐ATP synthase with a T159S mutation at the β subunit, which decreased Ca2+‐ATPase and increased Mg2+‐ATPase activity 44, 45. This same threonine residue (T163 in the bovine sequence) was also shown to play a key role in coordinating Mg2+ in the catalytic site of the bovine enzyme during ATP hydrolysis 40, suggesting that it might affect the relative affinity for Me2+ in the mammalian β subunit as well. Here, we have explored the consequences of a T163S mutation on the F‐ATP synthase β subunit on enzyme activity and PTP formation in mammalian cells and developing zebrafish embryos. Molecular dynamics (MD) simulations of the wild‐type and mutant enzyme complexed to Mg2+ and Ca2+ provided insight into how Ca2+ binding could induce a conformational change transmitted to the lateral stalk, and potentially lead to PTP opening within the inner membrane.
Results and Discussion
β subunit T163S mutation affects Ca2+‐ and Mg2+‐ATP hydrolysis and the PTP in HeLa cells
To explore the effect of the β subunit T163S mutation on F‐ATPase and PTP activities in mammals, we generated the T163S substitution in HeLa cells by suppressing the endogenous β subunit transcript with shRNA targeted against ATP5B while reexpressing shRNA‐resistant wild‐type or mutant ATP5B cDNAs (Fig EV1). Two days after co‐transfection, expression of F‐ATP synthase subunits α, β, c, OSCP, and IF1 was identical in cells expressing wild‐type and T163S β subunits (Fig EV1). In the wild‐type enzyme, the rate of hydrolysis of Ca2+‐ATP was less than half of that of Mg2+‐ATP, while in the T163S mutant Mg2+‐ATP hydrolysis increased and Ca2+‐ATP hydrolysis was nearly completely prevented compared with cells reexpressing the wild‐type sequence (Fig 1A). These results match those obtained in Rhodospirillum rubrum 44, 45 and suggest that the β subunit bearing the T163S mutation had been incorporated in the F‐ATP synthase complex. By qPCR analysis, we found that mRNA levels of the rescued shRNA‐resistant β sequences were approximately one‐third of the total (WT: 26.6 ± 5.1%, n = 24; mutant: 36.2 ± 4.8%, n = 20, ± s.e.m.). Assuming that the mutant β subunits are distributed randomly, these findings suggest that one mutant copy per assembled complex is sufficient to affect F‐ATP synthase catalysis. The mutation did not affect oligomycin‐sensitive and uncoupler‐stimulated respiration in situ (Fig 1B). This result is expected because the matrix Mg2+/Ca2+ ratio is high and the mutant is fully functional in the presence of Mg2+ (Fig 1A). We would like to mention that silencing of β subunit without reexpression of shRNA‐resistant sequences caused cell lethality (results not shown).
Figure EV1. Strategy followed in transient co‐transfection of HeLa cells: silencing of endogenous β subunit of F‐ATP synthase and rescue with wild‐type or T163S mutated sequences.
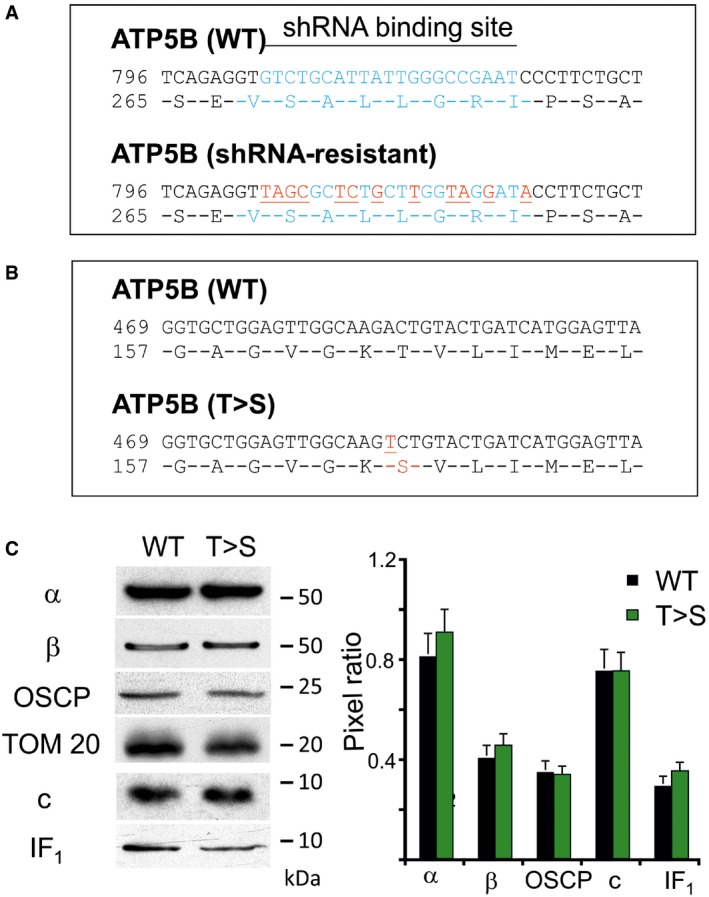
- HeLa cells were transfected with shRNA directed to the nucleotide sequence represented in light blue of endogenous β subunit of F‐ATP synthase (ATP5B WT). To rescue β subunit expression, HeLa cells were simultaneously transfected with shRNA and with ATP5B harboring silent mutations (red) in the shRNA targeted region (ATP5B shRNA‐resistant) in order to avoid its degradation. The corresponding amino acid sequence (ATP5B shRNA‐resistant) is identical to that of the wild‐type (WT) nucleotide sequence (ATP5B WT).
- Two different species of shRNA‐resistant β sequences were used to rescue β subunit in HeLa cells: shRNA‐resistant ATP5B (WT) which generates an amino acid sequence that does not differ from that of the endogenous β subunit and shRNA‐resistant ATP5B (T>S) that generates a β subunit with a point mutation (in red) that causes the T163S substitution.
- The effect of silencing and reexpression of WT or T>S mutant ATP5B on expression of F‐ATP synthase subunits and of its inhibitory protein IF1 was assessed by Western blotting. TOM20 was included as a loading control. Molecular size is indicated on the right. The bar graph shows the ratio (± s.e., three independent experiments) between the quantified bands corresponding to F‐ATP synthase subunits and TOM20 in WT or T>S mutants.
Figure 1. Mutation of T163 of the F‐ATP synthase subunit β to serine affects Ca2+‐ and Mg2+‐ATP hydrolysis and desensitizes the PTP to Ca2+ .
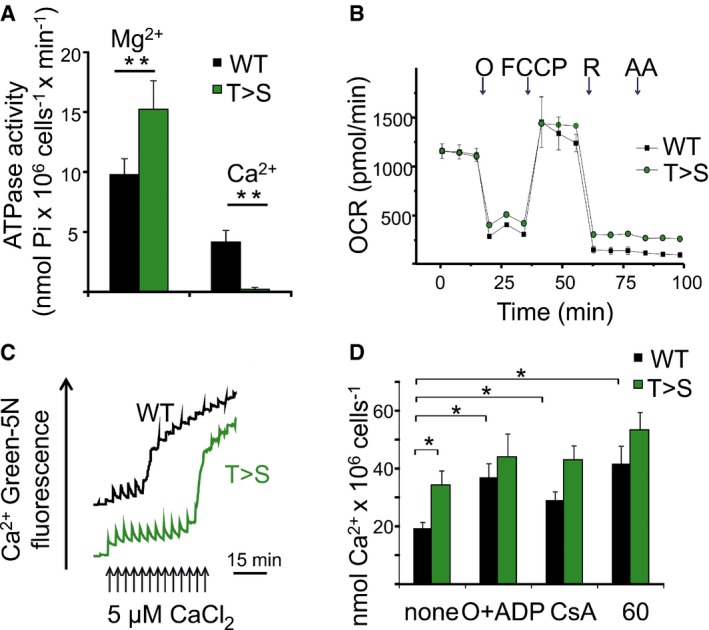
- The rate of ATP hydrolysis was monitored in permeabilized HeLa cells expressing WT or T163S (T>S) β subunit 48 h after transfection in the presence of either Mg2+ or Ca2+. ATPase activity was measured as Pi release per minute per 106 cells at 25°C by complexation with molybdate reagent in the presence of 10 μM decavanadate and ouabain. Data are mean of 6 (Mg2+) or 7 (Ca2+) experiments (run in triplicate) ± s.e. **P = 0.005 or P = 0.002 for Mg‐ATP or Ca‐ATP hydrolysis, respectively calculated with the Student's t‐test.
- Respiration was assessed in intact HeLa cells expressing WT (WT) or mutant (T>S) β subunit using a Seahorse extracellular flux analyzer. Cells were seeded at 5 × 10⁴ cells/well. Where indicated (arrows), 1 μg/ml oligomycin (O), 0.2 μM carbonylcyanide‐p‐trifluoromethoxyphenyl hydrazone (FCCP) (F), 1 μM rotenone (R), and 1 μM antimycin A (AA) were added. Data are mean of seven replicates ± s.d. and expressed in pmol oxygen/minute.
- Ca2+ retention capacity (CRC) was assessed in permeabilized HeLa cells expressing WT or T163S (T>S) β subunit in a buffer containing respiratory substrates (see Materials and Methods), 1 mM Mg2+ and the membrane‐impermeant Ca2+ sensor Ca2+ Green‐5N. Ca2+ Green‐5N fluorescence was monitored following repeated additions of Ca2+ (arrows). Initial fluorescence was identical, but the traces were vertically offset for clarity. One experiment representative of 7 is shown.
- CRC per 106 cells was quantified for WT (black bars) and T>S cells (gray bars) under basal conditions (as in C) or in the presence of 1 μg/ml oligomycin plus 0.5 mM ADP (O + ADP), 3.2 μM cyclosporin A (CsA), or 5 μM compound 60. Data are average ± s.e. of 7 (none), 5 (O + ADP and CsA), or 3 (compound 60) experiments *P ≤ 0.05 calculated with the Student's t‐test.
Permeability transition pore sensitivity to Ca2+ was assessed next with the Ca2+ retention capacity (CRC) assay, that is, the determination of the Ca2+ load required to cause PTP opening 46. Cells were permeabilized with digitonin and subjected to a train of Ca2+ pulses, which were taken up by energized mitochondria until a threshold matrix Ca2+ load was reached resulting in PTP opening and Ca2+ release (Fig 1C). Remarkably, mitochondria expressing the T163S β subunit accumulated twice the amount of Ca2+ required to open the PTP in their wild‐type counterparts (Fig 1C), indicating that the T163S mutation decreases the Ca2+ sensitivity of the PTP. Note that before onset of the PT the rate of Ca2+ uptake was not altered, as the time required to regain the basal [Ca2+] after each Ca2+ pulse was the same. The CRC of both wild‐type and T163S mutants could be increased by ADP, CsA and compound 60, a novel diarylisoxazole‐3‐carboxamide PTP inhibitor 47. The efficacy of inhibitors was apparently lower in the already desensitized T163S mutant mitochondria (Fig 1D). Taken together, the data presented so far indicate that the T163S mutation on the β subunit affects Ca2+‐dependent PTP opening, suggesting that Ca2+ binding to the Me2+/nucleotide catalytic site of F‐ATP synthase is responsible for channel formation. How Ca2+ binding to the catalytic site can cause structural rearrangements leading to PTP opening was investigated next through MD simulations of the F1 catalytic domain‐OSCP complex.
Molecular dynamics reveals specific conformational changes in F‐ATP synthase upon Ca2+‐ATP or Mg2+‐ATP binding to the catalytic site
Under physiological conditions, the Me2+ binding site is contributed by both the α and β chains. A comparison of wild‐type F1 catalytic domain in the presence of either Mg2+ or Ca2+ was performed. The systems were equilibrated and simulated for 50 ns in explicit water. The results show that with Ca2+ the average distance between cation and coordinating amino acids increased due to its larger van der Waals radius compared to Mg2+ (Fig EV2A). Binding of ATP to a second, non‐catalytic site on the α subunit indirectly affects catalysis 48. One ATP was therefore positioned inside each non‐catalytic site of subunit α at the F1‐OSCP complex as found in the most recent crystal structure 36. The catalytic site ligands were then modeled to reflect the three physiological conformations (empty, ADP‐ and ATP‐bound; Fig 2A, ATP bound to the α subunits is not shown for clarity). The domains of the β subunit (crown region, catalytic site, and their connecting loop), which will be important to interpret the results of the simulation, are highlighted in Fig 2B.
Figure EV2. Molecular dynamics simulation of wild‐type and T163S β mutant F‐ATP synthase with Mg2+ and Ca2+ bound to the catalytic site.
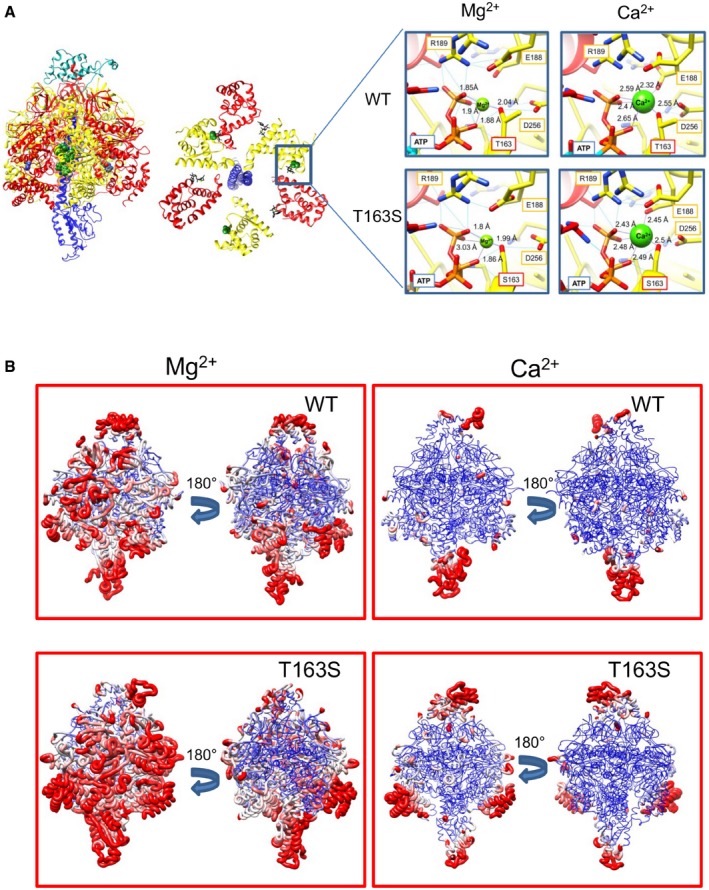
- Lateral and top view of F1; location of β T163 is marked by green spheres. Red, α subunits; yellow, β subunits; blue, γ subunit; turquoise, OSCP (lateral view only). The enlargement shows Mg2+ and Ca2+ bound to the Me2+ sites and their coordination distances. Hydrogen bonds and ion contacts are shown in blue and purple, respectively, with the distance between ion and coordinating atoms in Å.
- F1‐OSCP backbone with coloring and thickness representing RMSF. Blue and red denote residues with RMSF ≤ 4 Å and ≥ 5.5 Å, respectively. The same RMSF range is used to draw backbone thickness. Rotation is along the y‐axis.
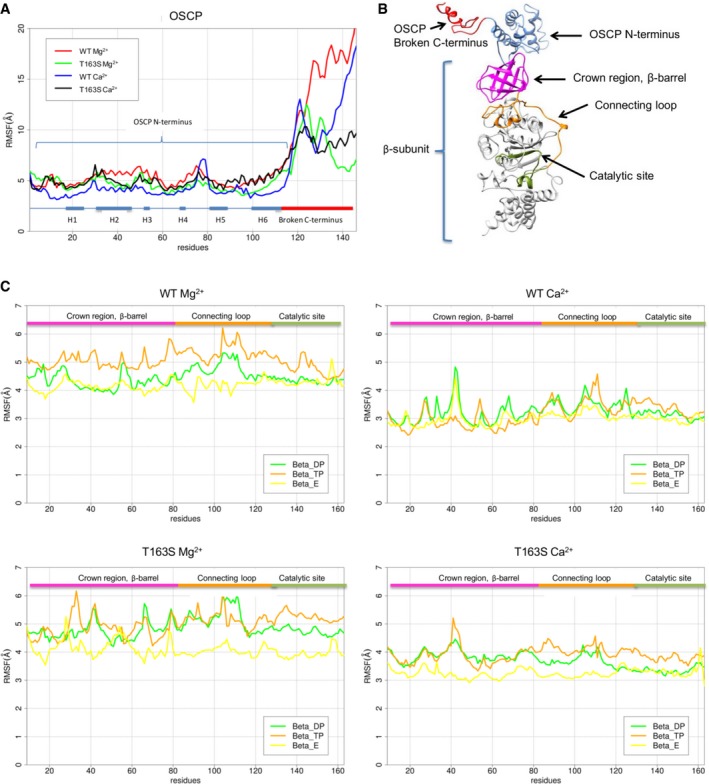
Figure 2. Structural overview of the extrinsic domain of F‐ATP synthase and its catalytic Me2+ adenine nucleotide binding site.
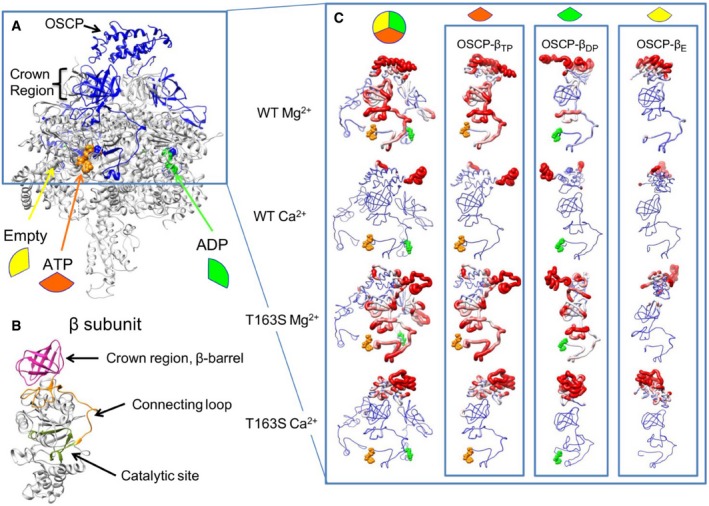
- F‐ATP synthase extrinsic domain highlighting the relative position of OSCP and the β subunits in the empty, ATP‐ and ADP‐bound states.
- Structure of the β subunit, highlighting its domains.
- The enlargement to the right shows a front view of wild‐type (WT) and T163S mutant with Mg2+ and Ca2+. The first column shows a structural superposition of all β subunits, while the next three columns show front views of individual β subunits in the ATP‐bound (TP, orange wedge), ADP‐bound (DP, green wedge), or empty (E, yellow wedge) state. Backbone coloring and thickness are proportional to the root mean square fluctuation (RMSF) value calculated for each residue. Blue is used for residues with RMSF ≤ 4 Å and red ≥ 5.5 Å. The same RMSF range was used to draw backbone thickness. Notice the increased rigidity of the Ca2+‐containing structures.
Analysis of 50‐ns simulation trajectories for the wild‐type in the presence of Mg2+ suggests a motion starting from the catalytic sites and transmitted through the long connecting loop (subunit β 82–131) to the crown region, that is, the β‐barrel‐shaped “ring” at the F1/OSCP binding interface 49 (Fig 2C, WT Mg2+ and Fig EV2B). The partial OSCP chain remains firmly anchored to F1 with its C‐terminal tail (residues 112–146) freely fluctuating through the simulation box. Trajectory inspection in the presence of Ca2+ reveals that the system is significantly more rigid (Figs EV3 and EV4). The connecting loop and the crown region were particularly static while OSCP was the chain fluctuating most (average RMSF 7.27 Å and 5.56 Å for wild‐type system with Mg2+ and Ca2+, respectively) with peaks consistently including helices H2 and H3 (26–55) and the loop between helices H4 and H5 (74–80) (Fig 2C, WT Ca2+ and Figs EV2B and EV4A). Thus, the larger van der Waals radius of Ca2+ appears to induce spatial rearrangements increasing overall F1 rigidity. This decreased compliance of F‐ATP synthase might transmit mechanical energy to OSCP, which in the native enzyme could then be transferred to the inner membrane (where the PTP forms) through the lateral stalk 36, 50. Consistent with this possibility, combined conformational changes of the peripheral stalk at OSCP/F6 and b subunit at its point of entrance into the membrane have been observed 50.
Figure EV3. Root mean square deviation of coordinates for non‐hydrogen atoms as a function of simulation time.
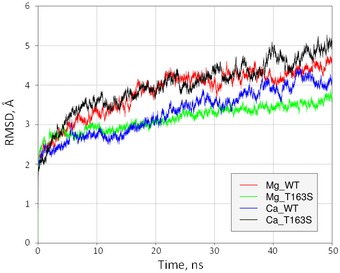
Calculation was performed during 50 ns of molecular dynamics simulation. The x‐axis represents the simulation time (ns) and the y‐axis the backbone movement (Å).
Figure EV4. Root mean square fluctuations of OSCP 1–146 and β subunit region 9–163.
- The plot shows the RMSF values of OSCP interacting with wild‐type (WT) and T>S mutant β subunits binding Mg2+ and Ca2+. Rectangles below the graphs indicate the position of the α helices (H) of OSCP and the C‐terminal region.
- Structure of subunit β and OSCP.
- The plots show the RMSF values of wild‐type (WT) and T>S mutant of subunit β region 9–163 binding Mg2+ and Ca2+.
We next performed simulations on the F1‐OSCP complex bearing the β T163S mutation. In the presence of Mg2+, the motility decreased in the β 82–131 loop and crown region in the TP conformation, while the motility increased in the DP conformation (Fig 2C, T163S Mg2+; Figs EV2B and EV4C, T163S Mg2+). Consistent with the biochemical results (increased Mg2+‐ATPase activity), we found that the mutation affects the catalytic site, with increased distance of β side chains F418, F424, and Y345 from ADP and decreased surface contact with the adenosine ring. A smaller effect was observed for the ATP binding site, suggesting that the T163S mutation favors ADP release during hydrolysis. Simulations of the T163S mutant with Ca2+ confirmed the overall increased rigidity of the enzyme complex, with fluctuations limited to the β chain connecting loop segment N96‐E112 and to the crown region Q39‐R44. Remarkably, however, OSCP displayed large fluctuations with average RMSF comparable to those observed for the wild‐type protein in the presence of Mg2+ (Fig 2C, T163S Mg2+ and Figs EV2B and EV4A). The T163S mutation therefore appears to prevent the Ca2+‐dependent conformational events that, through the connecting loop and the crown region, affect OSCP motility in the wild‐type β subunit. These findings may explain the increased resistance to PTP opening of the mutants.
β subunit T163S mutation protects from Ca2+‐dependent mitochondrial depolarization and from PTP‐dependent cell death in HeLa cells
We next tested the prediction that the T163S β mutation should have a protective effect against Ca2+‐dependent depolarization and cell death in established Ca2+‐ and PTP‐dependent paradigms 51, 52. Cells were incubated in Hank's balanced salt solution (HBSS) supplemented with 1 mM Ca2+, and intracellular Ca2+ and mitochondrial membrane potential monitored with Fluo‐4FF‐AM and tetramethylrhodamine methyl ester (TMRM), respectively. Staining with TMRM did not reveal major differences in mitochondrial morphology and extension of the mitochondrial network (Fig 3A, upper panels). Upon addition of 2 μM ionomycin, intracellular [Ca2+] increased rapidly in both wild‐type and T>S mutant cells, while after a lag phase mitochondria depolarized in wild‐type cell only (Fig 3A, lower panels). The PTP‐inducing effects of Ca2+ ionophores are extremely well documented 51, 52, and these results are thus consistent with resistance to PTP opening of the mutant cells. Treatment with ionomycin caused activation of caspase‐3 only in wild‐type HeLa cells (Fig 3B). A time course was performed on cells detached with trypsin and then treated with ionomycin, which demonstrated a large difference in the number of dead cells that increased over the 40‐min time frame of the experiment (Fig 3C). FACS analysis defined cell death as largely apoptotic, with a majority of Annexin‐V‐positive (aV+) and double aV+ propidium iodide‐positive (PI+) cells in the wild‐type set and a decreased number of dead cells in the T163S β mutants (Fig 3D). We next used arachidonic acid, which both increases cytosolic Ca2+ and sensitizes the PTP to opening 52. In this paradigm, both apoptosis and necrosis were detected (as shown by the presence of aV+, PI+, and aV+PI+ cells), and a remarkable protection was observed in the T163S β mutant cells (Fig 3E). We offer two explanations for the residual cell death observed in the T163S β mutant cells. First, treatment with ionomycin and arachidonic acid is known to also activate Ca2+‐dependent effector pathways that do not critically depend on the PTP, such as calpains and endonucleases 53. Second, mitochondria expressing the T163S β mutant displayed an increased CRC (i.e., increased resistance to Ca2+), yet they still eventually opened the PTP at higher Ca2+ loads (Fig 1C and D).
Figure 3. T163S β subunit mutation protects against cell death caused by ionomycin and arachidonic acid in HeLa cells.
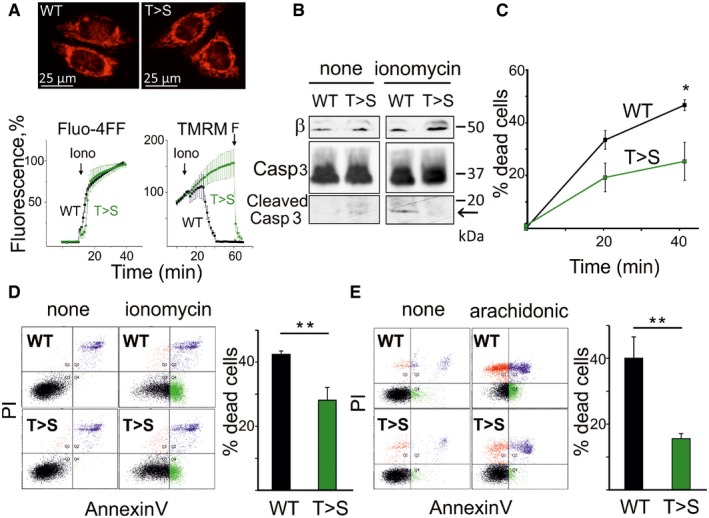
- Adherent cells expressing WT or T163S (T>S) β subunit were incubated in HBSS containing 1 mM Ca2+ after loading with either Fluo4‐FF or TMRM. Upper panels show images of cells stained with TMRM. In the lower panels, Ca2+(Fluo‐4FF) or mitochondrial membrane potential (TMRM) was monitored. Where indicated, 2 μM ionomycin (Iono) and 5 μM FCCP (F) were added. Fluorescence is expressed as % of the value reached after the addition of 5 μM digitonin (Fluo‐4FF) or of the value at the moment of ionomycin addition (TMRM). In the lower panels, one representative experiment of 3 ± s.d. is reported.
- Adherent cells expressing WT or T163S (T>S) β subunit were treated for 2 h with 2 μM ionomycin and lysates evaluated by Western blotting for β subunit (β) and caspase (Casp) 3 (the cleaved form is indicated by an arrow). Molecular size is indicated on the right.
- Detached WT and (T>S) β‐expressing cells were treated with 2 μM ionomycin for up to 40 min in the presence of 0.6% (v/v) FLUOS‐conjugated Annexin‐V and 2 μM propidium iodide (PI) and cell death was assessed by flow cytometry. Percentage of dead cells was assessed by FACS at 0, 20, and 40 min of ionomycin treatment. Data are mean of three independent experiment ± s.e. *P = 0.044, Student's t‐test.
- A representative experiment of cells treated as in (C) and monitored by FACS is presented showing healthy (black), PI‐positive (red), Annexin‐V‐positive (green), and PI + Annexin‐V‐positive (blue) cells after 40 min of treatment. Dead cell percentage is shown on the right, mean of six independent experiments ± s.e. **P = 0.0050, Student's t‐test.
- Cell death was monitored by FACS analysis in detached cells treated with 200 μM arachidonic acid for 2 h in a medium containing Annexin‐V and PI. Data on the right are mean of six independent experiments ± s.e. **P = 0.0038, Student's t‐test.
β subunit T163S mutation affects apoptosis in developing zebrafish embryos
Apoptosis is crucial during embryonic development in Danio rerio (zebrafish) 54. It has been shown that the mitochondrial apoptosis accelerator Bcl‐wav controls blastomere positioning through modulation of mitochondrial Ca2+ uptake via the Ca2+ uniporter, MCU 55. Interestingly, the functional features of mitochondrial Ca2+ transport and of the PTP of zebrafish are identical to those of mammals 56, but whether the PTP is involved in apoptosis has not been previously assessed. Given the clear phenotypic effect of the T163S β subunit mutation on apoptosis in vitro, which we could reasonably attribute to decreased propensity to Ca2+‐dependent PTP opening, and given the potential role of the PTP in physiological mitochondrial Ca2+ release 3, we overexpressed the human wild‐type or T163S mutant β subunit in zebrafish embryos. We first tested the expression and cellular localization of the human β subunit fused to GFP at 48 h postfertilization (hpf). The protein colocalized with mitochondrially targeted RFP (Fig 4A, upper panels) while GFP without a mitochondrial targeting sequence appeared diffuse and did not merge with mitochondrially targeted RFP (Fig 4A, lower panels). Pearson correlation coefficients (measured on images from 15 embryos per condition chosen at random) were 0.885 ± 0.013 for the β subunit‐GFP fusion protein (which indicates a high degree of overlapping) and 0.008 ± 0.002 for GFP (which indicates no overlapping). We then overexpressed human wild‐type or T163S β subunits. At 48 hpf, the expression of T163S subunit caused a curly tail phenotype (which was also observed by treatment of the wild‐type with the pan‐caspase inhibitor z‐VAD‐fmk, Fig 4B) and decreased skin pigmentation (β T>S) while embryos injected with wild‐type β subunit appeared normal (Fig 4B, arrow). Whole‐mount immunofluorescence (Fig 4C) indicates that the expected replacement of the endogenous β subunits took place to a similar extent for the wild‐type and T163S mutant species. In both cases, β subunits co‐localized with mitochondrial TOM20 (Fig 4C) with Pearson correlation coefficients (measured on images from six embryos per condition chosen at random) of 0.738 ± 0.026 and 0.749 ± 0.042 for wild‐type and T163S, respectively (which indicates a good overlapping). The expression of the constructs did not alter the level of α subunits (Fig 4D). To understand whether the morphological changes caused by the T163S β mutation were due to alterations in apoptosis, we studied cell death in embryos injected with the two constructs for β subunit (Fig 4E and F). Large numbers of apoptotic nuclei were observed in developing zebrafish embryos by TUNEL staining 57. Compared to the wild‐type, expression of human T163S β subunit caused a decrease in apoptotic nuclei at 48 hpf in the head, tail, trunk, and yolk (Fig 4E and F). This finding strongly suggests that the T163S mutation, which we have shown to modulate the Ca2+ sensitivity of the PTP, can be crucial for modulation of cell death in zebrafish embryogenesis.
Figure 4. Human wild‐type or T163S β subunits localize to mitochondria affecting both developmental morphology and apoptosis of zebrafish embryos.
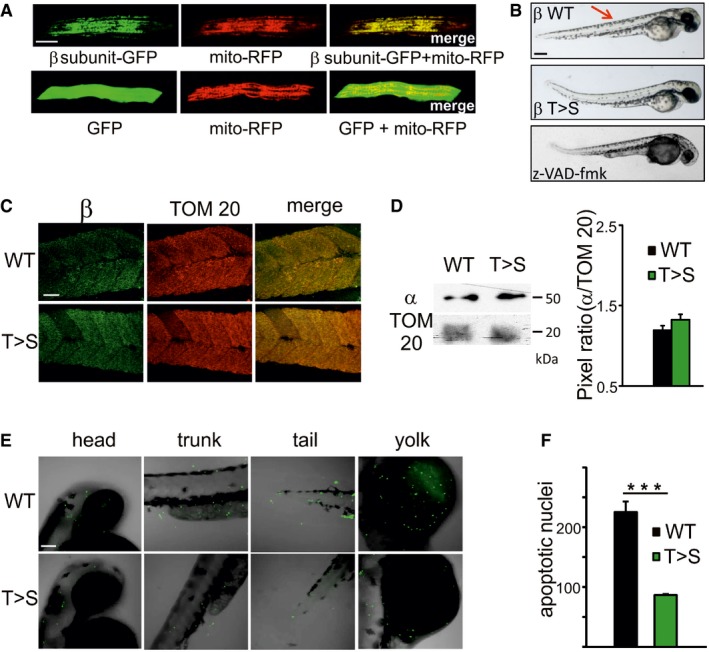
- Localization of β subunit within mitochondria of embryos muscle fibers was assessed. Fertilized eggs were co‐injected at the one‐cell stage with 15 ng/μl Ptag‐mito‐RFP to label mitochondria (mito‐RFP) and 35 ng/μl GFP‐tagged human ATP5B construct (β subunit‐GFP) or empty pEGFP‐N1 plasmid (GFP). Localization of proteins was monitored by confocal microscopy (full Z‐stack, 100× objective) at 48 hpf. Scale bar, 100 μm. One representative experiment of three is shown, and 75 fertilized eggs per condition were injected in each experiment.
- Fertilized eggs were injected at the one‐cell stage with 35 ng/μl of pcDNA3.1 plasmid containing either human WT (β WT) or T163S (β T>S) β sequence. The phenotype of uninjected embryos treated with 100 μM of the pan‐caspase inhibitor z‐VAD‐fmk at 24 hpf is also shown. Morphological effects were assessed at 48 hpf. Scale bar, 50 μm. The arrow indicates skin pigmentation. Embryos representative of 5 (WT and T>S) or 3 (z‐VAD‐fmk) experiments are shown. Thirty fertilized eggs were used for each condition in each experiment.
- Fertilized eggs were injected as in (B). Confocal analysis (full Z‐stack, 40× objective) was performed after whole‐mount immunostaining with β subunit and TOM20 antibodies in 48‐hpf embryos. Scale bar, 100 μm. One representative experiment of 3 is shown. Fifteen fertilized eggs per condition were injected in each experiment.
- Embryo lysates (48 hpf, injected as in B) were analyzed by Western blotting with antibodies against α subunit of ATP synthase and TOM20 as a mitochondrial marker (one representative experiment of 3 is shown). Molecular size is indicated on the right. Band intensities for the α subunit normalized to TOM20 are shown for WT or T>S mutants. The pixel ratio was obtained from three experiments ± s.e.
- Cell apoptosis was evaluated in embryos (48 hpf) expressing WT or T163S (T>S) human β sequence by using TUNEL assay. Representative full Z‐stack images (40× objective) of head, tail, trunk, and yolk from zebrafish embryos are shown. Apoptotic nuclei were visualized in green, while zebrafish embryos were visualized in bright‐field. Scale bar, 100 μm. One representative experiment of 3 is shown.
- The number of total apoptotic nuclei in entire embryos was counted. Data are mean ± s.e. of three independent experiments (15 embryos per condition were used in each experiment). ***P < 0.005 by one‐way ANOVA with Bonferroni correction.
In summary, we have shown that the T163S mutation in the human F‐ATP synthase β subunit (i) affects the catalytic activity with a decrease in Ca2+‐dependent and an increase in Mg2+‐dependent ATP hydrolysis and (ii) desensitizes the PTP to Ca2+, resulting in increased resistance to Ca2+‐dependent mitochondrial depolarization and to cell death in in vitro paradigms as well as in developing zebrafish embryos. A critical role of OSCP in PTP modulation is emerging. CyPD and benzodiazepine 423 affect the PTP by binding to the same site on OSCP 20; and acetylation of OSCP residue K70 promotes its interaction with CyPD and sensitizes the PTP to opening 58. These findings indicate that changes of OSCP conformation can affect the propensity of PTP channel formation in the inner membrane, which is more than 100 Å away. Although they cannot predict whether F‐ATP synthase dimers are required for PTP formation 20, our MD simulations provide a potential mechanism through which the Ca2+‐dependent effect on the catalytic sites is transmitted via OSCP to the peripheral stalk and thence to the inner membrane, a testable hypothesis for future studies.
Materials and Methods
Reagents and cells
Oligomycin, rotenone, antimycin A, pyruvate, carbonylcyanide‐p‐trifluoromethoxyphenyl hydrazone (FCCP), ATP, ADP, EDTA, EGTA, digitonin, ionomycin, arachidonic acid, propidium iodide (PI), and protease inhibitors were from Sigma (Milan, Italy). Annexin‐V‐FLUOS (Annexin‐V) was from Roche Life Science. CsA was purchased from Calbiochem. Ca2+ Green‐5N was from Invitrogen (Milan, Italy). HeLa cells were obtained from the American Tissue Culture Collection (ATCC) and cultured in Dulbecco's modified Eagle's medium (DMEM; Lonza, Basel, Switzerland) supplemented with fetal calf serum (10%), glutamine (4 mM), and penicillin and streptomycin (Thermo Fisher Scientific, Waltham, MA, USA). Cells were transfected using a CaPO4 protocol (see below) 48 h prior to each experiment. Cells were free of contamination with mycoplasma.
Cloning and constructs
WT human ATP5B (GenBank NM_001686) was cloned from HeLa cell mRNA by reverse transcription‐PCR and inserted into pcDNA3.1(+) (Invitrogen) using the restriction enzymes HindIII and XhoI (pcDNA3.1‐huATP5Bwt). The T163S mutation (pcDNA3.1‐huATP5B T163S) was generated by site‐directed mutagenesis using a mutagenic primer (see Table EV1) followed by degradation of the original DNA by DpnI (New England Biolabs, Ipswich, MA, USA). To generate C‐terminally GFP‐tagged ATP5B (pEGFP‐N1‐huATP5Bwt), ATP5B lacking the stop codon was cloned from HeLa cells and inserted into pEGFP‐N1 (Clontech, Mountain View, CA, USA) upstream of the GFP tag using HindIII and AgeI. Where WT or mutant ATP5B was co‐expressed with shRNA to silence expression of the endogenous sequence, silent mutations were introduced into the shRNA recognition sequences of the WT or mutant ATP5B by single step fusion PCR, then the shRNA‐resistant cDNA sequences were ligated into HindIII/XhoI‐digested pcDNA3.1 as before. A full list of primer sequences can be found in Table EV1. ATP5B shRNA and its corresponding control vector, pLKO.1, were purchased from Sigma (sequence TRCN0000043436).
RNA extraction, reverse transcription, and quantitative real‐time PCR
RNA was extracted using the SV Total RNA Isolation Kit (Promega, Madison, WI, USA) following manufacturer's instructions. Complementary DNA was generated with a cDNA synthesis kit (SuperScript II, Invitrogen) and analyzed by qPCR (Bio‐Rad, Segrate, Italy). Actin (ACT) and β‐tubulin (TUB) were used as housekeeping genes. The primers for mRNA of total β subunit (ATP5B endogenous qPCR) or silent mutation‐harboring shRNA‐resistant β subunit (ATP5B silent mutation qPCR) are reported in Table EV1.
Ca2+ phosphate transfection of HeLa cells
HeLa cells were either co‐transfected with (i) shRNA targeting endogenous ATP5B and pcDNA3.1 containing shRNA‐resistant WT ATP5B; (ii) shRNA targeting endogenous ATP5B and pcDNA3.1 containing shRNA‐resistant T163S mutant ATP5B; or (iii) the empty vector control for the shRNA, pLKO.1, and the empty vector control for the cDNA, pcDNA3.1. To estimate transfection efficiency, cells were co‐transfected with empty pEGFP‐N1 vector and pLKO.1. Briefly, 10 μg DNA (5 μg shRNA or control vector plus 5 μg cDNA or control vector) was diluted in 450 μl sterile H2O to which 50 μl ice‐cold 2.5 M CaCl2 had been added. The DNA/Ca2+ mixture was then added dropwise to 500 μl 2× HEPES‐buffered saline (HBS) composed of 40 mM HEPES, 280 mM NaCl, and 1.5 mM Na2HPO4 (pH 7.18) while vortexing. The final mixture was added dropwise to the cells and allowed to incubate at 37°C for 6 h. The medium was then removed from the cells, and cells were washed repeatedly with phosphate‐buffered saline (PBS) until no CaPO4 crystals remained. The medium was then replaced with fresh growth medium.
Protein lysates, gel electrophoresis, and Western blot
Ten million cells in 0.15 ml of 150 mM NaCl, 20 mM Tris pH 7.4, 5 mM EDTA‐Tris, 10% glycerol and 30 zebrafish embryos (48 hpf) in 0.2 ml of Ringer solution, both containing 1% Triton X‐100, protease and phosphatase inhibitor cocktail (Sigma, Billerica, MA, USA), were kept on ice for 20 min. Embryos were passed in a Potter homogenizer, and both cell and zebrafish extracts cleared by centrifugation at 18,000 × g for 20 min at 4°C. The supernatants were solubilized in Laemmli gel sample buffer, and samples were separated by 15% SDS–PAGE and transferred electrophoretically to nitrocellulose membranes using an SE400 vertical electrophoresis unit (Hoefer Holliston, MA, USA). Western blotting was performed in PBS containing 3% non‐fat dry milk with monoclonal mouse anti‐α (Abcam, Cambridge, UK), anti‐β (Abcam), anti‐OSCP (Abcam), anti‐IF1 (Abcam) or polyclonal rabbit anti‐c (Abcam), and anti‐TOM20 (Santa Cruz Biotechnology, Dallas, Texas, USA) antibodies.
HeLa cell permeabilization
Cells were detached with trypsin, centrifuged at 1,000 × g for 5 min, and washed twice with PBS. The resulting pellet was suspended in KCl medium (130 mM KCl, 10 mM Mops‐Tris, pH 7.4) containing 1 mM EGTA‐Tris and 150 μM digitonin (1 mM MgCl2 was added when cells were prepared for CRC), and incubated for 20 min on ice. Cells were then diluted 1:10 in KCl medium containing 10 μM EGTA‐Tris (1 mM MgCl2 was added for CRC) and centrifuged at 1,000 × g in a refrigerated centrifuge (4°C) for 6 min. The final pellet was suspended and used for Ca2+‐ATP and Mg2+‐ATP hydrolysis or CRC measurements.
Mitochondrial Mg2+‐ATP and Ca2+‐ATP hydrolysis
Cells permeabilized as stated above were added at 0.25 (measurements with Mg2+) or 0.5 × 10⁶ × well−1 (measurements with Ca2+) in Harris buffer (50 mM KCl, 50 mM Tris–HCl, 30 mM sucrose, pH 7.4, 25°C). For measurements of ATP hydrolysis, the supplements were either 2 mM MgCl2 plus 0.5 mM EGTA or 2 mM CaCl2 plus 0.5 mM EDTA, 2 mM ATP, 50 μM alamethicin, 10 μM sodium decavanadate, and 10 μM ouabain. ATP hydrolysis was measured as the released inorganic phosphate after complexation with molybdate reagent. Mg2+‐ATPase activity was 90% inhibited by oligomycin while Ca2+‐ATPase activity was insensitive to oligomycin and 50% inhibited by resveratrol in line with the literature 59, 60, 61.
Oxygen consumption rate and Ca2+ retention capacity of adherent HeLa cells
Oxygen consumption rate in adherent cells was measured with an XF24 Extracellular Flux Analyzer (Seahorse Bioscience, Billerica MA, USA). HeLa cells were seeded in XF24 cell culture microplates (Seahorse Bioscience) at 5 × 10⁴ cells/well in 200 μl of DMEM containing 4.5 g/l glucose (Lonza) and incubated at 37°C in 5% CO2 for 24 h. Assays were initiated by replacing the growth medium in each well with 670 μl of unbuffered DMEM containing 4.5 g/l glucose (Sigma). The cells were incubated at 37°C for 30 min to allow temperature and pH equilibration. After an OCR baseline measurement, 70 μl of oligomycin, FCCP, rotenone, and antimycin A was sequentially added to each well to reach final concentrations of 1 μg/ml for oligomycin, 0.2 μM for FCCP, and 1 μM for rotenone and antimycin A. Data are expressed as pmol of oxygen per minute per 5 × 10⁴ cells. To measure the CRC, extra‐mitochondrial Ca2+ was followed based on Ca2+ Green‐5N fluorescence changes using a Fluoroskan Ascent FL (Thermo Electron, Waltham, MA, USA) plate reader in HeLa cells (106 × ml−1) in 130 mM KCl, 10 mM Mops‐Tris, 5 mM succinate‐Tris, 1 mM MgCl2, 1 mM Pi‐Tris, 10 μM EGTA, 0.5 μM Ca2+ Green‐5N, pH 7.4. For all CRC measurements, sequential 5 μM CaCl2 pulses were added to cells.
Modeling
The membrane extrinsic region of bovine F‐ATP synthase 49 (PDB code: 2WSS) was used as starting point for simulations. The structure consists of 3 α‐subunits (chains A–C) and 3 β‐subunits (chains D–F) crystallized in the three catalytic states Empty (E), ATP‐bound (TP), and ADP‐bound (DP). The crystal structure also includes the γ‐subunit (chain G) and OSCP (chain S). Although this currently represents the most complete structure available for ATP synthase, some protein chains were not resolved at atomic resolution and were not included in our simulations. The final system consists of eight chains, containing the following 3,273 resolved residues: αE, 1–510; αTP, 23–401 and 410–510; αDP, 27–510; βE, 9–474; βTP, 9–474; βDP, 9–475; γ, 1–61, 70–96, and 101–272; OSCP, 1–146. The phosphoaminophosphonic acid‐adenylate ester (ANP) present in the crystal structure was substituted with ATP. Parameters for ATP were included in the force field as previously described 62. The system was analyzed by four different MD simulations, that is, wild‐type with Mg2+, wild‐type with Ca2+, β T163S mutant with Mg2+, and β T163S mutant with Ca2+. Mutations were modeled with Bluues 63. All simulations were carried out on GPUs with NAMD 64 using the CHARMM‐27 force field. The TIP3p water model was used to simulate the explicit solvent in a cubic box of 141.5 × 160.2 × 162.5 Å. Each simulation run consisted of 100 conjugate gradient minimization steps, 100 ps in NVT conditions, and 50 ns of molecular dynamics. The temperature was kept at 310 K and pressure at 1.01325 bar in all simulations, excluding the NVT pre‐simulation steps. A 2 fs integration timestep was used with a Verlet method integrator 64. The simulations were compared in terms of root mean square deviation (RMSD) and root mean square fluctuation (RMSF). RMSF indexes are reported as structure coloring and thickening in the figure. RING 2.0 65 was used to visualize variations in the residue interaction network, with strict distance thresholds and the “one interaction” option, from interaction networks generated every 10 ns of simulation. The MD simulation data from this publication have been submitted to the zenodo database (https://zenodo.org/) with accession links: https://doi.org/10.5281/zenodo.438997 (Magnesium, wild‐type); https://doi.org/10.5281/zenodo.438943 (Magnesium, T163S mutant); https://doi.org/10.5281/zenodo.438711 (Calcium, wild‐type); https://doi.org/10.5281/zenodo.438697 (Calcium, T163S mutant).
Ca2+ and mitochondrial membrane potential
For measurements of Ca2+ and mitochondrial membrane potential, cells were seeded onto 24‐mm‐diameter round glass coverslips and grown for 2 days in DMEM. Cells were incubated in bicarbonate‐ and phenol red‐free HBSS (Sigma) containing 1 mM Ca2+, 10 mM Hepes, and 1.6 μM cyclosporin H to inhibit the multidrug resistance pump 66. pH was shifted to 7.8 to increase Ca2+ transport in the presence of ionomycin 67. Mitochondrial membrane potential was measured based on the accumulation of 20 nM TMRM. At the end of each experiment, mitochondria were fully depolarized by the addition of 5 μM of the protonophore carbonylcyanide‐p‐trifluoromethoxyphenyl hydrazone (FCCP). Ca2+ was measured after incubation with Fluo‐4FF/AM (5 μM, 20 min at 37°C and then 10 min at RT) in HBSS containing 1 mM Ca2+ and supplemented with 10 mM Hepes and 1.6 μM CsH, 0.02% Pluronic® F‐127 and 200 μM sulfinpyrazone. After washing in HBSS, cells were studied in the presence of 1 mM Ca2+ and sulfinpyrazone by monitoring Ca2+ changes after the additions of 2 μM ionomycin and 5 μM digitonin. Cellular fluorescence images were acquired with an Olympus IX71/IX51 inverted microscope equipped with a xenon light source (150W) for epifluorescence illumination and with a digital camera. For detection of fluorescence 545‐ or 488‐nm bandpass excitation and 573‐ or 525‐nm longpass emission filter settings were used for TMRM and Fluo‐4FF/AM, respectively. Images were collected with an exposure time of 150 ms (33% illumination intensity) using a 40×, 1.3 NA oil immersion objective (Olympus). Data were acquired and analyzed using Cell R software (Olympus). Fields not containing cells were taken as the background. Sequential digital images were acquired every minute, and the average fluorescence intensity of all relevant regions was recorded and stored for subsequent analysis. Fluorescence of one representative region per cell was monitored, and mean value of 5–10 cells per coverslip was calculated for each experiment, which was performed for three different sets of transfected cells.
Cell death
Cells were incubated with 2 μM ionomycin in DMEM (Lonza) for 2 h at 37°C. After washing with PBS, cells were incubated with PI (1 μg/ml) and 0.6% (v/v) FLUOS‐conjugated Annexin‐V in Hank's balanced salt solution supplemented with 10 mM HEPES, pH 7.4 for 15 min at 37°C. Cell death was detected in adherent cells using an Olympus IX71/IX51 inverted microscope (excitations 568 and 495 nm and emissions 585 and 515 nm, for PI and Annexin‐V, respectively) using a 10× objective (Olympus, Segrate, Italy). For FACS analysis cells were collected 48 h after transfection, resuspended at 105 cells × ml−1, and incubated at 37°C for 15 min in serum‐free DMEM without phenol red (Thermo Fisher Scientific) supplemented with 10 mM HEPES, PI (1 μg/ml), and 0.6% (v/v) FLUOS‐conjugated Annexin‐V, pH 7.4. Cell death was assessed by flow cytometry after the addition of 2 μM ionomycin or 200 μM arachidonic using a FACS Canto II flow cytometer (Becton Dickinson, Milan, Italy). Data acquisition and analysis were performed using FACSDiva software.
Zebrafish and embryo maintenance
Adult zebrafish were maintained in aerated, 28°C‐conditioned saline water according to standard protocols. Fish were kept under a 14‐h light/10‐h dark cycle. For mating, males and females were separated in the late afternoon, and were freed to start courtship the next morning, which ended with egg deposition and fertilization. Eggs were collected and washed with fish water (0.5 mM NaH2PO4, 0.5 mM Na2HPO4, 0.2 mg/l methylene blue, 3 mg/l Sea Salt (Instant Ocean, Blacksburg, VA, USA), and embryos were maintained at 28°C. All protocols and manipulations with zebrafish were approved by the Ethics Committee of the University of Padova and authorized by the Italian Ministry of Health.
Injection and morphological analysis
To verify the mitochondrial localization of human wild‐type β subunit, fertilized eggs from wild‐type zebrafish incrosses were co‐injected with 35 ng/μl of C‐terminally GFP‐tagged ATP5B construct (pEGFP‐N1‐huATP5Bwt) and 15 ng/μl of ptag‐mito‐RFP 68 plasmids at the one‐cell stage. Co‐injection of 35 ng/μl of empty pEGFP‐N1 and 15 ng/μl ptag‐mito‐RFP plasmids was used as a control. Colocalization analysis at 48 hpf was performed using a NIKON H600L confocal microscope equipped with Laser 488 (excitation 488 nm and emission 520 nm) to visualize GFP and Laser 561 (excitation 561 nm and emission 630 nm) to visualize RFP. Images were analyzed using a 60× oil immersion objective. The software used for imaging analysis and acquisition was NIS Elements Viewer (NIKON, Campi Bisenzio, Italy). Fish anesthetized using Tricaine (0.16 g/l Tricaine in Tris–HCl 1 M pH 9.1) were set for confocal analysis in 0.8% low melting agarose. Morphological analysis of embryos injected at the one‐cell stage with 35 ng/μl of human wild‐type or mutated β subunit sequences in pcDNA3.1 constructs (pcDNA3.1‐huATP5Bwt or pcDNA3.1‐huATP5B T163S), or with 100 μM z‐VAD‐fmk at 24 hpf, was performed at 48 hpf using a Leica M165FC stereomicroscope equipped with a 20× objective and a Leica DC500 camera for bright‐field image acquisition. Fish anesthetized with Tricaine solution were set in 2% methylcellulose.
Whole‐mount immunofluorescence
Expression of β‐subunit was detected in embryos injected at one‐cell stage with 35 ng/μl of human wild‐type or mutated β subunit sequences in pcDNA3.1 constructs (pcDNA3.1‐huATP5Bwt or pcDNA3.1‐huATP5B T163S). Briefly, embryos at 48 hpf were fixed for 3 h in 4% (w/v) paraformaldehyde solution in PBS. After rehydration in methanol, embryos were first incubated for 40 min at room temperature in a permeabilization solution containing 10 μg/ml proteinase K in PBS supplemented with 0.1% Tween‐20. After fixing with 4% (w/v) paraformaldehyde solution in PBS, samples were incubated in 1% (v/v) DMSO in PBS/Tween for 20 min at room temperature. Fish were incubated with primary antibodies diluted 1:100 in PBS/Tween (polyclonal rabbit anti‐TOM20, Santa Cruz Biotechnology, and monoclonal mouse anti‐β ATP synthase subunit, Abcam) at 4°C for 72 h. After extensive washings, embryos were incubated for 48 h at 4°C with secondary antibodies (anti‐mouse TRITC conjugated and anti‐rabbit FITC conjugated, Dako, Cernusco sul Naviglio, Italy) diluted 1:500 in PBS/Tween. Full Z‐stack images were collected with a NIKON H600L confocal microscope (40× objective) equipped with Laser 488 (excitation 488 nm and emission 520 nm) to visualize FITC and Laser 561 (excitation 561 nm and emission 620 nm) for TRITC.
TdT‐mediated dUTP Nick‐End Labeling (TUNEL) assay
To assess apoptosis, TUNEL staining was performed on embryos at 48 hpf using a TUNEL kit protocol (Promega). Briefly, embryos injected with 35 ng/μl of pcDNA3.1‐huATP5Bwt or pcDNA3.1‐huATP5B T163S constructs were fixed for 1 h with 4% paraformaldehyde in PBS solution. After three washes with PBS‐Triton 0.1%, embryos were permeabilized for 30 min in PBS‐Triton 0.15%. Embryos were pre‐incubated with equilibration buffer (TUNEL kit, Promega) for 10 min and then, incubated for 1 h in the dark at 37°C in equilibration buffer supplemented with fluorescein‐12‐dUTP mix and rTdT enzyme (TUNEL kit, Promega). The reaction was stopped by incubation in a solution containing 0.3 M NaCl, 0.03 M trisodium citrate, pH 7, for 20 min, then embryos were transferred onto glass slides, set in 0.8% low melting agarose, laterally oriented, and analyzed using a NIKON H600L confocal microscope equipped with Laser 488 (excitation 488 nm and emission 520 nm) to visualize GFP and a 40× objective. Apoptotic nuclei in entire embryos (head, trunk, yolk and tail) were counted using VOLOCITY 6.0 software (PerkinElmer, Waltham, MA, USA).
Statistics
Unless otherwise stated in the figure legends, each experiment was repeated at least three times. Data are presented as average ± s.e., ± s.e.m. or ± s.d., or, for clarity, as representative experiments (see figure legends for details). P‐values indicated in the figures are calculated with GraphPad or Origin software.
Author contributions
VG, GL, and PB conceived the study; VG, VB, and MS suggested and performed in vitro and in vivo experiments; CB, GM, and ST conceived and performed the molecular dynamics; VG, MS, and VB performed statistical analyses; VP, FA, and MF provided critical advice and suggested experiments; VG, VB, GL, ST, and PB wrote the manuscript.
Conflict of interest
The authors declare that they have no conflict of interest.
Supporting information
Expanded View Figures PDF
Table EV1
Review Process File
Acknowledgements
We would like to thank Domenico Cieri for the gift of the ptag‐mito‐RFP plasmid and the personnel of the Zebrafish Facility, Department of Biology, for their professional service. This work was supported by grants from AIRC (IG17067 to PB), Telethon (GGP14037 to PB), and Fondation Leducq (16CVD04 to PB and MF).
EMBO Reports (2017) 18: 1065–1076
See also: C Chinopoulos (July 2017)
Contributor Information
Valentina Giorgio, Email: vgiorgio@bio.unipd.it.
Giovanna Lippe, Email: giovanna.lippe@uniud.it.
Paolo Bernardi, Email: bernardi@bio.unipd.it.
References
- 1. Watt IN, Montgomery MG, Runswick MJ, Leslie AG, Walker JE (2010) Bioenergetic cost of making an adenosine triphosphate molecule in animal mitochondria. Proc Natl Acad Sci USA 107: 16823–16827 [DOI] [PMC free article] [PubMed] [Google Scholar]
- 2. Mitchell P (2011) Chemiosmotic coupling in oxidative and photosynthetic phosphorylation. 1966. Biochim Biophys Acta 1807: 1507–1538 [DOI] [PubMed] [Google Scholar]
- 3. Bernardi P, Rasola A, Forte M, Lippe G (2015) The mitochondrial permeability transition pore: channel formation by F‐ATP synthase, integration in signal transduction, and role in pathophysiology. Physiol Rev 95: 1111–1155 [DOI] [PMC free article] [PubMed] [Google Scholar]
- 4. Hunter DR, Haworth RA, Southard JH (1976) Relationship between configuration, function, and permeability in calcium‐treated mitochondria. J Biol Chem 251: 5069–5077 [PubMed] [Google Scholar]
- 5. Bernardi P, Petronilli V (1996) The permeability transition pore as a mitochondrial calcium release channel: a critical appraisal. J Bioenerg Biomembr 28: 131–138 [DOI] [PubMed] [Google Scholar]
- 6. Lu X, Kwong JQ, Molkentin JD, Bers DM (2016) Individual cardiac mitochondria undergo rare transient permeability transition pore openings. Circ Res 118: 834–841 [DOI] [PMC free article] [PubMed] [Google Scholar]
- 7. Kokoszka JE, Waymire KG, Levy SE, Sligh JE, Cai J, Jones DP, MacGregor GR, Wallace DC (2004) The ADP/ATP translocator is not essential for the mitochondrial permeability transition pore. Nature 427: 461–465 [DOI] [PMC free article] [PubMed] [Google Scholar]
- 8. Krauskopf A, Eriksson O, Craigen WJ, Forte MA, Bernardi P (2006) Properties of the permeability transition in VDAC1 ‐/‐ mitochondria. Biochim Biophys Acta 1757: 590–595 [DOI] [PubMed] [Google Scholar]
- 9. Baines CP, Kaiser RA, Sheiko T, Craigen WJ, Molkentin JD (2007) Voltage‐dependent anion channels are dispensable for mitochondrial‐dependent cell death. Nat Cell Biol 9: 550–555 [DOI] [PMC free article] [PubMed] [Google Scholar]
- 10. Gutierrez‐Aguilar M, Douglas DL, Gibson AK, Domeier TL, Molkentin JD, Baines CP (2014) Genetic manipulation of the cardiac mitochondrial phosphate carrier does not affect permeability transition. J Mol Cell Cardiol 72: 316–325 [DOI] [PMC free article] [PubMed] [Google Scholar]
- 11. Šileikyte J, Blachly‐Dyson E, Sewell R, Carpi A, Menabò R, Di Lisa F, Ricchelli F, Bernardi P, Forte M (2014) Regulation of the mitochondrial permeability transition pore by the outer membrane does not involve the peripheral benzodiazepine receptor (Translocator protein of 18 kDa (TSPO)). J Biol Chem 289: 13769–13781 [DOI] [PMC free article] [PubMed] [Google Scholar]
- 12. Doczi J, Torocsik B, Echaniz‐Laguna A, Mousson de Camaret B, Starkov A, Starkova N, Gál A, Molnár MJ, Kawamata H, Manfredi G et al (2016) Alterations in voltage‐sensing of the mitochondrial permeability transition pore in ANT1‐deficient cells. Sci Rep 6: 26700 [DOI] [PMC free article] [PubMed] [Google Scholar]
- 13. Petronilli V, Costantini P, Scorrano L, Colonna R, Passamonti S, Bernardi P (1994) The voltage sensor of the mitochondrial permeability transition pore is tuned by the oxidation‐reduction state of vicinal thiols. Increase of the gating potential by oxidants and its reversal by reducing agents. J Biol Chem 269: 16638–16642 [PubMed] [Google Scholar]
- 14. Šileikyte J, Petronilli V, Zulian A, Dabbeni‐Sala F, Tognon G, Nikolov P, Bernardi P, Ricchelli F (2011) Regulation of the inner membrane mitochondrial permeability transition by the outer membrane translocator protein (peripheral benzodiazepine receptor). J Biol Chem 286: 1046–1053 [DOI] [PMC free article] [PubMed] [Google Scholar]
- 15. Baines CP, Kaiser RA, Purcell NH, Blair NS, Osinska H, Hambleton MA, Brunskill EW, Sayen MR, Gottlieb RA, Dorn GW et al (2005) Loss of cyclophilin D reveals a critical role for mitochondrial permeability transition in cell death. Nature 434: 658–662 [DOI] [PubMed] [Google Scholar]
- 16. Basso E, Fante L, Fowlkes J, Petronilli V, Forte MA, Bernardi P (2005) Properties of the permeability transition pore in mitochondria devoid of cyclophilin D. J Biol Chem 280: 18558–18561 [DOI] [PubMed] [Google Scholar]
- 17. Nakagawa T, Shimizu S, Watanabe T, Yamaguchi O, Otsu K, Yamagata H, Inohara H, Kubo T, Tsujimoto Y (2005) Cyclophilin D‐dependent mitochondrial permeability transition regulates some necrotic but not apoptotic cell death. Nature 434: 652–658 [DOI] [PubMed] [Google Scholar]
- 18. Schinzel AC, Takeuchi O, Huang Z, Fisher JK, Zhou Z, Rubens J, Hetz C, Danial NN, Moskowitz MA, Korsmeyer SJ (2005) Cyclophilin D is a component of mitochondrial permeability transition and mediates neuronal cell death after focal cerebral ischemia. Proc Natl Acad Sci USA 102: 12005–12010 [DOI] [PMC free article] [PubMed] [Google Scholar]
- 19. Giorgio V, Bisetto E, Soriano ME, Dabbeni‐Sala F, Basso E, Petronilli V, Forte MA, Bernardi P, Lippe G (2009) Cyclophilin D modulates mitochondrial F0F1‐ATP synthase by interacting with the lateral stalk of the complex. J Biol Chem 284: 33982–33988 [DOI] [PMC free article] [PubMed] [Google Scholar]
- 20. Giorgio V, von Stockum S, Antoniel M, Fabbro A, Fogolari F, Forte M, Glick GD, Petronilli V, Zoratti M, Szabó I et al (2013) Dimers of mitochondrial ATP synthase form the permeability transition pore. Proc Natl Acad Sci USA 110: 5887–5892 [DOI] [PMC free article] [PubMed] [Google Scholar]
- 21. Szabó I, Zoratti M (2014) Mitochondrial channels: ion fluxes and more. Physiol Rev 94: 519–608 [DOI] [PubMed] [Google Scholar]
- 22. Carraro M, Giorgio V, Šileikyte J, Sartori G, Forte M, Lippe G, Zoratti M, Szabó I, Bernardi P (2014) Channel formation by yeast F‐ATP synthase and the role of dimerization in the mitochondrial permeability transition. J Biol Chem 289: 15980–15985 [DOI] [PMC free article] [PubMed] [Google Scholar]
- 23. von Stockum S, Giorgio V, Trevisan E, Lippe G, Glick GD, Forte MA, Da‐Rè C, Checchetto V, Mazzotta G, Costa R et al (2015) F‐ATPase of D. melanogaster forms 53 picosiemen (53‐pS) channels responsible for mitochondrial Ca2+‐induced Ca2+ release. J Biol Chem 290: 4537–4544 [DOI] [PMC free article] [PubMed] [Google Scholar]
- 24. Bonora M, Bononi A, De Marchi E, Giorgi C, Lebiedzinska M, Marchi S, Patergnani S, Rimessi A, Suski JM, Wojtala A et al (2013) Role of the c subunit of the FO ATP synthase in mitochondrial permeability transition. Cell Cycle 12: 674–683 [DOI] [PMC free article] [PubMed] [Google Scholar]
- 25. Alavian KN, Beutner G, Lazrove E, Sacchetti S, Park HA, Licznerski P, Li H, Nabili P, Hockensmith K, Graham M et al (2014) An uncoupling channel within the c‐subunit ring of the F1FO ATP synthase is the mitochondrial permeability transition pore. Proc Natl Acad Sci USA 111: 10580–10585 [DOI] [PMC free article] [PubMed] [Google Scholar]
- 26. Bernardi P, Vassanelli S, Veronese P, Colonna R, Szabó I, Zoratti M (1992) Modulation of the mitochondrial permeability transition pore. Effect of protons and divalent cations. J Biol Chem 267: 2934–2939 [PubMed] [Google Scholar]
- 27. Szabó I, Bernardi P, Zoratti M (1992) Modulation of the mitochondrial megachannel by divalent cations and protons. J Biol Chem 267: 2940–2946 [PubMed] [Google Scholar]
- 28. Arakaki N, Ueyama Y, Hirose M, Himeda T, Shibata H, Futaki S, Kitagawa K, Higuti T (2001) Stoichiometry of subunit e in rat liver mitochondrial H+‐ATP synthase and membrane topology of its putative Ca2+‐dependent regulatory region. Biochim Biophys Acta 1504: 220–228 [DOI] [PubMed] [Google Scholar]
- 29. Konstantinov YM, Møller IM (1994) A leucine motif in the amino acid sequence of subunit 9 of the mitochondrial ATPase, and other hydrophobic membrane proteins, that is highly conserved by editing. FEBS Lett 354: 245–247 [DOI] [PubMed] [Google Scholar]
- 30. Van Walraven HS, Scholts MJ, Zakharov SD, Kraayenhof R, Dilley RA (2002) pH‐dependent Ca2+ binding to the F0 c‐subunit affects proton translocation of the ATP synthase from Synechocystis 6803 . J Bioenerg Biomembr 34: 455–464 [DOI] [PubMed] [Google Scholar]
- 31. McGeoch JE, McGeoch MW, Mao R, Guidotti G (2000) Opposing actions of cGMP and calcium on the conductance of the F0 subunit c pore. Biochem Biophys Res Commun 274: 835–840 [DOI] [PubMed] [Google Scholar]
- 32. Zhou W, Marinelli F, Nief C, Faraldo‐Gómez JD (2017) Atomistic simulations indicate the c‐subunit ring of the F1Fo ATP synthase is not the mitochondrial permeability transition pore. eLife 6: e23781 [DOI] [PMC free article] [PubMed] [Google Scholar]
- 33. He J, Ford HC, Carroll J, Ding S, Fearnley IM, Walker JE (2017) Persistence of the mitochondrial permeability transition in the absence of subunit c of human ATP synthase. Proc Natl Acad Sci USA 114: 3409–3414 [DOI] [PMC free article] [PubMed] [Google Scholar]
- 34. Abrahams JP, Leslie AG, Lutter R, Walker JE (1994) Structure at 2.8 Å resolution of F1‐ATPase from bovine heart mitochondria. Nature 370: 621–628 [DOI] [PubMed] [Google Scholar]
- 35. Noji H, Yasuda R, Yoshida M, Kinosita K Jr (1997) Direct observation of the rotation of F1‐ATPase. Nature 386: 299–302 [DOI] [PubMed] [Google Scholar]
- 36. Hahn A, Parey K, Bublitz M, Mills DJ, Zickermann V, Vonck J, Kuhlbrandt W, Meier T (2016) Structure of a complete ATP synthase dimer reveals the molecular basis of inner mitochondrial membrane morphology. Mol Cell 63: 445–456 [DOI] [PMC free article] [PubMed] [Google Scholar]
- 37. Baker LA, Watt IN, Runswick MJ, Walker JE, Rubinstein JL (2012) Arrangement of subunits in intact mammalian mitochondrial ATP synthase determined by cryo‐EM. Proc Natl Acad Sci USA 109: 11675–11680 [DOI] [PMC free article] [PubMed] [Google Scholar]
- 38. Devenish RJ, Prescott M, Boyle GM, Nagley P (2000) The oligomycin axis of mitochondrial ATP synthase: OSCP and the proton channel. J Bioenerg Biomembr 32: 507–515 [DOI] [PubMed] [Google Scholar]
- 39. Boyer PD (1989) A perspective of the binding change mechanism for ATP synthesis. FASEB J 3: 2164–2178 [DOI] [PubMed] [Google Scholar]
- 40. Rees DM, Montgomery MG, Leslie AG, Walker JE (2012) Structural evidence of a new catalytic intermediate in the pathway of ATP hydrolysis by F1‐ATPase from bovine heart mitochondria. Proc Natl Acad Sci USA 109: 11139–11143 [DOI] [PMC free article] [PubMed] [Google Scholar]
- 41. Selwyn MJ (1968) Model reaction for mitochondrial adenosine triphosphatase. Nature 219: 490–493 [DOI] [PubMed] [Google Scholar]
- 42. Pedersen PL, Williams N, Hullihen J (1987) Mitochondrial ATP synthase: dramatic Mg2+‐induced alterations in the structure and function of the F1‐ATPase moiety. Biochemistry 26: 8631–8637 [DOI] [PubMed] [Google Scholar]
- 43. Papageorgiou S, Melandri AB, Solaini G (1998) Relevance of divalent cations to ATP‐driven proton pumping in beef heart mitochondrial F0F1‐ATPase. J Bioenerg Biomembr 30: 533–541 [DOI] [PubMed] [Google Scholar]
- 44. Nathanson L, Gromet‐Elhanan Z (2000) Mutations in the beta‐subunit Thr159 and Glu184 of the Rhodospirillum rubrum F0F1 ATP synthase reveal differences in ligands for the coupled Mg2+‐ and decoupled Ca2+‐dependent F0F1 activities. J Biol Chem 275: 901–905 [DOI] [PubMed] [Google Scholar]
- 45. Du Z, Tucker WC, Richter ML, Gromet‐Elhanan Z (2001) Assembled F1‐(αβ) and Hybrid F1‐α 3 β 3 γ‐ATPases from Rhodospirillum rubrum α, wild type or mutant β, and chloroplast γ subunits. Demonstration of Mg2+ versus Ca2+‐induced differences in catalytic site structure and function. J Biol Chem 276: 11517–11523 [DOI] [PubMed] [Google Scholar]
- 46. Fontaine E, Eriksson O, Ichas F, Bernardi P (1998) Regulation of the permeability transition pore in skeletal muscle mitochondria. Modulation by electron flow through the respiratory chain complex I. J Biol Chem 273: 12662–12668 [DOI] [PubMed] [Google Scholar]
- 47. Roy S, Šileikyte J, Schiavone M, Neuenswander B, Argenton F, Aubé J, Hedrick MP, Chung TDY, Forte MA, Bernardi P et al (2015) Discovery, synthesis, and optimization of diarylisoxazole‐3‐carboxamides as potent inhibitors of the mitochondrial permeability transition pore. ChemMedChem 10: 1655–1671 [DOI] [PMC free article] [PubMed] [Google Scholar]
- 48. Jault JM, Allison WS (1993) Slow binding of ATP to noncatalytic nucleotide binding sites which accelerates catalysis is responsible for apparent negative cooperativity exhibited by the bovine mitochondrial F1‐ATPase. J Biol Chem 268: 1558–1566 [PubMed] [Google Scholar]
- 49. Rees DM, Leslie AG, Walker JE (2009) The structure of the membrane extrinsic region of bovine ATP synthase. Proc Natl Acad Sci USA 106: 21597–21601 [DOI] [PMC free article] [PubMed] [Google Scholar]
- 50. Zhou A, Rohou A, Schep DG, Bason JV, Montgomery MG, Walker JE, Grigorieff N, Rubinstein JL (2015) Structure and conformational states of the bovine mitochondrial ATP synthase by cryo‐EM. eLife 4: e10180 [DOI] [PMC free article] [PubMed] [Google Scholar]
- 51. Petronilli V, Penzo D, Scorrano L, Bernardi P, Di Lisa F (2001) The mitochondrial permeability transition, release of cytochrome c and cell death. Correlation with the duration of pore openings in situ. J Biol Chem 276: 12030–12034 [DOI] [PubMed] [Google Scholar]
- 52. Scorrano L, Penzo D, Petronilli V, Pagano F, Bernardi P (2001) Arachidonic acid causes cell death through the mitochondrial permeability transition. Implications for tumor necrosis factor‐α apoptotic signaling. J Biol Chem 276: 12035–12040 [DOI] [PubMed] [Google Scholar]
- 53. Orrenius S, Zhivotovsky B, Nicotera P (2003) Regulation of cell death: the calcium‐apoptosis link. Nat Rev Mol Cell Biol 4: 552–565 [DOI] [PubMed] [Google Scholar]
- 54. Prudent J, Popgeorgiev N, Bonneau B, Gillet G (2015) Bcl‐2 proteins, cell migration and embryonic development: lessons from zebrafish. Cell Death Dis 6: e1910 [DOI] [PMC free article] [PubMed] [Google Scholar]
- 55. Prudent J, Popgeorgiev N, Bonneau B, Thibaut J, Gadet R, Lopez J, Gonzalo P, Rimokh R, Manon S, Houart C et al (2013) Bcl‐wav and the mitochondrial calcium uniporter drive gastrula morphogenesis in zebrafish. Nat Commun 4: 2330 [DOI] [PubMed] [Google Scholar]
- 56. Azzolin L, Basso E, Argenton F, Bernardi P (2010) Mitochondrial Ca2+ transport and permeability transition in zebrafish (Danio rerio). Biochim Biophys Acta 1797: 1775–1779 [DOI] [PubMed] [Google Scholar]
- 57. Cole LK, Ross LS (2001) Apoptosis in the developing zebrafish embryo. Dev Biol 240: 123–142 [DOI] [PubMed] [Google Scholar]
- 58. Lee CF, Chavez JD, Garcia‐Menendez L, Choi YS, Roe ND, Chiao YA, Edgar JS, Goo YA, Goodlett DR, Bruce JE et al (2016) Normalization of NAD+ redox balance as a therapy for heart failure. Circulation 134: 883–894 [DOI] [PMC free article] [PubMed] [Google Scholar]
- 59. Gledhill JR, Montgomery MG, Leslie AG, Walker JE (2007) Mechanism of inhibition of bovine F1‐ATPase by resveratrol and related polyphenols. Proc Natl Acad Sci USA 104: 13632–13637 [DOI] [PMC free article] [PubMed] [Google Scholar]
- 60. Sassi N, Mattarei A, Azzolini M, Bernardi P, Szabo’ I, Paradisi C, Zoratti M, Biasutto L (2014) Mitochondria‐targeted resveratrol derivatives act as cytotoxic pro‐oxidants. Curr Pharm Des 20: 172–179 [DOI] [PubMed] [Google Scholar]
- 61. Madreiter‐Sokolowski CT, Gottschalk B, Parichatikanond W, Eroglu E, Klec C, Waldeck‐Weiermair M, Malli R, Graier WF (2016) Resveratrol specifically kills cancer cells by a devastating increase in the Ca2+ coupling between the greatly tethered endoplasmic reticulum and mitochondria. Cell Physiol Biochem 39: 1404–1420 [DOI] [PMC free article] [PubMed] [Google Scholar]
- 62. Polticelli F, Basran J, Faso C, Cona A, Minervini G, Angelini R, Federico R, Scrutton NS, Tavladoraki P (2005) Lys300 plays a major role in the catalytic mechanism of maize polyamine oxidase. Biochemistry 44: 16108–16120 [DOI] [PubMed] [Google Scholar]
- 63. Walsh I, Minervini G, Corazza A, Esposito G, Tosatto SC, Fogolari F (2012) Bluues server: electrostatic properties of wild‐type and mutated protein structures. Bioinformatics 28: 2189–2190 [DOI] [PubMed] [Google Scholar]
- 64. Phillips JC, Braun R, Wang W, Gumbart J, Tajkhorshid E, Villa E, Chipot C, Skeel RD, Kale L, Schulten K (2005) Scalable molecular dynamics with NAMD. J Comput Chem 26: 1781–1802 [DOI] [PMC free article] [PubMed] [Google Scholar]
- 65. Piovesan D, Minervini G, Tosatto SC (2016) The RING 2.0 web server for high quality residue interaction networks. Nucleic Acids Res 44: W367–W374 [DOI] [PMC free article] [PubMed] [Google Scholar]
- 66. Bernardi P, Scorrano L, Colonna R, Petronilli V, Di Lisa F (1999) Mitochondria and cell death. Mechanistic aspects and methodological issues. Eur J Biochem 264: 687–701 [DOI] [PubMed] [Google Scholar]
- 67. Fasolato C, Pozzan T (1989) Effect of membrane potential on divalent cation transport catalyzed by the “electroneutral” ionophores A23187 and ionomycin. J Biol Chem 264: 19630–19636 [PubMed] [Google Scholar]
- 68. Bergamin G, Cieri D, Vazza G, Argenton F, Mostacciuolo ML (2016) Zebrafish Tg(hb9:MTS‐Kaede): a new in vivo tool for studying the axonal movement of mitochondria. Biochim Biophys Acta 1860: 1247–1255 [DOI] [PubMed] [Google Scholar]
Associated Data
This section collects any data citations, data availability statements, or supplementary materials included in this article.
Supplementary Materials
Expanded View Figures PDF
Table EV1
Review Process File