

Abstract
Dihydroceramide desaturases are evolutionarily conserved enzymes that convert dihydroceramide (dhCer) to ceramide (Cer). While elevated Cer levels cause neurodegenerative diseases, the neuronal activity of its direct precursor, dhCer, remains unclear. We show that knockout of the fly dhCer desaturase gene, infertile crescent (ifc), results in larval lethality with increased dhCer and decreased Cer levels. Light stimulation leads to ROS increase and apoptotic cell death in ifc‐KO photoreceptors, resulting in activity‐dependent neurodegeneration. Lipid‐containing Atg8/LC3‐positive puncta accumulate in ifc‐KO photoreceptors, suggesting lipophagy activation. Further enhancing lipophagy reduces lipid droplet accumulation and rescues ifc‐KO defects, indicating that lipophagy plays a protective role. Reducing dhCer synthesis prevents photoreceptor degeneration and rescues ifc‐KO lethality, while supplementing downstream sphingolipids does not. These results pinpoint that dhCer accumulation is responsible for ifc‐KO defects. Human dhCer desaturase rescues ifc‐KO larval lethality, and rapamycin reverses defects caused by dhCer accumulation in human neuroblastoma cells, suggesting evolutionarily conserved functions. This study demonstrates a novel requirement for dhCer desaturase in neuronal maintenance in vivo and shows that lipophagy activation prevents activity‐dependent degeneration caused by dhCer accumulation.
Keywords: dihydroceramide, lipophagy, neurodegeneration, photoreceptors, sphingolipid
Subject Categories: Autophagy & Cell Death, Metabolism, Neuroscience
Introduction
Sphingolipids are essential membrane constituents of all eukaryotic cells and play important roles in the regulation of basic cellular processes such as cell cycle progression, apoptosis, differentiation, and stress response (reviewed in 1). Sphingolipid imbalance is linked to a wide range of human diseases, including metabolic disorders, cardiovascular diseases, chronic inflammation, cancers, and neurological disorders 2. Cellular levels of sphingolipids are particularly high in the nervous system 3, and accumulating evidence highlights the importance of de novo sphingolipid biosynthesis in neuronal function 4, 5, 6. The de novo synthesis pathway is a highly conserved process catalyzed by enzymes including serine palmitoyltransferase (SPT), ceramide synthase, and dihydroceramide desaturase to generate ceramide (Cer), which is at the center of sphingolipid metabolism and serves as the building block for more complex sphingolipids (Fig 1A). Cer levels in the brain increase with age 7, and high cellular levels of Cer cause cell death in various neurodegenerative diseases 8. Dihydroceramide (dhCer) is the immediate precursor of Cer in the de novo synthesis pathway. Unlike Cer, treating cells with exogenous dhCer has little effect on cell growth or apoptosis 9. Moreover, dhCer is structurally very similar to Cer, and endogenous dhCer is much less abundant than other sphingolipid species, reported to be only 2–3.5% of Cer levels in primary rat neurons 10. These properties used to make it technically challenging to detect dhCer levels reliably. Thus, dhCer has long been considered inert and is often used as a negative control for Cer treatments 9, 11. However, accumulating evidence shows that dhCer accumulation leads to cell cycle arrests and cell death (reviewed in 12), supporting that it is itself an active molecule.
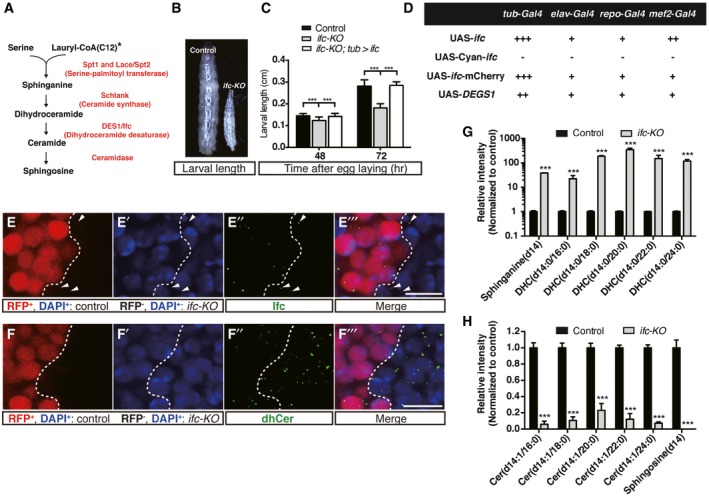
Figure 1. Knocking‐out of the Drosophila dhCer desaturase gene, ifc, results in developmental arrest and sphingolipid imbalance.
-
ADe novo sphingolipid synthesis pathway in Drosophila. *: note that sphinganine is synthesized from lauroyl‐CoA in flies instead of palmitoyl‐CoA as in mammals.
-
BSide‐by‐side view of a w1118 control and a ifc‐KO larva at 72 h after egg laying.
-
CBody lengths measured at 48 and 72 h after egg laying. (n = 180, 95, and 191 at 48 h versus n = 69, 144, and 121 at 72 h for control, ifc‐KO, and ifc‐KO; tub > ifc, respectively).
-
DRescue of ifc‐KO lethality by tissue‐specific transgenic overexpression under Gal4 drivers: tub‐Gal4 (ubiquitous), elav‐Gal4 (pan‐neuronal), repo‐Gal4 (glia), and mef2‐Gal4 (muscle). “+++”: more than 50% of larvae rescued to pupal and adult stages, “++”: between 35 and 50%, and “+”: below 35%; “−”: none. n > 500 flies were examined for lethality rescue for each cross from three independent experiments.
-
E–E’”Immunostaining of Ifc (green) and nucleus (DAPI, blue) in clonal ifc‐KO imaginal eye discs (RFP−: ifc‐KO; RFP+ and dashed lines: wild type). Arrowheads in (E’’, E’’’) indicate the Ifc signals in ifc‐KO clones (RFP−). Scale bar: 10 μm.
-
F–F’”dhCer staining (green) and nucleus labeling (DAPI, blue) in clonal ifc‐KO imaginal eye discs (RFP−: ifc‐KO; RFP+ and dashed lines: wild type). Scale bar: 10 μm.
-
G, HUHPLC‐MS/MS analysis showing the levels of sphingolipid species including sphinganine, dihydroceramide (DHC), ceramide (Cer), and sphingosine in second‐instar control and ifc‐KO larvae. Results are from three independent experiments.
Dihydroceramide desaturase catalyzes the final step of de novo synthesis to convert dhCer into Cer. There are two dhCer desaturase homologs (DEGS1 and 2) in humans, with DEGS1 being the predominant enzyme in most tissues 13. DEGS1 knockout mice die shortly after birth 14; thus, most studies of DEGS1 have been performed in vitro. Reducing DEGS1 activity elevates cellular dhCer and reduces Cer levels 13, 14, 15, demonstrating that DEGS1 is crucial in controlling the dhCer/Cer ratio. DhCer accumulation has been shown to increase reactive oxygen species (ROS) 16 and activate macroautophagy (referred to as autophagy hereafter) 17. Although autophagy induction can function as a survival mechanism in response to cellular stress such as ROS, excessive autophagic activity is known to cause cell death. Conflicting results have been reported on the relationships between dhCer accumulation, ROS production, autophagy activation, and cell death. For example, Apraiz et al 18 performed a series of combinatorial chemical treatments and reported the absence of causal relationships between dhCer accumulation, ROS production, and cell death in leukemia cells. Noack et al 19 showed that treating glioblastoma cells with sphingosine kinase inhibitor and the chemotherapeutic drug temozolomide results in dhCer accumulation, which leads to ER stress, ROS accumulation, and autophagy induction, eventually contribute to cancer cell apoptosis. Hernández‐Tiedra et al 20 show that chemical inhibition of DEGS1 activates autophagy and induces apoptosis in glioma cells and suggest that autophagy induction promotes apoptosis. The cellular response to dhCer accumulation is likely to be context‐dependent, and further studies are necessary to elucidate the neuronal activity of dhCer and the function of dhCer desaturase in vivo.
Here, we generated a null allele of the sole Drosophila dhCer desaturase gene, infertile crescent (ifc), and examined its effect on activity‐dependent neurodegeneration of photoreceptor. We used both genetic and pharmacological manipulations to show that ifc‐KO leads to dhCer accumulation, which increased cellular ROS and resulted in activity‐dependent degeneration of Drosophila photoreceptors. We found that dhCer accumulation activated lipophagy, which is a specialized form of autophagy for the degradation of lipid droplets 21, and that lipophagy plays a protective role to reduce ROS and cell death in ifc‐KO photoreceptors. We further investigated the interplay between dhCer accumulation, ROS level, and lipophagy and showed that the findings are conserved in human neuroblastoma cells.
Results
Evolutionarily conserved function of dhCer desaturase is required for larval viability in Drosophila
We generated ifc knockout flies (ifc‐KO) using the CRISPR/Cas9 system (Fig EV1A). The excision of the entire ifc open‐reading frame was confirmed by PCR and sequencing (Fig EV1B), and qRT–PCR confirmed the lack of detectable ifc mRNA in the knockout larvae (Fig EV4A). Zygotic deletion of ifc resulted in early developmental delay (Fig 1B and C), and homozygous ifc‐KO larvae eventually died at the L2 larval stage. Ubiquitous expression of ifc full‐length cDNA (tub>ifc) rescued the developmental arrest and larval lethality of ifc‐KO flies (Fig 1C and D). We therefore consider ifc‐KO a molecularly defined null allele. Transgenic UAS‐ifc‐mCherry was functionally comparable to the non‐tagged Ifc in rescuing ifc‐KO lethality (Fig 1D) and was thus used for further analyses below.
Figure EV1. Generation and verification of ifc‐KO fly.
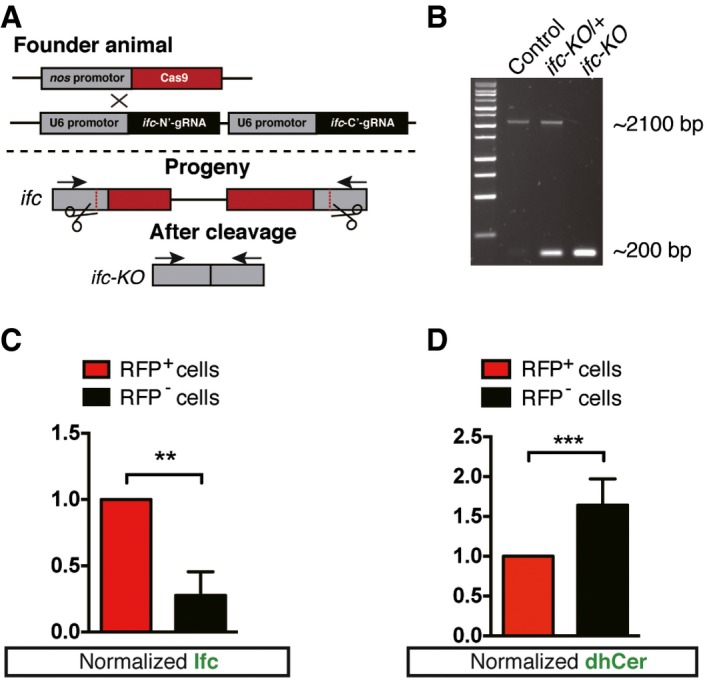
- The complete ifc open‐reading frame was deleted by crossing nos‐Cas9 to ifc‐gRNA‐containing transgenic flies. Gray, red, and black rectangles represent promoter regions, exons, and gRNA sites, respectively. Arrows indicate the primers for PCR screening of the excision event.
- PCR results confirming the excision of ifc‐ORF region in ifc‐KO second‐instar larvae.
- Quantification of Ifc‐positive signals in ifc‐KO (RFP−) cells and wild type (RFP+) in mosaic eye discs. Normalization of anti‐Ifc signals based on the values of RFP+ cells (≥ 1 field/eye disk from n ≥ 3).
- Quantification of anti‐dhCer‐positive signals in ifc‐KO (RFP−) cells and wild type (RFP+) in mosaic eye discs. Normalization of anti‐dhCer signals based on the values of RFP+ cells (≥ 1 field/eye disk from n ≥ 6).
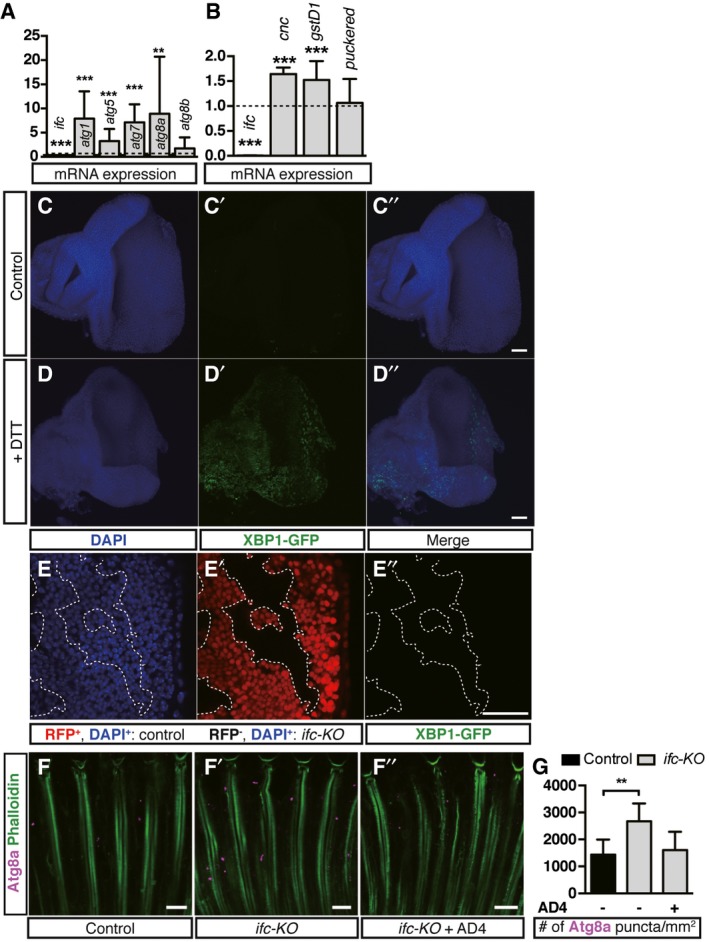
Figure EV4. Loss of Ifc leads to activation of autophagy and oxidative stress response genes but not ER stress response in neurons.
-
AqRT–PCR quantification of mRNA levels of ifc, atg1, atg5, atg7, atg8a, and atg8b in second‐instar ifc‐KO larvae compared to control larvae. The results were normalized to the corresponding mRNA level in control larvae as indicated by the dashed line (means ± SD of three independent experiments).
-
BqRT–PCR quantification of mRNA levels of oxidative stress response genes cnc and gstD1, and the reporter gene for the activation of JNK pathway puckered in ifc‐KO larvae compared to control larvae. The results were normalized to the corresponding mRNA level in control larvae as indicated by the dashed line (means ± SD of three independent experiments).
-
C–E’’UAS‐Xbp1‐GFP (green) was expressed under the control of tub‐Gal4. DAPI staining (blue) marks the nuclei. No GFP signal was observed in wild‐type discs (C’). ER stress response was induced by incubating the control eye disks in 0.005 M DTT and detected by induced XBP1‐GFP (green) expression (D’). No XBP1‐GFP was observed in ifc‐KO mosaic eye clones (E’). RFP−: ifc‐KO; RFP+: wild type. Scale bars: 3 μm.
-
F–F’’Eye longitudinal sections of control, ifc‐KO, and ifc‐KO fed with AD4 flies for 3‐day light stimulation showing rhabdomeres (Phalloidin, green) and Atg8a (magenta). Scale bars: 10 μm.
-
GQuantification of Atg8a puncta/mm2 in (F–F’’) (≥ 1 field/eye from n ≥ 3 each)
We created mosaic eye imaginal discs using the ey‐FLP/FRT system so that only the wild‐type cells, but not the ifc‐KO photoreceptors, were marked with RFP 22. We detected Ifc protein in the mosaic ifc‐KO clones with anti‐Ifc polyclonal antibodies generated for this study (see Materials and Methods). The amount of Ifc protein was greatly reduced in RFP‐negative ifc‐KO clones (Figs 1E–E’’’ and EV1C). When we expressed ifc cDNA in ifc‐KO flies under tissue‐specific Gal4 drivers, targeted expression of Ifc in pan‐neuronal tissues (elav‐Gal4), glial cells (repo‐Gal4), and muscle (mef2‐Gal4) could all rescue the lethality of ifc‐KO flies to adulthood (Fig 1D), suggesting that transgenic overexpression of Ifc may exert cell non‐autonomous activity. Exogenous expression of human DEGS1 was able to rescue ifc‐KO to adulthood (Fig 1D), suggesting that fly Ifc and human DEGS1 are functionally conserved.
In the mosaic eye discs, we found that dhCer levels increased in ifc‐KO clones, comparing to those in the adjacent wild‐type cells (Figs 1F–F’’’ and EV1D). The UHPLC‐MS/MS profile of larval lipid extracts showed 20–350‐fold increases in the levels of dhCer subspecies and its precursor sphinganine in ifc‐KO over wild‐type controls (Fig 1G), accompanied by >fourfold decreased levels of downstream metabolites Cer and sphingosine (Fig 1H). This imbalance indicated that the enzymatic function of Ifc could not be compensated, and Ifc is an essential regulator of sphingolipid homeostasis in Drosophila.
Loss of ifc led to activity‐dependent neurodegeneration
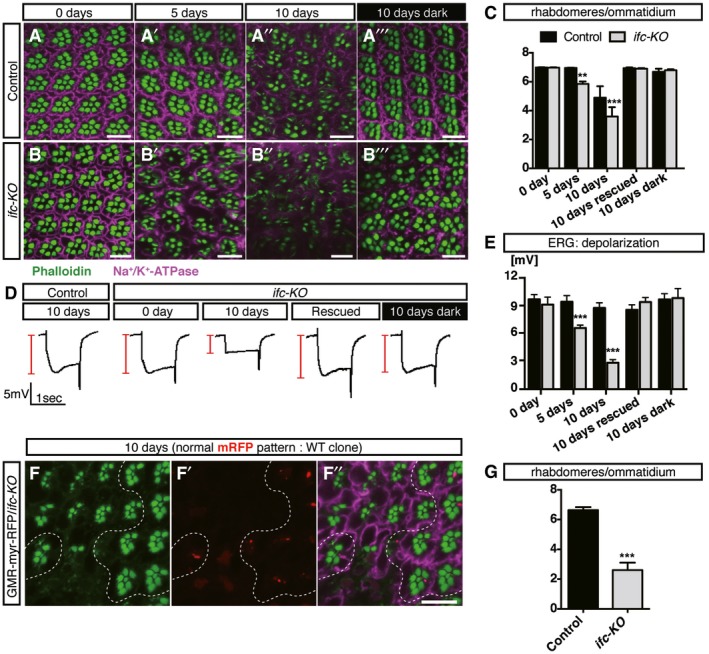
We went on to investigate the effects of mosaic and whole‐eye ifc‐KO clones in otherwise heterozygous animals. At the time of eclosion, the whole‐eye clones of ifc‐KO were indistinguishable from wild‐type eyes in the overall appearance and the arrangement of photoreceptors, suggesting no cell‐autonomous requirement for photoreceptor development (Fig 2A–C). When we stressed the adult ifc‐KO eyes with constant light exposure, we observed significant reduction in rhabdomere numbers accompanied with distorted photoreceptor margins at 5 and 10 days post‐eclosion (Fig 2B’ and B”). Likewise, the depolarization by electroretinogram (ERG) was also significantly reduced (Fig 2D and E). Both the morphological defects (Fig 2A–C) and the functional decline (Fig 2D and E) exacerbated over time. However, we did not observe the same level of premature degeneration for the dark‐reared ifc‐KO eyes (Fig 2B’’’ and C–E). These data indicated that photoreceptors underwent an adult‐onset, activity‐dependent neurodegeneration in the absence of ifc. Mosaic ifc‐KO clones showed similar level of activity‐dependent degeneration (Fig 2F–G), supporting that ifc is required for the maintenance of adult photoreceptor function.
Figure 2. Activity‐dependent degeneration of ifc‐KO eyes in morphology and function.
-
A–CEye cross sections of wild type (A) and ifc‐KO (B) under different constant light stimulation or dark‐reared condition labeled with rhabdomeres (Phalloidin, green) and neuronal membrane (Na+/K+‐ATPase, magenta). Scale bars: 10 μm. Rhabdomere counts per ommatidium quantified in (C) (≥ 30 ommatidia/fly from n ≥ 3 flies for each genotype, time point, or light exposure).
-
D, EElectroretinogram (ERG) responses of control versus ifc‐KO eyes. Constant light stimulation for 10 days leads to a striking decrease in the depolarization amplitude of ifc‐KO eyes compared to the wild‐type controls and the dark‐reared ifc‐KO eyes. Sample ERG traces show in (D). (E) Quantification of depolarization amplitudes in (D) (n = 12 and 17 at day 0, n = 17 and 19 at day 5, n = 15 and 25 at day 10 for control and ifc‐KO flies, respectively; n = 18 and 25 at day 10 for control and rescued flies, respectively; n = 13 and 8 at day 10 for control and dark‐reared ifc‐KO flies, respectively).
-
F–GEye cross sections of ifc‐KO mosaic clones generated by ey‐FLP showing rhabdomeres (Phalloidin, green) and neuronal membrane morphology (Na+/K+‐ATPase, magenta) after 10‐day light stimulation. Control cells were labeled by GMR‐myr‐RFP and ifc‐KO cells lack GMR‐myr‐RFP expression, separated by dashed lines. Scale bar: 10 μm. Rhabdomere counts per ommatidium quantified in (G) (≥ 30 ommatidia/fly from n ≥ 7 flies for each genotype).
ifc‐KO photoreceptor degeneration was caused by increased dhCer, not reduced levels of ceramide or sphingosine
Many phenotypes of ifc‐KO, including Cer reduction, developmental arrest, and early lethality, were similar to those reported for schlank mutants 23. Schlank encodes the only Drosophila ceramide synthase responsible for converting sphinganine to dhCer, and it is the enzyme directly upstream of Ifc in the de novo synthesis pathway (Fig 1A). These phenotypic similarities seem to suggest that Cer deficiency is the common culprit of both mutants. However, while Cer feeding indeed raised Cer levels both in the heads and in bodies (Fig EV2A–B’), supplementation of downstream sphingolipids (Cer or sphingosine) did not restore the functional or morphological defects of ifc‐KO eyes (Figs 3A and EV2C–D). Therefore, the defects of ifc‐KO flies were unlikely to be due to reduced Cer level.
Figure EV2. The increase in Cer and dhCer species in heads and bodies of flies fed with Cer‐d14. Sphingosine feeding did not rescue activity‐dependent degeneration of ifc‐KO photoreceptors.
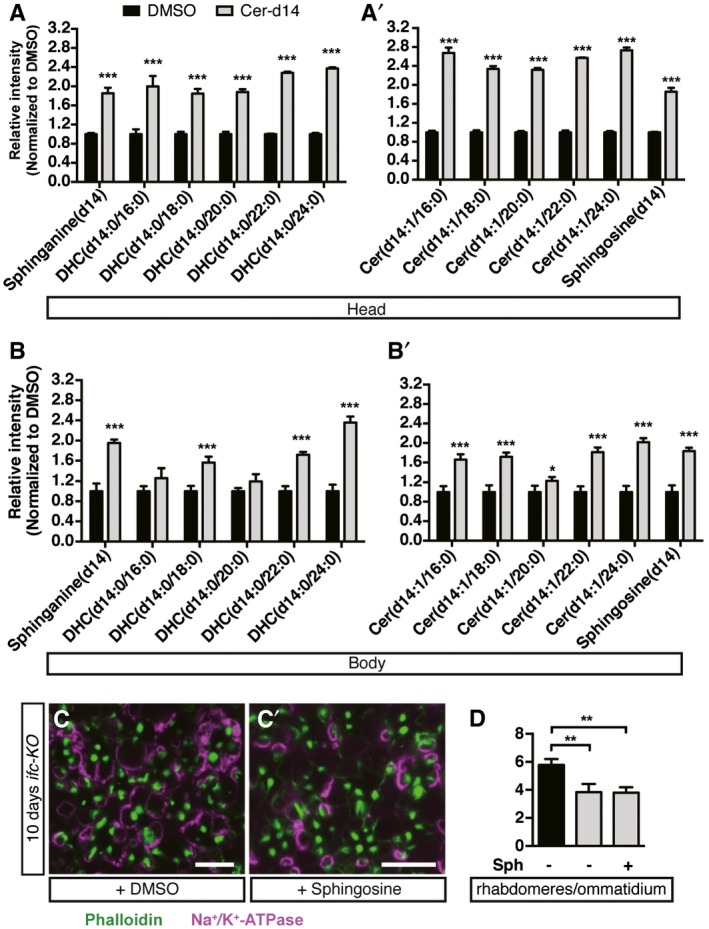
-
A–B’UHPLC‐MS/MS analysis showing the levels of sphingolipid species sphinganine, dihydroceramide (DHC), ceramide (Cer), and sphingosine in flies with ifc‐KO eyes fed with DMSO or ceramide‐d14 for 10 days since eclosion. Normalization level based on DMSO controls (means ± SD of three independent experiments).
-
C–DEye cross sections of ifc‐KO flies fed with (C’) or without (C) sphingosine for 10‐day light stimulation showing rhabdomeres (Phalloidin, green) and neuronal membrane morphology (Na+/K+‐ATPase, magenta), with quantification shown in (D) (≥ 30 ommatidia/fly from n ≥ 4 each). Scale bars: 10 μm.
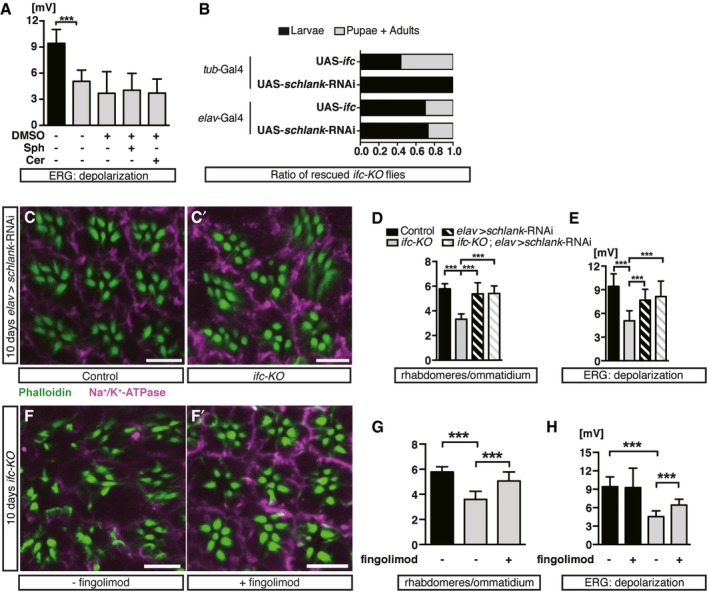
Figure 3. Activity‐dependent neurodegeneration in ifc‐KO eyes and genetic and chemical manipulations of dhCer levels.
-
AAmplitude of ERG depolarization in ifc‐KO flies fed with the solvent DMSO, sphingosine (Sph), or ceramide (Cer) for 10 days after eclosion, comparing to controls (n ≥ 28 each).
-
BRescue of ifc‐KO lethality by ubiquitous (tub‐Gal4) (pupae: 25/100; adult: 5/100) or pan‐neuronal (elav‐Gal4) (pupae: 19/82; adult: 3/82) knockdown of schlank, compared to ubiquitous (pupae: 12/64; adult: 24/64) or pan‐neuronal (pupae: 25/100; adult: 5/100) Ifc expression.
-
C–ENeuronal knockdown of schlank (elav>schlank‐RNAi) rescued photoreceptor degeneration of ifc‐KO after 10‐day light stimulation. (C, C’) Eye cross sections of elav > schlank‐RNAi and ifc‐KO; elav>schlank‐RNAi flies showing rhabdomeres (Phalloidin, green) and neuronal membrane morphology (Na+/K+‐ATPase, magenta). Scale bars: 10 μm. (D) Quantification of (C, C’) (≥ 30 ommatidia/fly from n ≥ 3 each). (E) Quantification of ERG depolarization amplitudes (n = 15, 25, 17, and 8 flies for control, ifc‐KO, elav > schlank‐RNAi, ifc‐KO; elav>schlank‐RNAi, respectively).
-
F–HInhibition of Schlank by fingolimod partially restored the morphology and function of photoreceptors in ifc‐KO flies after 10‐day light stimulation. (F, F’) Eye cross sections of ifc‐KO flies fed with (F’) or without (F) fingolimod showing rhabdomeres (Phalloidin, green) and neuronal membrane morphology (Na+/K+‐ATPase, magenta). Scale bars: 10 μm. (G) Quantification of (F, F’) (≥ 30 ommatidia/fly from n ≥ 6 each). (H) Quantification of ERG depolarization amplitudes in control and ifc‐KO flies fed with or without fingolimod‐supplemented food. (n = 15, 7, 18, and 7 for control, control + fingolimod, ifc‐KO, ifc‐KO + fingolimod flies, respectively).
We next tested whether the degeneration was due to increased levels of dhCer by inhibiting the upstream enzyme Schlank. We confirmed that ubiquitous knockdown of schlank led to larval lethality in wild type and ifc‐KO background (23 and Fig 3B). Interestingly, neuron‐specific knockdown of schlank (elav > schlank‐RNAi) rescued the larval lethality and photoreceptor morphology/function in ifc‐KO animals without causing any observable phenotype in the wild‐type background (Fig 3B–E). The ceramide synthase inhibitor fingolimod also rescued the morphological and functional defects of ifc‐KO photoreceptors (Fig 3F–H). Altogether, blocking dhCer synthesis suppressed the ifc‐KO defects, and the lethality of ifc‐KO was due to the neuronal accumulation of dhCer.
The subcellular localization of Ifc
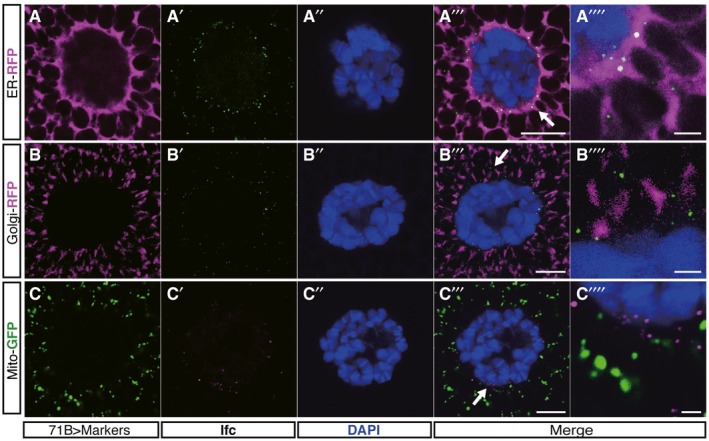
We performed immunostaining to detect Ifc in flies expressing fluorescent transgenes labeling ER (KDEL‐RFP), Golgi (galactosyltransferase‐RFP), or mitochondria (Mito‐GFP). In larval salivary glands, Ifc was mostly associated with the ER (Fig EV3), consistent with previous reports for human DEGS1 24. In photoreceptors, however, Ifc showed little or no colocalization with the ER, Golgi, or Mito markers (Fig 4A–D). Instead, Ifc signals colocalized with endosomal markers GFP‐FYVE (endosomes), Spin‐GFP (late endosome/lysosome), Lamp1‐GFP (late endosome/lysosome), and Rab4‐EYFP (recycling endosome) (Fig 4E–H). To verify the results, we took ifc‐KO flies expressing a functional UAS‐ifc‐mCherry transgene and detected with antibodies against BiP (ER), Rab5 (early endosome), or Rab7 (late endosome/autophagosome). Ifc‐mCherry colocalized more with Rab7, but much less so with BiP or Rab5 (Fig 4I–L). The distinct subcellular localization of Ifc between the developing salivary gland and adult photoreceptors suggested that Ifc may exert novel neuronal functions other than the previously reported roles in the ER.
Figure EV3. Ifc is mainly localized to ER in Drosophila salivary gland.
-
A–C’’’’Representative confocal images of Ifc immunostaining (green in A’ and B’; magenta in C’) in the salivary gland of wild‐type larvae with transgenic expression of compartmental markers. Transgenic expression in salivary gland is driven by 71B‐Gal4 for the expressions of KDEL‐RFP for ER (magenta in A), galactosyltransferase‐RFP for Golgi (magenta in B), and Mito‐GFP for mitochondria (green in C). Nuclei are labeled by DAPI (blue). Arrows shown in (A’’’, B’’’, C’’’) indicate the enlarged fields in (A’’’’, B’’’’, C’’’’). Scale bars: 10 μm or 2 μm for the magnified (A’’’’, B’’’’, and C’’’’).
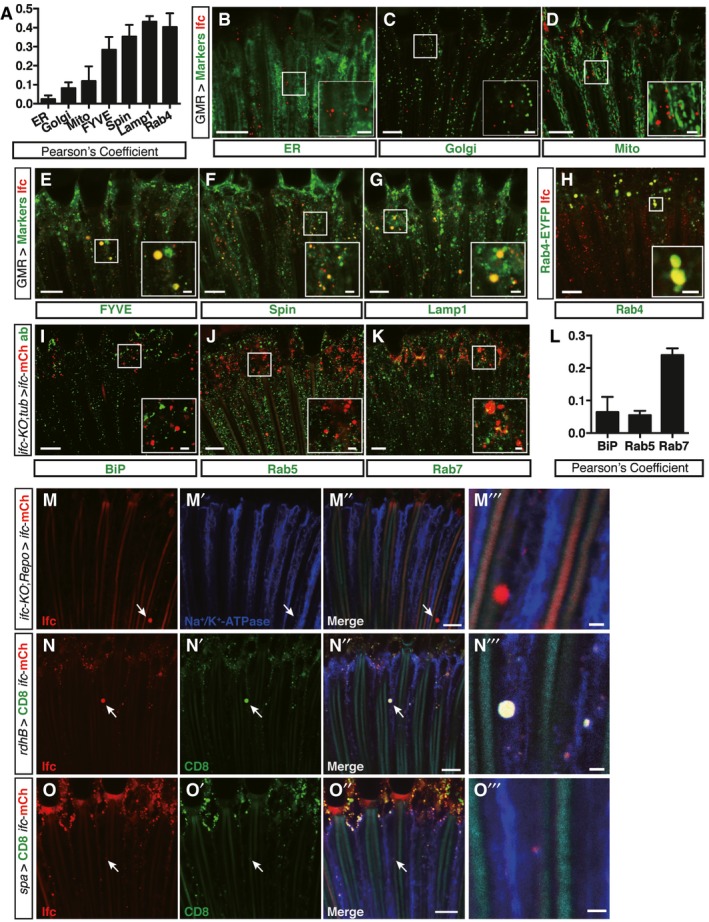
Figure 4. Ifc is mainly detected in the endolysosomal compartments in photoreceptors and can reach photoreceptors when expresses in glial, cone, and pigment cells.
-
A–HEye longitudinal sections of wild‐type flies with transgenic expression of compartmental markers showing transgenic markers (pseudo‐colored in green) and anti‐Ifc staining (red). (A) The degree of colocalization between Ifc and each compartmental marker from (B–H) quantified by Pearson's correlation coefficients. Subcellular compartments were labeled with fluorescent UAS transgenes (expressed by GMR‐Gal4) include KDEL‐RFP for ER (B), galactosyltransferase‐RFP for Golgi (C), Mito‐GFP for mitochondria (D), FYVE‐GFP for endosomes (E), Spin‐GFP (F), and Lamp1‐GFP (G) for late endosome/lysosome, endogenously EYFP‐tagged Rab4 (H) (≥ 1 field/eye from n ≥ 3 each). Scale bars: 10 μm or 2 μm for the magnified insets.
-
I–LEye longitudinal sections showing immunolabelings (green) of BiP for ER (I), Rab5 for early endosomes (J), and Rab7 for late endosomes/autophagosomes (K) in ifc‐KO; tub>ifc‐mCherry eyes. (L) The degrees of colocalization by Pearson's correlation coefficients for (I–K) (≥ 1 field/eye from n ≥ 3 each). Scale bars: 10 μm or 2 μm for the magnified insets.
-
M–O’’’Eye longitudinal sections showing rhabdomeres (Phalloidin, cyan), neuronal membrane (Na+/K+‐ATPase, blue), CD8‐GFP (green), and ifc‐mCherry (red) in ifc‐KO; repo > ifc‐mCherry (M–M’’’, glia‐specific expression), rdhB > CD8‐GFP + ifc‐mCherry (N–N’’’, pigment cell‐specific expression), and spa>CD8‐GFP + ifc‐mCherry (O–O’’’, cone cell‐specific expression). Arrows indicate the ifc‐mCherry puncta found within photoreceptors. Scale bars: 10 μm or 2 μm for the magnified insets.
Because Rab4 regulates recycling endosomes and exocytosis 25, we tested whether Ifc can be transferred between different tissues, which would provide a mechanism for how Ifc overexpression in specific tissues could rescue ifc‐KO larval lethality. In ifc‐KO animal rescued by glial expression of Ifc‐mCherry, mCherry fluorescence was detected in photoreceptors (Fig 4M–M”’). Also, Ifc‐mCherry expressed from cone or pigment cells was detected within photoreceptors (Fig 4N–O”’). These results supports that Ifc can move across cell boundaries and functions cell non‐autonomously.
Activation of lipophagy in ifc‐KO eye
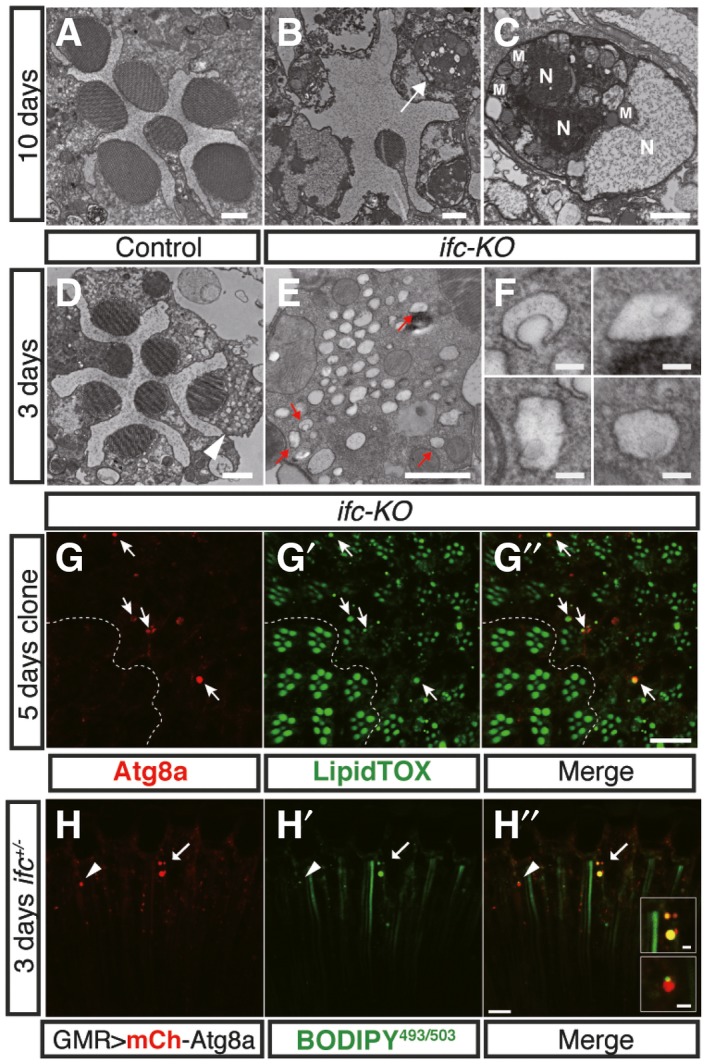
To further characterize the aforementioned defects, we examined the ultrastructure of ifc‐KO photoreceptors using transmission electron microscopy (TEM). After 10 days of light exposure when wild‐type controls showed little morphological change (Fig 5A), ifc‐KO eyes had already shown dramatic rhabdomeric loss (Fig 5B) and prominent apoptotic bodies (Fig 5C). We therefore checked ifc‐KO eyes at earlier times and found that, after 3 days of constant light exposure, we could already identify lipid droplet (LD)‐like structures surrounded by double membranes, reminiscent of lipid‐containing autophagosomes (Fig 5D–F). Transcription of autophagy genes atg1, atg5, atg7, and atg8a was significantly upregulated in ifc‐KO larvae (Fig EV4A), and confocal imaging showed colocalization of the autophagy marker Atg8a with the LD markers LipidTOX in ifc‐KO photoreceptors (Fig 5G–G”) or BODIPY in ifc +/− eyes (Fig 5H–H”). Altogether, lipophagy was activated in ifc‐KO photoreceptors.
Figure 5. Activation of lipophagy in ifc‐KO photoreceptors.
-
A–FTransmission electron microscopy (TEM) of the ifc‐KO eyes after 10‐day (A–C) and 3‐day (D–F) light stimulation. Comparing to wild‐type controls (A) after 10‐day light stimulation, ifc‐KO eyes showed reduced number of rhabdomeres (B) with apoptotic bodies (arrow), which is magnified in (C) to show fragments of nucleus and organelles within the apoptotic body. N, nucleus. M, mitochondria. Lipophagic vesicle‐like structures were detected after 3 days as indicated by arrowheads in (D), magnified in (E) (indicated by red arrows), and further enlarged in (F). Scale bars: 1 μm in (A–E); 100 nm in (F).
-
G–G’’Eye cross sections of ifc‐KO mosaic clones generated by ey‐FLP showing staining of Atg8a (G, red) and LipidTOX (G’, green) after 5‐day light stimulation. Note that Atg8a+ puncta colocalized with LipidTOX+ puncta in ifc‐KO clones (G’’, arrows).
-
H–H’’Eye longitudinal sections showing colocalization of BODIPY493/503 with transgenic expression of mCherry‐Atg8a in ifc +/− eyes after 3‐day light stimulation. The arrowhead and arrow indicate partial and complete colocalization, respectively. Scale bars: 10 μm or 2 μm for the insets in (H”).
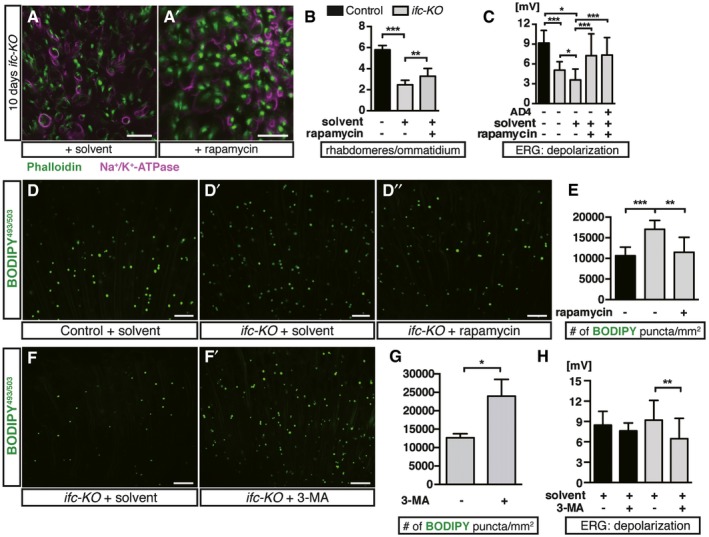
We then interrogated the functional importance of autophagy in photoreceptor degeneration by feeding adult flies with an autophagy inducer or inhibitor. Feeding with rapamycin, an autophagy inducer, alleviated both the morphological and functional declines of ifc‐KO photoreceptors (Fig 6A–C) and decreased the number of BODIPY puncta (Fig 6D’, D” and E) as compared to the solvent‐fed group. In contrast, blocking autophagy by 3‐methyladenine (3‐MA) increased the number of lipid puncta (Fig 6F–G) and sped up the degeneration as shown upon 3 days of light stimulation (Fig 6H). Therefore, enhancing autophagy reduced intracellular accumulation of LDs and protected against light‐induced degeneration of photoreceptors.
Figure 6. Rapamycin rescues the degenerative defects and reduces lipid accumulation of ifc‐KO photoreceptors.
-
A, A’Eye cross sections of ifc‐KO flies fed with rapamycin showing rhabdomeres (Phalloidin, green) and neuronal membrane (Na+/K+‐ATPase, magenta). Flies were fed with rapamycin‐supplemented food (A’) or EtOH solvent control (A) for 10 days post‐eclosion. Scale bars: 10 μm.
-
BRhabdomere counts of (A, A’) (≥ 30 ommatidia/fly from n ≥ 10 each).
-
CAmplitude of ERG depolarization of ifc‐KO flies fed with EtOH, rapamycin, and/or AD4 for 10 days post‐eclosion (n ≥ 15 each).
-
D–D’’Representative confocal longitudinal sections of ifc‐KO photoreceptors showing BODIPY493/503 staining. ifc‐KO flies fed with rapamycin (D’’) or EtOH solvent (D’) compared to control flies fed with EtOH solvent (D) for 3 days since eclosion. Scale bars: 10 μm.
-
EQuantification of BODIPY puncta/mm2 in (D–D’’) (≥ 1 field/eye from n ≥ 6 each).
-
F, F’Representative confocal longitudinal sections of ifc‐KO photoreceptors. ifc‐KO flies were fed with 3‐methyladenine (3‐MA) (F’) or sucrose solvent control (F) for 3 days since eclosion. Scale bars: 10 μm.
-
GQuantification of BODIPY puncta/mm2 in (F, F’) (≥ 1 field/eye from n = 3 each).
-
HAmplitude of ERG depolarization for control and ifc‐KO flies fed with sucrose solvent and/or 3‐MA (n ≥ 11 each).
Lipophagy induction reduced ROS accumulation and prevented photoreceptor degeneration
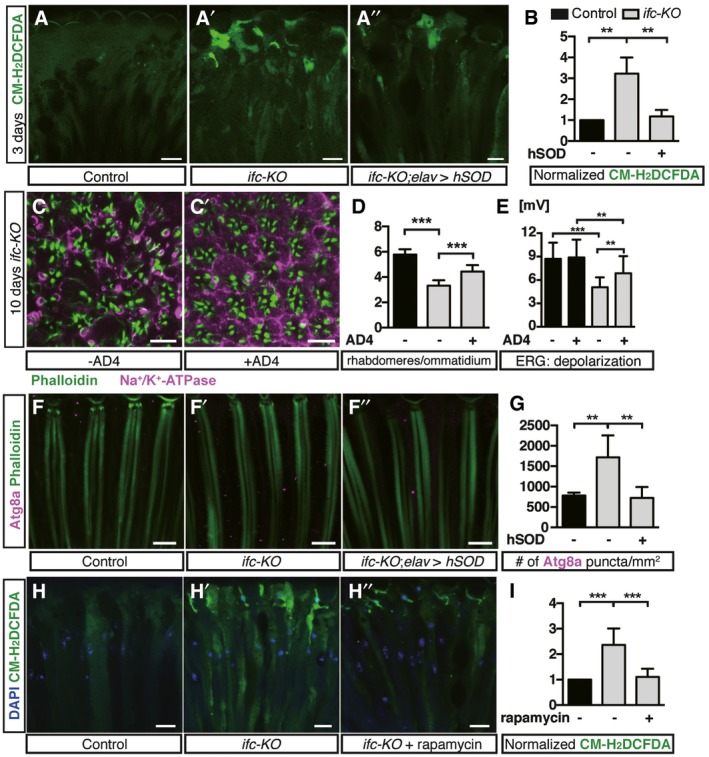
Although DEGS1 inhibition is known to elevate dhCer accumulation and to increase ROS level in cell lines, it is not yet clear whether there are causative links between dhCer accumulation, ROS production, and the subsequent cell death. We found that constant light stimulation increased the levels of ROS in ifc‐KO photoreceptors as measured by CM‐H2DCFDA (Fig 7A and A’), and the expression of ROS responsive genes Cap'N'Collar (cnc) and glutathione S‐transferase D1 (gstD1) was upregulated in ifc‐KO larvae (Fig EV4B). Reducing ROS levels in ifc‐KO flies by ectopic expression of human superoxide dismutase SOD1 (Fig 7A” and B) or feeding with the antioxidant N‐acetylcysteine amide (AD4) significantly restored the functional and morphological degeneration of ifc‐KO eyes caused by light stimulation (Fig 7C–E). Thus, reducing ROS prevented the activity‐dependent neurodegeneration in ifc‐KO photoreceptors. In addition, we did not detect the expression of XBP1‐GFP reporter 26 in ifc‐KO clones (Fig EV4C–E”), suggesting that ER stress response was not induced, which is consistent with a lack detection of Ifc in the ER in ifc‐KO photoreceptors.
Figure 7. ROS induces autophagy while autophagy activation reduces ROS in ifc‐KO photoreceptor.
-
A–A”Longitudinal sections of photoreceptors stained with CM‐H2DCFDA to detect ROS in control (A), ifc‐KO (A’), and ifc‐KO; elav>hSOD (human SOD) (A’’) eyes after 3‐day light stimulation. Scale bars: 10 μm.
-
BQuantification of CM‐H2DCFDA signals in (A–A’’) (≥ 1 field/eye from n = 3 each).
-
C, C’Cross sections of photoreceptors after 10‐day light stimulation in ifc‐KO (C) and ifc‐KO flies fed with AD4 (C’). Scale bars: 10 μm.
-
DRhabdomere counts in (C, C’) (≥ 30 ommatidia/fly from n ≥ 4 each).
-
EAmplitude of ERG depolarization of wild‐type and ifc‐KO flies with or without AD4 (n ≥ 17 flies for each genotype and treatment).
-
F–F”Eye longitudinal sections of control, ifc‐KO, and ifc‐KO; elav > hSOD flies showing rhabdomeres (Phalloidin, green) and Atg8a (magenta). Scale bars: 10 μm.
-
GQuantification of Atg8a puncta/mm2 in (F–F’’) (≥ 1 field/eye from n ≥ 5 each).
-
H–H”The effect of rapamycin on ROS levels in ifc‐KO photoreceptors after 3‐day light stimulation. Nuclei and ROS were labeled with DAPI (blue) and CM‐H2DCFDA (green), respectively. Scale bars: 10 μm.
-
INormalization of CM‐H2DCFDA signals based on controls in (H–H”) (≥ 1 field/eye from n ≥ 4 each).
We then sought to understand the possible interplay between ROS and autophagy. We performed double feeding of rapamycin and AD4 and found similar level of morphological and functional preservation in ifc‐KO photoreceptors as single treatments (Figs 6C and 7E). Removing ROS by hSOD1 expression reduced the number of Atg8a puncta to background levels in ifc‐KO eyes (Fig 7F–G), while AD4 feeding also suppressed the increase in Atg8a puncta in ifc‐KO photoreceptors (Fig EV4F–G). Rapamycin reduces ROS signals to a level comparable to that of wild type (Fig 7H–I). Taken together, ROS increase induced lipophagy, and lipophagy activation can reduce the level of ROS and prevent the activity‐dependent degeneration of ifc‐KO photoreceptors.
DhCer accumulation caused apoptosis in human neuroblastoma cells
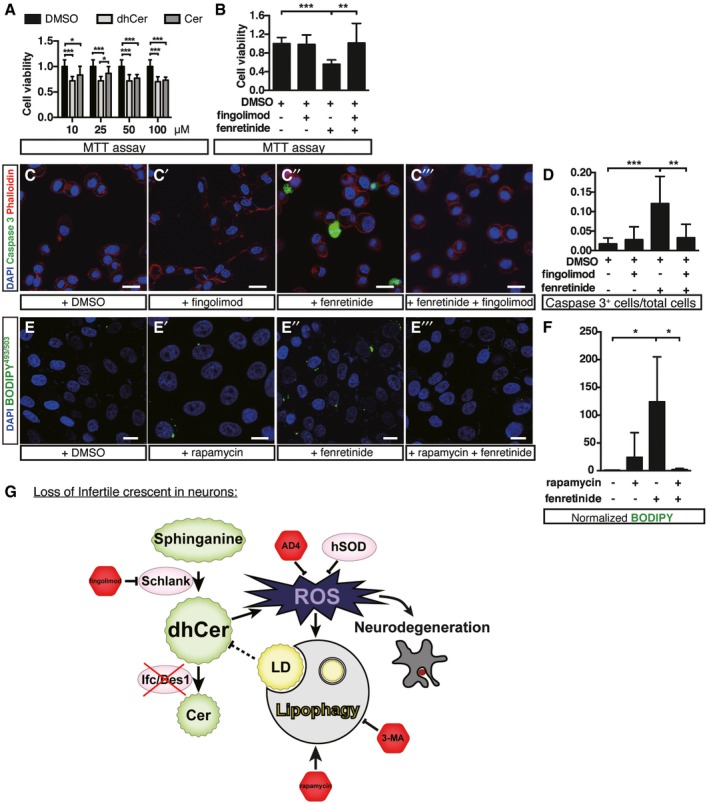
We tested whether the results we showed in Drosophila are conserved in human neuroblastoma SH‐SY5Y cells. Treating cells with dhCer or fenretinide effectively reduced cell viability (Fig 8A and B). Similar to our observations in Drosophila, fenretinide treatment resulted in apoptosis as indicated by increased active caspase‐3 (Fig 8C–D). Concurrently, fenretinide treatment increased the number of lipid droplets, which was reduced by rapamycin (Fig 8E–F). Although high level of fingolimod treatment results in cell death 27, we found that, when SH‐SY5Y cells were treated with a sublethal dose of fingolimod, it reversed the effect of fenretinide and restored cell viability. That is, blocking dhCer production by inhibiting ceramide synthase rescued the deleterious effect of dhCer desaturase inhibition (Fig 8B and D). Our data supported that the cytotoxicity of dhCer accumulation is evolutionarily conserved between fly and human (Fig 8G).
Figure 8. Inhibition of DEGS1 results in dhCer accumulation, apoptosis, and lipid accumulation in human neuroblastoma cells.
-
ACell viability determined by MTT assay under different concentrations of dhCer or Cer. DMSO served as the solvent control.
-
BCell viability by MTT assay after fingolimod and/or fenretinide treatments.
-
C–C’”Representative confocal images of cells showing staining of active caspase‐3 (green), F‐actin (Phalloidin, red), and nuclei (DAPI, blue) in cells treated with DMSO (C, solvent), fingolimod (C’), fenretinide (C’’), or cotreated with fenretinide and fingolimod (C’”). Scale bar: 10 μm.
-
DQuantification of SH‐SY5Y cells that stained positive for active caspase‐3 in (C–C’”).
-
E–E’”Representative confocal images of cells showing staining of BODIPY493/503 (green) and nuclei (DAPI, blue) in cells treated with DMSO (E, solvent), rapamycin (E’), fenretinide (E’’), or rapamycin + fenretinide (E’”). Scale bar: 10 μm.
-
FNormalization of BODIPY signals based on controls in (E–E”’).
-
GProposed model of neurodegeneration in the absence of Ifc.
Discussion
Altered brain sphingolipid levels are noted in neuronal disorders including Niemann‐Pick, Alzheimer's, and Parkinson's diseases 2. Here, we generated a null mutant of Drosophila infertile crescent and examined the neuronal role of dihydroceramide desaturase and the consequence of dhCer accumulation. Since global knockout of ifc led to developmental arrest and lethality, we employed clonal ifc deletion and heterozygous animals, as well as pharmacological Ifc inhibition to study its function in photoreceptor degeneration. Deletion of ifc in photoreceptors resulted in dhCer accumulation, increased ROS, and activity‐dependent neurodegeneration. We demonstrated that ifc‐KO photoreceptor degeneration was due to increased dhCer. Reducing dhCer synthesis by downregulating schlank (ceramide synthase) sufficiently restored defects in ifc‐KO photoreceptor morphology and functions, while supplementing ifc‐KO flies with downstream sphingolipids did not. The findings were confirmed by chemical inhibition of Schlank and Ifc by fingolimod and fenretinide treatments, respectively. DhCer accumulation activated lipophagy in photoreceptors. Further activating lipophagy by rapamycin reduced ROS and lipid droplet levels and alleviated ifc‐KO defects, suggesting lipophagy played a protective role. Additionally, we found that exogenous dhCer reduced the viability of SH‐SY5Y cells, and a sublethal dose of fingolimod reversed fenretinide‐induced apoptosis, reinforcing that toxicity of dhCer accumulation is conserved in human neuroblastoma cells. Further examination of the functional importance of DEGS1 and dhCer especially in the context of the nervous system is needed.
Cell non‐autonomous rescue of dhCer
Our data showed that Ifc is functionally required during larval development in flies. The developmental requirement of Ifc can be supplemented cell non‐autonomously, since ifc‐KO larval lethality was rescued by overexpressing ifc in pan‐neuronal (elav‐Gal4), neuron‐supporting (repo‐Gal4), or muscle tissues (mef2‐Gal4). Cell non‐autonomous rescue has been previously reported in a mutant of Drosophila ceramidase CDase. CDase expression in fat body or mushroom bodies can be detected in retinal tissue and rescues adult CDase mutants that are defective in phototransduction 28. We were able to detect Ifc in photoreceptors when it was transgenically expressed in supportive tissues including glia, cone cells, and pigment cells (Fig 4M–O). However, whole‐eye and random ifc‐KO clones both showed activity‐dependent neurodegeneration, clearly demonstrating that the cell non‐autonomous supply of Ifc from neighboring cells was not sufficient to prevent dhCer accumulation and the subsequent degeneration of adult ifc‐KO photoreceptors. Due to technical difficulties in genetic manipulation, we could not test whether Ifc transgenic overexpression would prevent activity‐dependent degeneration of ifc‐KO eye clones. It is possible that level of Ifc is critical for rescue. Alternatively, comparing to the short developmental process, accumulation of subtle effects of slight insufficiencies in Ifc levels may progress over the long course of neuronal maintenance, resulting in visible phenotypes in adult eyes.
Endosomal localization of Ifc and its cell non‐autonomous functions
Intracellular sphingolipid metabolism is a highly compartmentalized process; the de novo, catabolic, and salvage pathways take place in the ER, Golgi and mitochondria, and endosomes and lysosomes, respectively 29. This compartmentalization results in organelle‐specific pools of sphingolipid species, and coordination of these reactions is variable depending on cell and tissue types. Although it is widely accepted that enzymes involved in ceramide de novo synthesis are present on the ER membrane, few reports actually examined the subcellular localization of DEGS1, and no definitive evidence shows that it resides exclusively in the ER 30. In fact, Beauchamp et al 31 reported DEGS1 activity in both the ER and mitochondria in rat hepatocytes. Murakami et al 32 showed Golgi localization of GFP‐tagged human DEGS1 in yeast cells. Moreover, Novgorodov et al 33 showed that, while neutral ceramidase in most cells is mainly localized to plasma membranes, it shows punctate distribution that is associated with mitochondria, lysosomes, and late endosomes in liver hepatocytes. We showed that while Ifc located mainly in the ER in larval salivary glands, its subcellular localization in adult photoreceptor appeared to differ. Antibody staining against Ifc and fluorescence of a functional Ifc fusion protein showed predominant colocalization with endolysosomal markers. Although we do not argue against a presence of Ifc in the ER, our data demonstrated a previously unknown localization for neuronal Ifc in the endolysosomal compartments and showed that dhCer accumulation did not induce ER stress in Drosophila photoreceptors. Overall, our data supported that neuronal Ifc is functionally important in endosomes in photoreceptors. Further investigation is needed to explore whether DEGS1 localization differs between cell types and decipher the significance of dihydroceramide desaturase functioning in endolysosomes.
Interplay between autophagy/lipophagy and ROS
Several sphingolipid species, including Cer, sphingosine, S1P, and dhCer, can induce autophagy and cell death (reviewed in 34). Depending on the context, inhibiting these enzymes induce protective autophagy, apoptosis, or autophagic cell death. For example, acid sphingomyelinase deficiency impairs autophagy and conveys resistance to hepatic steatosis 35. Losing neutral ceramidase induces autophagy and prevents cell deaths caused by nutrient or energy deprivation 36. Reciprocally, autophagy can also regulate sphingolipid levels 37. In mouse liver, blocking autophagy by deleting Atg7 leads to increased Cer and SPT levels 38. These findings suggest a possible feedback mechanism between sphingolipid levels and autophagy activation. We demonstrated that ifc‐KO leads to dhCer accumulation, which activates autophagy; however, consistent with previous reports, autophagy was not the cause of ifc‐KO photoreceptor death. In contrast, we showed that further activating autophagy reduces ROS levels and lipid droplets, providing protection for ifc‐KO photoreceptors.
Recent studies found that one specialized form of autophagy termed lipophagy can be employed for lipid degradation. Selective degradation of cellular lipids by autophagy, often called lipophagy, plays an important role in energy homeostasis by regulating lipid storage and metabolism 39. Hepatic cells activate lipophagy under starvation to generate free fatty acids (FFA) as an energy source, whereas blocking hepatic autophagy leads to lipid accumulation in vivo and in vitro 39. Defective lipophagy causes lipid droplet accumulation in cellular and mouse models of Huntington's disease 40. Hepatic autophagy has been identified as an important survival mechanism that prevents cell death induced by palmitate accumulation 41. SPT overexpression activates lipophagy and promotes lipid degradation in hepatic cells 38. In these reports, increased saturated free fatty acids such as palmitate inhibit autophagy, likely by preventing lysosomal acidification. Rapamycin treatment reversed autophagy inhibition and alleviated palmitate toxicity in pancreatic B cells. Interestingly, unsaturated FFA oleate does not inhibit autophagy in hepatocytes but inhibits autophagy in pancreatic B cells, indicating cell type specificity 41, 42. Here, we reported that dhCer accumulation increased ROS and induced lipophagy in Drosophila photoreceptors. In this case, lysosomal acidification of autophagosomes occurred normally, and further inducing autophagy by rapamycin lowered ROS levels and promoted the survival and function of rhabdomeres. We currently do not have evidence to show whether accumulated dhCer is selectively targeted for lipophagic degradation, since BODIPY493/503 does not stain dhCer and it does not work for co‐staining with anti‐dhCer antibody. Further analysis is necessary to determine whether accumulated dhCer is selectively targeted for lipophagic degradation, or whether dhCer is degraded via association with the autophagic membrane.
Materials and Methods
Fly stocks and genetics
Fly husbandry was performed at 25°C following standard procedures. w1118 was used as the wild‐type control for all experiments unless otherwise stated. Both dark‐reared and light‐raised flies were kept in the same room, except that the dark‐reared vials were wrapped with aluminum foil. A constant, 600 Lux LED light source was provided for light stimulation.
The ifc knockout flies were generated utilizing the CRISPR/Cas9 system as described in 43 with modifications. Briefly, two pairs of gRNAs were designed to target the 5′ and 3′ UTR regions of ifc locus for removing the entire coding region. The gRNA primers are shown below:
5′UTR‐ifc‐fwd:CTTCGACAGTTTCCTTCCTCGCGC,
5′UTR‐ifc‐rev:AAACGCGCGAGGAAGGAAACTGTC,
3′UTR‐ifc‐fwd:CTTCGCGGATGCAGAAGAAATAAG,
3′UTR‐ifc‐rev: AAAC CTTATTTCTTCTGCATCCGC
The gRNA pairs were cloned into pBFv‐U6.2B, and the construct was injected into P{nos‐phiC31\int.NLS}X; P{CaryP}attP40 (Bloomington #25709) embryos. The transformants were identified following standard phiC31‐mediated germline transmission protocol, and then, they were crossed to P{nos‐Cas9, y+, v+} flies for germline‐specific deletion of ifc. Potential knockout flies from the progeny were identified by complementation tests with two different deficiency lines uncovering ifc locus obtained from the Drosophila Genetic Resource Center (DGRC, #150010 and #150494), Kyoto. The ifc‐KO flies were verified by PCR. The primer set for PCR screen is shown below:
Screen‐ifc‐fwd: TCAGGTCATATTAATTTTTCAATCC
Screen‐ifc‐rev: ATTGTTCATATCAGCCGCTG
Eye‐specific mosaic clones were generated using ey‐FLP on the X chromosome 22. The ifc‐KO chromosome was recombined on an FRT40A chromosome using G418 selection. Whole‐eye clones of ifc‐KO photoreceptors were generated by flipping ifc‐KO against l(2)cl‐2L chromosome (y w eyFLP; ifc‐KO, FRT40A/l(2)cl‐2L P{w + } FRT40A).
Full‐length ifc cDNA was amplified by PCR from a cDNA library of Drosophila heads. To generate UAS‐ifc, ifc cDNA was cloned into the NotI/XhoI sites of pUASt vector. To generate the UAS‐ifc‐mCherry and UAS‐Cyan‐ifc constructs, ifc cDNA was fused with either mCherry sequence at the C terminus or with Cyan sequence at the N terminus by SOEing PCR prior to cloning into the pUASt vector. Full‐length human DEGS1 was obtained from a cDNA library of human liver tissue and was cloned into the NotI/XhoI sites of pUASt vector. All constructs were verified by sequencing. Transgenic flies were generated by embryo injection according to standard protocols of transposase‐mediated insertion followed by germline transmission screen.
For rescue experiments, UAS‐ifc transgenes were introduced on the third chromosome. Rescue experiments were performed by expressing ifc cDNA with tissue‐specific Gal4 drivers (stocks described below). Successful rescue of larval lethality was defined as survival to pupal and adult stages. Three independent crosses were done for each set of experiments, and > 500 flies were counted for each cross. The genotypes of the rescued adult flies were verified by PCR.
For immunostaining, clonal ifc‐KO imaginal discs were generated by FRT‐FLP recombination in conjunction with ubi‐RFP on the wild‐type chromosome (y w eyFLP; ifc‐KO, FRT40A/P{w[+mC] = Ubi‐mRFP.nls}2L, FRT40A). For immunostaining of the adult photoreceptors, the same whole‐eye ifc‐KO clones for rescue experiments were used.
For fly stocks used in the rescue experiments, subcellular compartment characterization, and knockout, below were from the Bloomington Drosophila Stock Center (# indicates stock number): FRT40A (#5615), ey‐FLP; l(2)cl‐L31, FRT40A (#5622), nls‐RFP, FRT40A (#34500), ey‐FLP; GMR‐myr‐mRFP, FRT40A (#7122), tubulin‐Gal4 (#5138), elav‐Gal4 (#8760), repo‐Gal4 (#7415), mef2‐Gal4 (#27390), 71B‐Gal4 (#1747), spa‐Gal4 (#26656), rdhB‐Gal4 (#24501), P{nos‐phiC31\int.NLS}X; P{CaryP}attP40 (#25709), ninaE 17 (rh1 mutant, #5701), UASp‐RFP‐KDEL (#30910), UASp‐Mito‐GFP (#8443), UASp‐RFP‐Golgi (#30902, galactosyltransferase‐RFP), UAS‐GFP‐FYVE (#42712), UAS‐LAMP1‐GFP (#42714), UAS‐Spin‐GFP (#39668), UAS‐XBP1‐GFP (#39719), UAS‐hSOD1 (#33606), UASp‐GFP‐mCherry‐Atg8a (#37749), Rab4‐EYFP (#62542). y2 cho2 v1; P{nos‐Cas9, y+, v+}3A/TM6C, Sb Tb (CAS‐0003) was from the Fly Stock Center of the National Institute of Genetics, Japan. UAS‐schlank‐RNAi (#33896) and UAS‐syx17‐RNAi (#36395) were from the Vienna Drosophila Resource Center.
Immunofluorescence (IF), lipid droplet staining, and imaging
For IF staining, larval eye discs and salivary glands as well as adult retina tissues were dissected in PBS, fixed in 4% paraformaldehyde for 20 min, and then washed in PBS with 0.4% or 0.05% Triton X‐100 (0.05% Triton is used for targeted ectopic Ifc expression from cone or pigment cells). Primary antibodies were incubated in PBS with 0.4% or 0.05% Triton X‐100 overnight at 4°C. Anti‐Ifc polyclonal antibody was raised in rabbits immunized with a synthetic peptide CDFPAVPGSRLPEVKR (amino acid residues 264–278 of Ifc) by GeneTex, Taiwan. Rab7 antibody was generated in rabbits against an epitope described in 44. Dilutions of antibodies used as follows: anti‐Ifc (1:200), anti‐Na+/K+‐ATPase (1:50; Developmental Studies Hybridoma Bank, a5), anti‐dhCer (1:100; Sigma, C8104, 45, 46), anti‐BiP (1:200; StressMarq Biosciences, SPC‐180, 47), anti‐Rab5 (1:200, 48), anti‐Rab7 (1:200), anti‐Atg8a (1:200; Abcam, ab109364), Alexa 488, Alexa 568, or Alexa 647‐conjugated phalloidin (1:100, Thermo Fisher). Goat anti‐mouse or goat anti‐rabbit secondary antibodies (Jackson ImmunoResearch) conjugated with Alexa 488, Alexa 647, Cy3, or Dylight 405 were used at 1:500. For lipid droplet staining, the dissection, fixation, staining, and mounting were performed as described by 49 with modified concentrations of BODIPY493/503 at 4 mM (Thermo Fisher, D3922). LipidTOX staining was performed after immunostaining, and adult retina tissues were washed in PBS with 0.05% Triton X‐100 during immunostaining, followed by three times of washing in PBS to remove the detergent and incubated overnight at 4°C with LipidTOX Deep Red (Thermo Fisher, H34477) at 1:200 dilution. ROS detection was performed following manufacturers’ protocols, with 10 μM of CM‐H2DCFDA (chloromethyl‐2′,7′‐dichlorodihydrofluorescein diacetate, Thermo Fisher, C6827). All IF samples were mounted in Vectashield (Vector Laboratories) and analyzed on a Leica SP5 confocal microscope with LAS AF software. Imaging data were processed and quantified using Photoshop (CS6; Adobe), Illustrator (CS6; Adobe), and ImageJ (National Institutes of Health).
UHPLC‐MS/MS analysis of sphingolipids
Sphingolipid extraction was performed as described 50 with modifications. Briefly, 500 larvae or 350 adult flies (both male and female were equally represented in control and treatment) were snap‐frozen in liquid nitrogen and homogenized by grinding. The homogenate was added to 201 g of methanol/chloroform/water mixture (3:1:1, v/v/v), followed by sonication for 20 min in room temperature. After overnight incubation, the extract was vortexed and centrifuged at 210 g for 10 min. The organic phase was dried by nitrogen stream, and the dried pellet was re‐dissolved in 2 ml of MeOH/water/CHCl3 (96:94:6, v/v) and applied to a Strata C18‐E solid‐phase extraction cartridge (SPE) (Phenomenex Inc., Torrance, CA, US) which was pre‐conditioned with 4 ml water. Two mL of MeOH was then added into the SPE cartridge after sample loading. A 3 ml of MeOH/CHCl3 (1:1, v/v) was added into the SPE cartridge to elute the sphingolipids. The MeOH/CHCl3 eluent was dried by nitrogen stream. The dried extract was reconstituted with 200 μl MeOH containing 100 ng/μl internal standard [ceramide (d18:1/18:0)] for UHPLC‐MS/MS analysis.
The sphingolipids were analyzed by an Agilent 1290 UHPLC system coupled with an Agilent 6460 triple quadruple mass spectrometer (Agilent Technologies, Waldbronn, Germany). An Agilent Eclipse Plus C18 column (100 × 2.1 mm, 1.8 μm) was employed for the separation. The flow rate was 0.3 ml/min. Mobile phase A was consisted of MeOH and a buffer solution containing 0.2% formic acid and 10 mM ammonium acetate (60:40, v/v), and mobile phase B was consisted of MeOH and IPA (60:40, v/v) with the addition of 0.2% formic acid and 10 mM ammonium acetate. The gradient elution program was as the following: 0–3 min: linear gradient from 0 to 35% B; 3–5.5 min: linear gradient from 35 to 55% B; 5.5–8.0 min: linear gradient from 55 to 60% B; 8.0–8.5 min: linear gradient from 60 to 80% B, and kept at 80% B for 2 min; 10.5–16.0 min: linear gradient from 80 to 90% B, and kept at 90% B for 3 min; 19.0–22.0 min: linear gradient from 90 to 100% B, and kept at 100% B for 3 min. The sample reservoir and column oven were maintained at 4°C and 40°C, respectively. The injection volume was 5 μl. Electrospray ionization in the positive mode was employed to analyze sphingolipids with the following parameters: 325°C dry gas temperature, 7 l/min dry gas flow rate, 35 psi nebulizer pressure, 325°C sheath gas temperature, 11 l/min sheath gas flow rate, 4,000 V capillary voltage, and a 500 V nozzle voltage. MS acquisition was executed in multiple reaction monitoring (MRM) mode. The detailed MS transitions measured are shown in Table 1.
Table 1.
The multiple reaction monitoring mass transition for ceramides and dihydroceramides
| Name | Precursor ion (m/z) | Product ion (m/z) |
|---|---|---|
| Sphingosine (d14) | 244.0 | 226.0 |
| Sphinganine (d14) | 246.0 | 228.0 |
| Ceramides | ||
| Ceramide (d18:1/18:0) (IS) | 566.5 | 264.2 |
| Ceramide (d14:1/16:0) | 482.6 | 208.0 |
| Ceramide (d14:1/18:0) | 510.6 | 208.0 |
| Ceramide (d14:1/20:0) | 538.6 | 208.0 |
| Ceramide (d14:1/22:0) | 566.6 | 208.0 |
| Ceramide (d14:1/24:0) | 594.6 | 208.0 |
| Dihydroceramides | ||
| Dihydroceramide (d14:1/16:0) | 484.6 | 210.0 |
| Dihydroceramide (d14:1/18:0) | 512.6 | 210.0 |
| Dihydroceramide (d14:1/20:0) | 540.6 | 210.0 |
| Dihydroceramide (d14:1/22:0) | 568.6 | 210.0 |
| Dihydroceramide (d14:1/24:0) | 596.6 | 210.0 |
Electroretinograms
Electroretinograms were performed as described 51 with the following modifications: Flies were fixed using non‐toxic, generic glue. Both the recording and reference electrodes were filled with 2 M NaCl. Electrode voltage was amplified by an iWorx 404 multichannel recorder (iWorx Systems Inc., NH, USA), filtered through a Warner IE‐210 intracellular microelectrode amplifier (Warner Instrument Co., CT, USA), and recorded using LabScribe2 software by iWorx. Light stimuli were provided as 1 s pulses by a homemade computer‐controlled white LED system. To quantify the depolarizations, all experiments were carried out in triplicate with at least 10 recordings for each genotype and experimental condition per replication.
Chemical treatments of flies
Chemical treatments were performed by feeding. The sphingoid‐based C14‐Ceramide (Abcam, ab144091) and Sphingosine (Sigma, S7049) were dissolved in DMSO and added to standard fly food to the final concentration of 10 μM. Stocks of AD4 (4 mg/ml, Sigma, A0737) and fingolimod (4 mg/ml, Cayman, 11975) in water were added to standard fly food to 40 μg/ml. Rapamycin (LC laboratories, R‐5000) was dissolve in EtOH and added to standard fly food to 20 μM. 3‐MA (Sigma, M9281) feeding was carried out following the protocol described in 52. Briefly, 3‐MA was dissolved in water and mix with sucrose to obtain the solution of 8 mM 3‐MA and 3.25% sucrose. The solution was absorbed onto Kimwipes for drug feeding.
Transmission electron microscopy
Adult compound eyes were dissected and prefixed in 2.5% glutaraldehyde in 100 mM sodium cacodylate buffer (pH 7.3) containing 1% tannic acid at 4°C for at least 24 h. After washing in buffer, specimens were post‐fixed with 1% osmium tetroxide in 100 mM sodium cacodylate buffer at room temperature for 1 h. Specimens were then stained en bloc with 2% aqueous uranyl acetate for 1 h and dehydrated through a graded ethanol series into 100% acetone. Specimens were infiltrated with Spurr's resin overnight and embedded with a flat silicone embedding mold. Ultrathin sections were cut with a diamond knife on a Leica Ultracut R ultramicrotome (Leica, Heerbrugg, Switzerland) and collected on Formvar‐coated single‐slot grids. Sections were examined in a Hitachi H‐7500 transmission electron microscope (Hitachi, Tokyo, Japan) at 80 kV. Images were taken with a 2,048 × 2,048 Macrofire monochrome CCD camera (Optronics, Goleta, CA, USA).
Quantitative real‐time PCR
Total RNA samples from larvae (48 h after hatching) were isolated following manufacturer's instruction (Qiagen RNeasy), reverse‐transcribed with Superscript III reverse transcriptase (Invitrogen), and then used for qRT–PCR analyses. qRT–PCR was performed with Maxima SYBR Green/ROX qPCR master mix (Fermentas) using 7300 Real‐Time PCR System (Applied Biosystems). Each sample was run in technical triplicates, and the average values for each sample were normalized. Each result represents three independent experiments, and error bar denotes the SEM. The primers used are indicated in Table 2.
Table 2.
Quantitative real‐time PCR primers
| Gene | Primer sequence |
|---|---|
| ifc | Forward: 5′‐ACCGTGGTGCAGCTAACTTTC‐3′ |
| Reverse: 5′‐GCCCTTGGCGAACATGTAGT‐3′ | |
| atg1 | Forward: 5′‐GCTTCTTTGTTCACCGCTTC‐3′ |
| Reverse: 5′‐GCTTGACCAGCTTCAGTTCC‐3′ | |
| atg5 | Forward: 5′‐GAACCGTATGGCGATTTGGA‐3′ |
| Reverse: 5′‐TGTCGATAATTCGGCCATTAAA‐3′ | |
| atg7 | Forward: 5′‐GACACGACCCGGAGTATCCA‐3′ |
| Reverse: 5′‐TCCTCGTCGCTATCGGACAT‐3′ | |
| atg8a | Forward: 5′‐AGTCCCAAAAGCAAACGAAG‐3′ |
| Reverse: 5′‐TTGTCCAAATCACCGATGC‐3′ | |
| atg8b | Forward: 5′‐AATGTGATCCCACCGACATC‐3′ |
| Reverse: 5′‐TTGAGCGAGTAGTGCCAATG‐3′ | |
| cnc | Forward: 5′‐AGCGCATCTCGAACAAGTTTG‐3′ |
| Reverse: 5′‐CCTCGGACTTTTCACGTGGTA‐3′ | |
| gstD1 | Forward: 5′‐TCGACATGGGAACGCTGTAC‐3′ |
| Reverse: 5′‐GGAAGGTGTTCAGGAACTCGAA‐3′ | |
| puckered | Forward: 5′‐CAAGCAGCAGCGTGGCATC‐3′ |
| Reverse: 5′‐CATGGTGTTTGGGATGGGTG‐3′ | |
| GAPDH | Forward: 5′‐GACGAAATCAAGGCTAAGGTCG‐3′ |
| Reverse: 5′‐AATGGGTGTCGCTGAAGAAGTC‐3′ |
Cell culture, MTT assay, and anti‐caspase‐3 staining
Human neuroblastoma SH‐SY5Y cells were maintained at a density of 1 × 10⁴ cells per well in DMEM/F12 medium containing 10% FBS, 100 U/ml penicillin, and 100 μg/ml streptomycin. Cells were starved in serum‐free medium for 24 h prior to the addition of Cer (Sigma, A7191), dhCer (Sigma, C7980), fingolimod (5 μM, Cayman, 11975), or fenretinide (10 μM, Tocris Bioscience, 1396).
MTT assay was performed as an indicator of cell viability. Briefly, MTT (3‐(4,5‐dimethylthiazol‐2‐yl)‐2,5‐diphenyltetrazolium bromide, Sigma) was added to each well of SH‐SY5Y cells in fresh media, to a final concentration of 0.5 mg/ml, and incubated for 1 h at 37°C. After removal of the media, 100 μl DMSO (dimethyl sulfoxide) was added to each well for 10 min to dissolve the crystals of formazan. The absorbance of each sample was measured at 570 nm in a microplate reader (BioTeK PowerWave XS, VT, USA). For anti‐active caspase‐3 staining, SH‐SY5Y cells were fixed with 4% paraformaldehyde and incubated in blocking solution (1% BSA, 0.1% Triton X‐100 in PBS) for 1 h at room temperature. The samples were then incubated overnight at 4°C with anti‐active caspase‐3 primary antibody (1:1,000, Abcam, 13847), washed, followed by incubation with goat anti‐rabbit secondary antibodies conjugated with Alexa 488 (1:500, Jackson ImmunoResearch), Alexa 568‐conjugated Phalloidin (1:500, Thermo Fisher), and DAPI (1:500, Thermo Fisher). Samples were mounted in Vectashield and observed under confocal.
Statistical analysis
All data in bar graphs were expressed as the mean ± SD. Statistical significance between groups was determined using Student's t‐test or one‐way ANOVA with multiple comparisons: * indicates P < 0.05; ** indicates P < 0.01; *** indicates P < 0.001.
Author contributions
W‐HJ, C‐CL, and Y‐LY performed all fly genetic crosses and feeding experiments. C‐CL, Y‐LY, and Y‐CC performed confocal imaging. W‐YL mostly worked on the cell culture experiments. H‐CC and C‐HK performed the sphingolipidomic analysis. H‐CH performed the TEM experiment. S‐YH and C‐CC contributed to overall design and wrote the manuscript along with other authors. All authors discussed the results and commented on the manuscript.
Conflict of interest
The authors declare that they have no conflict of interest.
Supporting information
Expanded View Figures PDF
Review Process File
Acknowledgements
We would like to thank Dr. Hugo Bellen, the Blooming Stock Center, the Drosophila Genetic Resource Center at Kyoto Institute of Technology, the Fly Stock Center of National Institute of Genetics, and the Developmental Studies Hybridoma Bank for reagents. We thank Drs. Robin Hiesinger, Helmut Kramer, Tzu‐Yang Lin, Jenifer Jin, and all members of the Chan laboratory for critical comments on this manuscript. We further thank Shih‐Ching Lin, the Metabolomics Core Lab, and the Imaging Core of the First Core Labs at NTU College of Medicine for technical assistance. This work was supported by grants from the Ministry of Science and Technology of Taiwan (MOST 103‐2320‐B‐002‐025, 104‐2321‐B‐002‐069, 104‐2311‐B‐002‐017‐MY3), and National Taiwan University (NTU 103R39012 and 105R76273) to C.‐C.C.
EMBO Reports (2017) 18: 1150–1165
References
- 1. Hannun YA, Obeid LM (2008) Principles of bioactive lipid signalling: lessons from sphingolipids. Nat Rev Mol Cell Biol 9: 139–150 [DOI] [PubMed] [Google Scholar]
- 2. Pralhada Rao R, Vaidyanathan N, Rengasamy M, Mammen Oommen A, Somaiya N, Jagannath MR (2013) Sphingolipid metabolic pathway: an overview of major roles played in human diseases. J Lipids 2013: 178910 [DOI] [PMC free article] [PubMed] [Google Scholar]
- 3. Giusto NM, Roque ME, Ilincheta de Boschero MG (1992) Effects of aging on the content, composition and synthesis of sphingomyelin in the central nervous system. Lipids 27: 835–839 [DOI] [PubMed] [Google Scholar]
- 4. Dawkins JL, Hulme DJ, Brahmbhatt SB, Auer‐Grumbach M, Nicholson GA (2001) Mutations in SPTLC1, encoding serine palmitoyltransferase, long chain base subunit‐1, cause hereditary sensory neuropathy type I. Nat Genet 27: 309–312 [DOI] [PubMed] [Google Scholar]
- 5. Vanni N, Fruscione F, Ferlazzo E, Striano P, Robbiano A, Traverso M, Sander T, Falace A, Gazzerro E, Bramanti P, et al (2014) Impairment of ceramide synthesis causes a novel progressive myoclonus epilepsy. Ann Neurol 76: 206–212 [DOI] [PubMed] [Google Scholar]
- 6. Zhao L, Spassieva SD, Jucius TJ, Shultz LD, Shick HE, Macklin WB, Hannun YA, Obeid LM, Ackerman SL (2011) A deficiency of ceramide biosynthesis causes cerebellar purkinje cell neurodegeneration and lipofuscin accumulation. PLoS Genet 7: e1002063 [DOI] [PMC free article] [PubMed] [Google Scholar]
- 7. Cutler RG, Kelly J, Storie K, Pedersen WA, Tammara A, Hatanpaa K, Troncoso JC, Mattson MP (2004) Involvement of oxidative stress‐induced abnormalities in ceramide and cholesterol metabolism in brain aging and Alzheimer's disease. Proc Natl Acad Sci USA 101: 2070–2075 [DOI] [PMC free article] [PubMed] [Google Scholar]
- 8. Yadav RS, Tiwari NK (2014) Lipid integration in neurodegeneration: an overview of Alzheimer's disease. Mol Neurobiol 50: 168–176 [DOI] [PubMed] [Google Scholar]
- 9. Ahn EH, Schroeder JJ (2010) Induction of apoptosis by sphingosine, sphinganine, and C(2)‐ceramide in human colon cancer cells, but not by C(2)‐dihydroceramide. Anticancer Res 30: 2881–2884 [PubMed] [Google Scholar]
- 10. Qin J, Berdyshev E, Goya J, Natarajan V, Dawson G (2010) Neurons and oligodendrocytes recycle sphingosine 1‐phosphate to ceramide: significance for apoptosis and multiple sclerosis. J Biol Chem 285: 14134–14143 [DOI] [PMC free article] [PubMed] [Google Scholar]
- 11. Pattingre S, Bauvy C, Carpentier S, Levade T, Levine B, Codogno P (2009) Role of JNK1‐dependent Bcl‐2 phosphorylation in ceramide‐induced macroautophagy. J Biol Chem 284: 2719–2728 [DOI] [PMC free article] [PubMed] [Google Scholar]
- 12. Siddique MM, Li Y, Chaurasia B, Kaddai VA, Summers SA (2015) Dihydroceramides: from bit players to lead actors. J Biol Chem 290: 15371–15379 [DOI] [PMC free article] [PubMed] [Google Scholar]
- 13. Kraveka JM, Li L, Szulc ZM, Bielawski J, Ogretmen B, Hannun YA, Obeid LM, Bielawska A (2007) Involvement of dihydroceramide desaturase in cell cycle progression in human neuroblastoma cells. J Biol Chem 282: 16718–16728 [DOI] [PMC free article] [PubMed] [Google Scholar]
- 14. Holland WL, Brozinick JT, Wang LP, Hawkins ED, Sargent KM, Liu Y, Narra K, Hoehn KL, Knotts TA, Siesky A, et al (2007) Inhibition of ceramide synthesis ameliorates glucocorticoid‐, saturated‐fat‐, and obesity‐induced insulin resistance. Cell Metab 5: 167–179 [DOI] [PubMed] [Google Scholar]
- 15. Barbarroja N, Rodriguez‐Cuenca S, Nygren H, Camargo A, Pirraco A, Relat J, Cuadrado I, Pellegrinelli V, Medina‐Gomez G, Lopez‐Pedrera C, et al (2015) Increased dihydroceramide/ceramide ratio mediated by defective expression of degs1 impairs adipocyte differentiation and function. Diabetes 64: 1180–1192 [DOI] [PMC free article] [PubMed] [Google Scholar]
- 16. Jiang L, Pan X, Chen Y, Wang K, Du Y, Zhang J (2011) Preferential involvement of both ROS and ceramide in fenretinide‐induced apoptosis of HL60 rather than NB4 and U937 cells. Biochem Biophys Res Commun 405: 314–318 [DOI] [PubMed] [Google Scholar]
- 17. Signorelli P, Munoz‐Olaya JM, Gagliostro V, Casas J, Ghidoni R, Fabrias G (2009) Dihydroceramide intracellular increase in response to resveratrol treatment mediates autophagy in gastric cancer cells. Cancer Lett 282: 238–243 [DOI] [PubMed] [Google Scholar]
- 18. Apraiz A, Idkowiak‐Baldys J, Nieto‐Rementeria N, Boyano MD, Hannun YA, Asumendi A (2012) Dihydroceramide accumulation and reactive oxygen species are distinct and nonessential events in 4‐HPR‐mediated leukemia cell death. Biochem Cell Biol 90: 209–223 [DOI] [PMC free article] [PubMed] [Google Scholar]
- 19. Noack J, Choi J, Richter K, Kopp‐Schneider A, Regnier‐Vigouroux A (2014) A sphingosine kinase inhibitor combined with temozolomide induces glioblastoma cell death through accumulation of dihydrosphingosine and dihydroceramide, endoplasmic reticulum stress and autophagy. Cell Death Dis 5: e1425 [DOI] [PMC free article] [PubMed] [Google Scholar]
- 20. Hernández‐Tiedra S, Fabrias G, Davila D, Salanueva IJ, Casas J, Montes LR, Anton Z, Garcia‐Taboada E, Salazar‐Roa M, Lorente M, et al (2016) Dihydroceramide accumulation mediates cytotoxic autophagy of cancer cells via autolysosome destabilization. Autophagy 12: 2213–2229 [DOI] [PMC free article] [PubMed] [Google Scholar]
- 21. Weidberg H, Shvets E, Elazar Z (2009) Lipophagy: selective catabolism designed for lipids. Dev Cell 16: 628–630 [DOI] [PubMed] [Google Scholar]
- 22. Newsome TP, Asling B, Dickson BJ (2000) Analysis of Drosophila photoreceptor axon guidance in eye‐specific mosaics. Development 127: 851–860 [DOI] [PubMed] [Google Scholar]
- 23. Bauer R, Voelzmann A, Breiden B, Schepers U, Farwanah H, Hahn I, Eckardt F, Sandhoff K, Hoch M (2009) Schlank, a member of the ceramide synthase family controls growth and body fat in Drosophila . EMBO J 28: 3706–3716 [DOI] [PMC free article] [PubMed] [Google Scholar]
- 24. Michel C, van Echten‐Deckert G, Rother J, Sandhoff K, Wang E, Merrill AH Jr (1997) Characterization of ceramide synthesis. A dihydroceramide desaturase introduces the 4,5‐trans‐double bond of sphingosine at the level of dihydroceramide. J Biol Chem 272: 22432–22437 [DOI] [PubMed] [Google Scholar]
- 25. D'Angelo G, Matusek T, Pizette S, Therond PP (2015) Endocytosis of Hedgehog through dispatched regulates long‐range signaling. Dev Cell 32: 290–303 [DOI] [PubMed] [Google Scholar]
- 26. Sone M, Zeng X, Larese J, Ryoo HD (2013) A modified UPR stress sensing system reveals a novel tissue distribution of IRE1/XBP1 activity during normal Drosophila development. Cell Stress Chaperones 18: 307–319 [DOI] [PMC free article] [PubMed] [Google Scholar]
- 27. Chen L, Luo LF, Lu J, Li L, Liu YF, Wang J, Liu H, Song H, Jiang H, Chen SJ, et al (2014) FTY720 induces apoptosis of M2 subtype acute myeloid leukemia cells by targeting sphingolipid metabolism and increasing endogenous ceramide levels. PLoS One 9: e103033 [DOI] [PMC free article] [PubMed] [Google Scholar]
- 28. Acharya JK, Dasgupta U, Rawat SS, Yuan C, Sanxaridis PD, Yonamine I, Karim P, Nagashima K, Brodsky MH, Tsunoda S, et al (2008) Cell‐nonautonomous function of ceramidase in photoreceptor homeostasis. Neuron 57: 69–79 [DOI] [PMC free article] [PubMed] [Google Scholar]
- 29. Zhou K, Blom T (2015) Trafficking and functions of bioactive sphingolipids: lessons from cells and model membranes. Lipid Insights 8: 11–20 [DOI] [PMC free article] [PubMed] [Google Scholar]
- 30. Cadena DL, Kurten RC, Gill GN (1997) The product of the MLD gene is a member of the membrane fatty acid desaturase family: overexpression of MLD inhibits EGF receptor biosynthesis. Biochemistry 36: 6960–6967 [DOI] [PubMed] [Google Scholar]
- 31. Beauchamp E, Tekpli X, Marteil G, Lagadic‐Gossmann D, Legrand P, Rioux V (2009) N‐Myristoylation targets dihydroceramide Delta4‐desaturase 1 to mitochondria: partial involvement in the apoptotic effect of myristic acid. Biochimie 91: 1411–1419 [DOI] [PubMed] [Google Scholar]
- 32. Murakami S, Shimamoto T, Nagano H, Tsuruno M, Okuhara H, Hatanaka H, Tojo H, Kodama Y, Funato K (2015) Producing human ceramide‐NS by metabolic engineering using yeast Saccharomyces cerevisiae . Sci Rep 5: 16319 [DOI] [PMC free article] [PubMed] [Google Scholar]
- 33. Novgorodov SA, Wu BX, Gudz TI, Bielawski J, Ovchinnikova TV, Hannun YA, Obeid LM (2011) Novel pathway of ceramide production in mitochondria: thioesterase and neutral ceramidase produce ceramide from sphingosine and acyl‐CoA. J Biol Chem 286: 25352–25362 [DOI] [PMC free article] [PubMed] [Google Scholar]
- 34. Young MM, Kester M, Wang HG (2013) Sphingolipids: regulators of crosstalk between apoptosis and autophagy. J Lipid Res 54: 5–19 [DOI] [PMC free article] [PubMed] [Google Scholar]
- 35. Fucho R, Martinez L, Baulies A, Torres S, Tarrats N, Fernandez A, Ribas V, Astudillo AM, Balsinde J, Garcia‐Roves P, et al (2014) ASMase regulates autophagy and lysosomal membrane permeabilization and its inhibition prevents early stage non‐alcoholic steatohepatitis. J Hepatol 61: 1126–1134 [DOI] [PMC free article] [PubMed] [Google Scholar]
- 36. Sundaram K, Mather AR, Marimuthu S, Shah PP, Snider AJ, Obeid LM, Hannun YA, Beverly LJ, Siskind LJ (2016) Loss of neutral ceramidase protects cells from nutrient‐ and energy ‐deprivation‐induced cell death. Biochem J 473: 743–755 [DOI] [PMC free article] [PubMed] [Google Scholar]
- 37. Harvald EB, Olsen AS, Faergeman NJ (2015) Autophagy in the light of sphingolipid metabolism. Apoptosis 20: 658–670 [DOI] [PMC free article] [PubMed] [Google Scholar]
- 38. Alexaki A, Gupta SD, Majumder S, Kono M, Tuymetova G, Harmon JM, Dunn TM, Proia RL (2014) Autophagy regulates sphingolipid levels in the liver. J Lipid Res 55: 2521–2531 [DOI] [PMC free article] [PubMed] [Google Scholar]
- 39. Singh R, Kaushik S, Wang Y, Xiang Y, Novak I, Komatsu M, Tanaka K, Cuervo AM, Czaja MJ (2009) Autophagy regulates lipid metabolism. Nature 458: 1131–1135 [DOI] [PMC free article] [PubMed] [Google Scholar]
- 40. Martinez‐Vicente M, Talloczy Z, Wong E, Tang G, Koga H, Kaushik S, de Vries R, Arias E, Harris S, Sulzer D, et al (2010) Cargo recognition failure is responsible for inefficient autophagy in Huntington's disease. Nat Neurosci 13: 567–576 [DOI] [PMC free article] [PubMed] [Google Scholar]
- 41. Mei S, Ni HM, Manley S, Bockus A, Kassel KM, Luyendyk JP, Copple BL, Ding WX (2011) Differential roles of unsaturated and saturated fatty acids on autophagy and apoptosis in hepatocytes. J Pharmacol Exp Ther 339: 487–498 [DOI] [PMC free article] [PubMed] [Google Scholar]
- 42. Las G, Serada SB, Wikstrom JD, Twig G, Shirihai OS (2011) Fatty acids suppress autophagic turnover in beta‐cells. J Biol Chem 286: 42534–42544 [DOI] [PMC free article] [PubMed] [Google Scholar]
- 43. Kondo S, Ueda R (2013) Highly improved gene targeting by germline‐specific Cas9 expression in Drosophila . Genetics 195: 715–721 [DOI] [PMC free article] [PubMed] [Google Scholar]
- 44. Tanaka T, Nakamura A (2008) The endocytic pathway acts downstream of Oskar in Drosophila germ plasm assembly. Development 135: 1107–1117 [DOI] [PubMed] [Google Scholar]
- 45. Krishnamurthy K, Dasgupta S, Bieberich E (2007) Development and characterization of a novel anti‐ceramide antibody. J Lipid Res 48: 968–975 [DOI] [PubMed] [Google Scholar]
- 46. Cowart LA, Szulc Z, Bielawska A, Hannun YA (2002) Structural determinants of sphingolipid recognition by commercially available anti‐ceramide antibodies. J Lipid Res 43: 2042–2048 [DOI] [PubMed] [Google Scholar]
- 47. Coelho DS, Cairrao F, Zeng X, Pires E, Coelho AV, Ron D, Ryoo HD, Domingos PM (2013) Xbp1‐independent Ire1 signaling is required for photoreceptor differentiation and rhabdomere morphogenesis in Drosophila . Cell Rep 5: 791–801 [DOI] [PMC free article] [PubMed] [Google Scholar]
- 48. Wucherpfennig T, Wilsch‐Brauninger M, Gonzalez‐Gaitan M (2003) Role of Drosophila Rab5 during endosomal trafficking at the synapse and evoked neurotransmitter release. J Cell Biol 161: 609–624 [DOI] [PMC free article] [PubMed] [Google Scholar]
- 49. Liu L, Zhang K, Sandoval H, Yamamoto S, Jaiswal M, Sanz E, Li Z, Hui J, Graham BH, Quintana A, et al (2015) Glial lipid droplets and ROS induced by mitochondrial defects promote neurodegeneration. Cell 160: 177–190 [DOI] [PMC free article] [PubMed] [Google Scholar]
- 50. Merrill AH, Sullards MC, Allegood JC, Kelly S, Wang E (2005) Sphingolipidomics: high‐throughput, structure‐specific, and quantitative analysis of sphingolipids by liquid chromatography tandem mass spectrometry. Methods 36: 207–224 [DOI] [PubMed] [Google Scholar]
- 51. Cherry S, Jin EJ, Ozel MN, Lu Z, Agi E, Wang D, Jung WH, Epstein D, Meinertzhagen IA, Chan CC, et al (2013) Charcot‐marie‐tooth 2B mutations in rab7 cause dosage‐dependent neurodegeneration due to partial loss of function. Elife 2: e01064 [DOI] [PMC free article] [PubMed] [Google Scholar]
- 52. Lee YM, Sun YH (2015) Maintenance of glia in the optic lamina is mediated by EGFR signaling by photoreceptors in adult Drosophila . PLoS Genet 11: e1005187 [DOI] [PMC free article] [PubMed] [Google Scholar]
Associated Data
This section collects any data citations, data availability statements, or supplementary materials included in this article.
Supplementary Materials
Expanded View Figures PDF
Review Process File