

Abstract
Epithelial-mesenchymal transition (EMT) is an early and key process in the metastatic cascade during the progression of colorectal cancer (CRC). The aim of the present study was to identify deregulated EMT-related microRNAs (miRNAs/miRs) of CRC and assess the effect of differentially expressed miRNAs on the prognosis of patients with CRC. Genome-wide expression profiling of miRNAs was assessed in 3 EMT-negative and 3 EMT-positive CRC tissues. Differentially expressed miRNA was further validated in 90 pairs of CRC and corresponding paracarcinoma tissues using the reverse transcription-quantitative polymerase chain reaction (RT-qPCR). A total of 6 miRNAs (miR-10a-5p miR-204-3p, miR-1224-3p, miR-193a-3p, miR-365a-3p and miR-3678-3p) were identified to be differentially expressed between different EMT statuses of CRC tissues. Following validation using RT-qPCR, 3 miRNAs (miR-10a-5p, miR-365a-3p and miR-193a-3p) were selected for subsequent studies. The expression levels of miR-10a-5p, miR-193a-3p and miR-365a-3p were markedly increased compared with levels in corresponding paracarcinoma tissues. Survival analyses revealed that down-regulation of miR-193a-3p was associated with worse prognosis of patients with CRC, particularly in female and older patients. The results of the present study indicate that miR-193a-3p may be an EMT-related biomarker and serve as a novel prognostic factor for CRC.
Keywords: microRNA, expression profile, microRNA-193a-3p, colorectal cancer, prognosis
Introduction
Colorectal cancer (CRC) is one of the most common types of cancer worldwide, ranking third among males and second among females (1). In 2012, 1,360,602 (9.7%) novel cases were diagnosed and 693,993 (10.9%) mortalities were attributed to CRC worldwide (1). There have been improvements in the diagnosis and therapy of this disease; however, the majority of CRC patients present with recurrence and metastasis, accompanied by a poor prognosis and a low survival rate (2–4). Invasion and metastasis are the most important causes of CRC treatment failure and mortality, therefore previous research has focused on decreasing invasion and metastasis of CRC.
A phenomenon known as epithelial-mesenchymal transition (EMT) has been identified as an early and key process that is associated with progression and metastasis in multiple epithelial cancer types, including CRC (5). The loss of epithelial markers [including epithelial (E-) cadherin] often occurs during EMT. E-cadherin is an important adhesion molecule in cell-cell adhesion in epithelial cells. E-cadherin-catenin complexes are able to decrease tumor cell invasion and metastasis, and inhibit tumor cell proliferation. Structural changes and aberrant expression of E-cadherin are able to induce cell detachment and migration. Previous studies have identified that E-cadherin may serve as a significant prognostic indicator in cancer (6,7). It has also been identified that the expression level of E-cadherin was significantly decreased in CRC (8,9). Aberrant expression of E-cadherin was considered to be associated with vascular invasion, lymph node metastasis and tumor differentiation (8,9).
MicroRNAs (miRNAs/miRs) are endogenous small RNAs of 18–23 nucleotides that regulate gene expression in plants and animals. A number of miRNAs have been investigated and identified to be involved in CRC (10–14). The role of miRNAs in tumor metastasis has been gradually uncovered in previous studies (15,16). However, research into the association between E-cadherin and miRNAs, and the potential risk prediction of EMT-associated miRNAs in CRC has been limited. The aim of the present study was to identify differentially expressed miRNAs associated with E-cadherin expression in CRC tissues using microarray analysis. The reverse transcription-quantitative polymerase chain reaction (RT-qPCR) was used to verify the results of the microarray analysis. Differentially expressed miRNAs were further evaluated in 90 CRC tissues to investigate the potential association between their expression and clinicopathological parameters and prognosis in CRC.
Materials and methods
Patients
A total of 96 patients with CRC were recruited for the present study. Patients from Taizhou People's Hospital (Taizhou, China) were pathologically diagnosed with CRC and underwent surgical resection between July 2006 and May 2007. Formalin-fixed paraffin-embedded tissues were stored in the Biobank at the National Engineering Center for Biochip at Shanghai (Shanghai, China). Of the 96 cases, 3 E-cadherin-negative and 3 E-cadherin-positive CRC tissues were used for miRNA microarray analysis. A total of 90 patients were used for further analysis on the association between miRNA expression and clinicopathological characteristics. The expression of E-cadherin was investigated using a monoclonal anti-E-cadherin (cat. no. IR05961; 1:100; Dako; Agilent Technologies, Inc., Santa Clara, CA, USA) on the Ventana Discovery-Ultra automated immunostainer (Ventana Medical Systems Inc., Tuczon, AZ, USA) according to the manufacturer's instructions. Furthermore, no patient received chemotherapy or radiotherapy treatment prior to surgery. In addition, 90 matched paracarcinoma tissues were collected at the same time and the sampling point was >5 cm from the tumor margin. The endpoint of the present study was overall survival. All patients provided written informed consent, and the present study was approved by the Committees of Taizhou People's Hospital (Taizhou, China) and the National Engineering Center for Biochip at Shanghai. CRC staging was according to the tumor-node-metastasis (TNM) system as described previously (17).
RNA extraction
The extraction of total RNA from formalin-fixed paraffin-embedded tissues was performed using a RecoverAll™ Total Nucleic Acid Isolation kit (Ambion; Thermo Fisher Scientific, Inc., Waltham, MA, USA), according to the manufacturer's protocol.
The samples were deparaffinized by adding 1.0 ml xylene, followed by incubation for 5 min at 50°C, and centrifugation for 5 min at maximum speed. Next, the supernatant was discarded, and the pellet was washed twice with 1.0 ml absolute ethanol for rehydration. The proteins were degraded with 200 µl digestion buffer and 5 µl protease, followed by incubation for 15 min at 50°C and for 15 min at 80°C. Subsequently, RNA was isolated by adding 790 µl buffer from the RecoverAll™ Total Nucleic Acid Isolation kit along with passage through a purification column. The column was then washed twice with a buffer from the kit, and DNase treatment was performed, followed by two additional washing steps. Finally, RNA was eluted in 60 µl of elution buffer from the kit at room temperature. RNA quantity and purity were determined using a NanoDrop ND-1000 Spectrophotometer (NanoDrop Technologies; Thermo Fisher Scientific, Inc.).
miRNA microarray analysis
miRNA microarray assays were performed using a human miRNA microarray (8×60K; Design ID: 046064) (Agilent Technologies, Inc.) according to the manufacturer's protocol. Microarray assays were performed for 3 E-cadherin-negative and 3 E-cadherin-positive CRC tissues from 6 patients with CRC. Total RNA was dephosphorylated using calf intestinal alkaline phosphatase, denatured with dimethylsulfoxide, and labeled with cyanine 3-conjugated cytidine-5′-phosphate-3′-(6-aminohexyl) phosphate with T4 RNA ligase using a miRNA Complete Labeling and Hybridization kit (Agilent Technologies, Inc.). Probes were hybridized at 55°C for 20 h with rotation. The slides were washed with Gene Expression wash buffer 1 (Gene Expression Wash Pack buffer kit; Agilent Technologies, Inc.) at room temperature for 5 min and subsequently with Gene Expression wash buffer 2 at 37°C for 5 min. Following hybridization and washing, the microarray was scanned using an miRNA scanner (Agilent Technologies, Inc.). Images were captured using Feature Extraction software (version 10.7.3.1; Agilent Technologies, Inc.) and data were analyzed using GeneSpring GX software (version 10.0.2; Agilent Technologies, Inc.). Differences in miRNA expression between E-cadherin-negative and -positive CRC tissues were identified when the fold change of Caenorhabditis elegans miR-39-normalized expression values was >2.0 and false discovery rate P-value was <0.05.
RT-qPCR
RNA samples from 3 E-cadherin-negative and 3 cadherin-positive CRC tissues were used for RT-qPCR. RT was performed using a miScript Reverse Transcription kit (Qiagen GmbH, Hilden, Germany) in a final volume of 20 µl containing 6 µl total RNA, 4 µl 5X miScript RT buffer and 1 µl miScript reverse transcriptase mixture as described previously (18). The reaction mixtures were incubated at 37°C for 60 min, 95°C for 5 min and held at 4°C. qPCR was performed on the resulting cDNA using the miScript SYBR Green PCR kit (Qiagen GmbH) using an ABI 7900 Real-Time PCR system (Applied Biosystems; Thermo Fisher Scientific, Inc.). Each qPCR was performed in a final volume of 20 µl containing 1X QuantiTect SYBR Green PCR Master mix (Qiagen, Hilden, Germany), 2 µl cDNA and 0.5 mM of each primer. The primer sequences are as follows: hsa-miR-10a-5p forward, 5′-TACCCTGTAGATCCGAATTTGTG-3′, hsa-miR-1224-3p forward, 5′-CCCCACCTCCTCTCTCCTCAG-3′, hsa-miR-193a-3p forward, 5′-AACTGGCCTACAAAGTCCCAGT-3′, hsa-miR-204-3p forward, 5′-GCTGGGAAGGCAAAGGGACGT-3′, hsa-miR-365a-3p forward, 5′-TAATGCCCCTAAAAATCCTTAT-3′ and hsa-miR-3678-3p forward 5′-CTGCAGAGTTTGTACGGACCGG-3′. The miScript Universal primer was used as reverse primers. The reaction mixtures were incubated at 95°C for 15 min, followed by 40 cycles of 94°C for 15 sec, 55°C for 30 sec and 70°C for 30 sec. All reactions were performed in triplicate. The expression levels of miRNAs were normalized to the endogenous control U6 small nuclear RNA, and were calculated with the formula 2−ΔΔCq (19). The primer sequence for U6 is as follows: forward, 5′-CTCGCTTCGGCAGCACA-3′ and reverse, 5′-AACGCTTCACGAATTTGCGT-3′.
Statistical analyses
All data were analyzed statistically using SPSS software (version 20.0; IBM SPSS, Armonk, NY, USA). Differences between CRC and corresponding paracarcinoma tissues were calculated using Student's t-test and presented as the mean ± standard deviation. The expression levels of miRNAs were compared using a Mann-Whitney U test. The expression levels of miRNAs were categorized into high and low groups according to the 75th percentile expression levels of miRNAs. A χ2 test or Fisher's exact test was used to determine the association between miRNA level and clinicopathological characteristics. In order to analyze the effect of miRNA survival of patients with CRC, survival curves were obtained using the Kaplan-Meier estimator method and assessed using a log-rank test. Survival data were also evaluated using Cox's multivariate regression analysis. Hazard ratios and the corresponding 95% confidence intervals were assessed with Cox regression models. All analyses were two-sided. P<0.05 was considered to indicate a statistically significant difference.
Results
miRNA expression profiling of clinical samples
miRNA microarray analysis was used to compare miRNA expression profiles of E-cadherin-negative CRC tissues with E-cadherin-positive tissues (n=6; 3 E-cadherin-positive and 3 E-cadherin-negative CRC tissues). The microarray used for this analysis contained 2,549 human mature miRNAs. A total of 6 miRNAs (miR-10a-5p, miR-1224-3p, miR-193a-3p, miR-204-3p, miR-365a-3p and miR-3678-3p) demonstrated marked differential expression between the two groups. Notably, all 6 miRNAs demonstrated significantly increased expression in E-cadherin-positive CRC tissues (P<0.05, Fig. 1).
Figure 1.
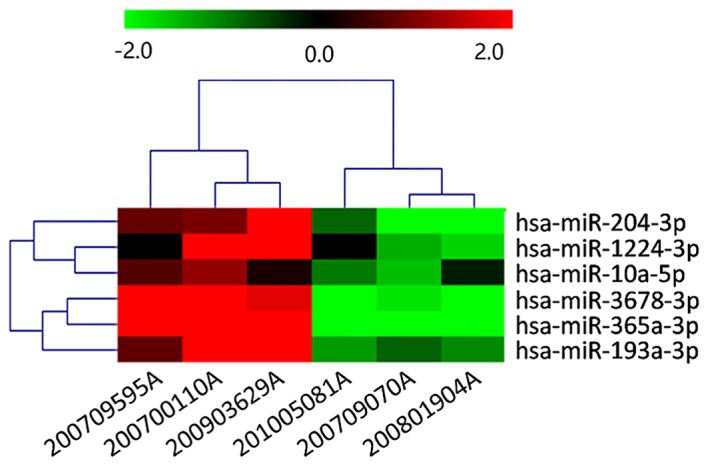
Heatmap of the miRNA transcriptome of through performing microarray analysis in three pairs of E-cadherin-positive (200700110A, 200709595A and 200903629A) and E-cadherin-negative (200709070A, 200801904A and 201005081A) colorectal cancer tissues. miRNA, microRNA; E-cadherin, epithelial cadherin; hsa-miR, human miRNA.
To validate the array results, these 6 miRNAs were further verified using RT-qPCR. As presented in Fig. 2, the RT-qPCR results demonstrating increased expression of miR-10a-5p, miR-193a-3p, miR-365a-3p and miR-3678-3p were consistent with the miRNA microarray results.
Figure 2.
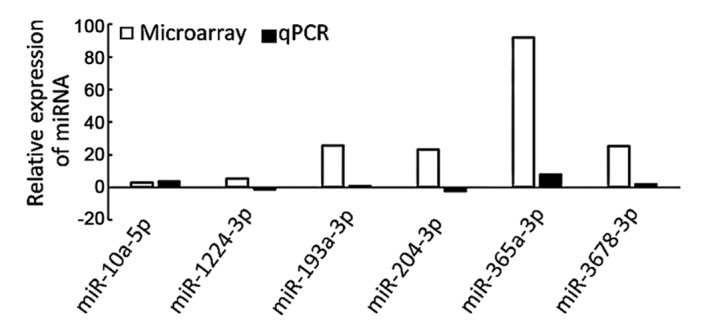
RT-qPCR validation of differentially expressed miRNAs identified in patient colorectal cancer tissues using microarray analysis. miRNA/miR, microRNA; RT-qPCR, reverse transcription-quantitative polymerase chain reaction.
Expression levels of miRNAs in CRC and corresponding paracarcinoma tissues
As the expression levels of miR-3678-3p in CRC and corresponding paracarcinoma tissues were low (Cq >30), it was excluded from further analysis. The expression levels of miR-10a-5p, miR-193a-3p and miR-365a-3p were examined in 90 pairs of CRC and corresponding paracarcinoma tissues. It was found that miR-10a-5p, miR-193a-3p and miR-365a-3p were upregulated in CRC tissues compared with corresponding paracarcinoma tissues (P<0.05; Fig. 3). In addition, the expression levels of miR-193a-3p in patients with TNM stage I+II were significantly increased compared with those in patients with TNM stage III+IV (P=0.032; Fig. 3). Larger tumors (≥6 cm) exhibited increased expression levels of miR-193a-3p compared with smaller tumors (<6 cm) (P=0.012; Fig. 3).
Figure 3.

Expression levels of miRNAs in 90 pairs of colorectal cancer and adjacent normal tissues. (A) miR-10a-5p. (B) miR-193a-3p. (C) miR-365a-3p. Expression levels of miR-193a-3p were determined in association with (D) TNM stage and (E) tumor size. miRNA/miR, microRNA; TNM, tumor-node-metastasis.
Association of miRNA expression with clinicopathological characteristics
A total of 90 CRC samples were divided into two groups on the basis of the 75th percentile expression of miR-10a-5p, miR-193a-3p and miR-365a-3p, respectively. No significant association was identified between miRNA expression and any clinicopathological characteristic (Table I). Clinicopathological characteristics were not available from all patients.
Table I.
Association between miRNA expression and clinicopathological characteristics.
| miR-10a-5p | miR-193a-3p | miR-365a-3p | |||||||
|---|---|---|---|---|---|---|---|---|---|
| Characteristic | Low, n (%) | High, n (%) | P-value | Low, n (%) | High, n (%) | P-value | Low, n (%) | High, n (%) | P-value |
| Age, years | 0.673 | 1.00 | 0.291 | ||||||
| ≥70 | 22 (50.0) | 25 (55.6) | 35 (52.2) | 12 (54.5) | 26 (59.1) | 21 (46.7) | |||
| <70 | 22 (50.0) | 20 (44.4) | 32 (47.8) | 10 (45.5) | 18 (40.9) | 24 (53.3) | |||
| Sex | 0.399 | 0.140 | 0.673 | ||||||
| Male | 26 (57.8) | 21 (46.7) | 39 (57.4) | 8 (36.4) | 25 (55.6) | 22 (48.9) | |||
| Female | 19 (42.2) | 24 (53.3) | 29 (42.6) | 14 (63.6) | 20 (44.4) | 23 (51.1) | |||
| Tumor size, cm | 0.274 | 0.071 | 0.189 | ||||||
| ≥6 | 14 (31.8) | 20 (45.5) | 22 (32.8) | 12 (57.1) | 14 (31.1) | 20 (45.5) | |||
| <6 | 30 (68.2) | 24 (54.5) | 45 (67.2) | 9 (42.9) | 31 (68.9) | 23 (53.5) | |||
| Differentiation | 0.857 | 0.309 | 0.857 | ||||||
| Well | 1 (2.2) | 4 (8.9) | 5 (7.4) | 0 (0) | 2 (4.4) | 3 (6.7) | |||
| Moderate | 27 (60.0) | 22 (48.9) | 37 (54.4) | 12 (54.5) | 25 (55.6) | 24 (53.3) | |||
| Poor | 17 (37.8) | 19 (42.2) | 26 (38.2) | 10 (45.5) | 18 (40.0) | 18 (40.0) | |||
| pT category | 0.195 | 0.337 | 0.853 | ||||||
| T1 | 0 (0) | 3 (7.0) | 3 (4.5) | 0 (0) | 1 (2.3) | 2 (4.5) | |||
| T2 | 2 (2.2) | 5 (11.6) | 4 (6.1) | 2 (9.1) | 3 (6.8) | 3 (6.8) | |||
| T3 | 40 (88.9) | 28 (65.1) | 52 (78.8) | 16 (72.7) | 35 (79.5) | 33 (75.1) | |||
| T4 | 4 (8.9) | 7 (16.3) | 7 (10.6) | 4 (18.2) | 5 (11.4) | 6 (13.6) | |||
| TNM stage | 0.277 | 0.129 | 0.515 | ||||||
| I and II | 20 (44.4) | 14 (31.1) | 38 (56.7) | 17 (77.3) | 26 (57.8) | 29 (65.9) | |||
| III and IV | 25 (55.6) | 31 (68.9) | 29 (43.3) | 5 (22.7) | 19 (42.2) | 15 (34.1) | |||
miRNA/miR, microRNA; pT, pathological tumor; TNM, tumor-node-metastasis.
Survival analyses
Among the 90 patients with CRC, the median survival time was 65 months. The 3-, 5- and 7-year survival rates were 65.6, 51.1 and 44.7%, respectively. To assess the association of miR-10a-5p, miR-193a-3p and miR-365a-3p with the prognosis of patients with CRC, Kaplan-Meier estimator analysis and the log-rank test were used. Patients with low expression of miR-193-3p had a significantly decreased survival time compared with those with high expression of miR-139-3p (P=0.012; Fig. 4A). In univariate analysis, advanced TNM stage [hazard ratio (HR), 1.938; 95% confidence interval (CI), 0.356–1.132; P=0.006] and miR-193a-3p expression levels (HR, 1.250; 95% CI, 0.712–2.196; P=0.017) were associated with worse prognosis of patients with CRC. Multivariate Cox's analyses indicated that TNM stage (HR, 1.730; 95% CI, 1.085–2.759; P=0.021) and miR-193a-3p expression (HR, 2.454; 95% CI, 1.027–5.863; P=0.043) were independent prognosis factors for overall survival rates of patients with CRC (Table II).
Figure 4.

Kaplan-Meier estimator survival curves of overall survival rates in patients with colorectal cancer on the basis of high or low (median) expression levels of miR-193a-3p. (A) All patients. (B) Patients ≤70 years. (C) Female patients. miR, microRNA.
Table II.
Univariate and multivariate analysis of overall survival.
| Univariate analysis | Multivariate analysis | |||
|---|---|---|---|---|
| Characteristic | HR (95% CI) | P-value | HR (95% CI) | P-value |
| Age, ≥70 years vs. <70 years | 0.634 (0.356–1.132) | 0.123 | ||
| Sex, male vs. female | 0.784 (0.445–1.382) | 0.400 | ||
| Tumor size, ≥6 cm vs. <6 cm | 1.091 (0.606–1.966) | 0.772 | ||
| Differentiation, poor vs. well and moderate | 1.283 (0.786–2.093) | 0.318 | ||
| TNM stage, III and IV vs. I and II | 1.938 (1.214–3.093) | 0.006 | 1.730 (1.085–2.759) | 0.021 |
| pT category, T3+T4 vs. T1+T2 | 1.548 (0.891–2.691) | 0.121 | ||
| miR-10a-5p expression, high vs. low | 1.126 (0.642–1.975) | 0.678 | ||
| miR-193a-3p expression, high vs. low | 2.846 (1.208–6.705) | 0.017 | 2.454 (1.027–5.863) | 0.043 |
| miR-365a-3p expression, high vs. low | 1.250 (0.712–2.196) | 0.437 | ||
HR, hazard ration; CI, confidence interval; TNM, tumor-node-metastasis; pT, pathological tumor; miR, miRNA.
Stratified analysis was performed to evaluate the effect of clinicopathological characteristics on the ability of miR-193a-3p expression in predicting the prognosis of patients with CRC. miR-193-3p was significant in patients with CRC ≥70 years (HR, 4.048; 95% CI, 1.215–13.487; P=0.014; Fig. 4B) and female patients with CRC (HR, 3.801; 95% CI, 1.115–12.961; P=0.022; Fig. 4C).
Discussion
For cancer cells to sustain continuous proliferation, evade growth suppression, invade tissues and form distant metastases, acquisition of certain capabilities is required. In this process, EMT is necessary (20). A key step in EMT noted in various types of cancer of epithelial origin is the loss of E-cadherin expression (21). This has been demonstrated in previous studies of CRC (22–24). Therefore, in order to identify novel biomarkers of CRC, an miRNA microarray assay was used to investigate differentially expressed miRNAs between E-cadherin-positive and -negative CRC tissues. In total, 3 miRNAs (miR-365a-3p, miR-193a-3p and miR-10a-5p) were differentially expressed between E-cadherin-positive and -negative CRC tissues, and were upregulated in CRC tissues compared with paracancerous tissues. Furthermore, expression of miR-193a-3p exhibited a significant decrease in TNM stages III and IV compared with TNM stages I and II (P=0.032; Fig. 3). The survival analysis revealed that downregulation of miR-193a-3p is associated with worse prognosis of patients with CRC. These results suggest that miR-193a-3p may act as a negative regulator in the development of CRC and that dysregulation of miR-193a-3p may be a novel means of identifying a high risk of developing metastases and requirement of further adjuvant therapies.
Previous studies have demonstrated that a number of miRNAs are associated with the occurrence and development of CRC by affecting cancer cell proliferation and invasion. Nielsen et al (25) identified that miR-21 was upregulated in CRC and was associated with TNM stage, and that the overexpression of miR-21 led to a worse prognosis. Schepeler et al (26) identified that miR-145 was able to inhibit the proliferation of CRC cells. Furthermore, a decreased level of miR-106 has been identified to predict shortened disease-free survival and overall survival in CRC (27). However, the majority of studies are simply investigating the differential expression of miRNAs between CRC and normal tissues, and investigation of the association between miRNAs and EMT in CRC remains limited. In the present study, miR-193a-3p was identified to be associated with E-cadherin expression and to be associated with the prognosis of patients with CRC, which was consistent with the role of E-cadherin in CRC prognosis. These results suggest that miR-193a-3p and E-cadherin may be associated in CRC.
Typically, miRNAs are able to regulate post-transcriptional silencing of target mRNAs. Previous studies have suggested that miR-200c regulates E-cadherin expression by inhibiting the expression of E-cadherin repressors including zinc finger E-box-binding homeobox 1/2, through which the ability of cancer cells to migrate and invade neighboring tissues or distant organs is regulated (28–30). Although differentially expressed miRNAs identified by microarray assay did not include miR-200c in the present study, a positive association between the expression of miR-193a-3p and E-cadherin expression was identified. It has been reported previously that the expression level of E-cadherin may be influenced by miR-193a-3p expression: Yu et al (31) identified that the expression level of E-cadherin was significantly increased following treatment of lung cancer cells with miR-193a-3p mimic. As the 90 CRC tissues in the present study did not undergo microdissection performed on paraffin-embedded tumor samples, this may partly explain why there was a weak but not statistically significant association between miR-193a-3p expression and TNM stages. The results of the present study indicate that miR-193a-3p regulates E-cadherin expression by acting on E-cadherin repressors. Further studies are warranted to elucidate the association between miR-193a-3p and E-cadherin and to explore the effect of miR-193a-3p on CRC.
The results of the present study provide the first evidence that miR-193a-3p is differentially expressed between E-cadherin-negative and -positive CRC tissues. Furthermore, miR-193a-3p expression is hypothesized to be an independent prognostic biomarker for CRC. However, further extensive studies are required to elucidate the underlying molecular mechanisms of miR-193a-3p in regulating E-cadherin expression and to define its role in the development and progression of CRC.
Acknowledgements
The present study was supported by the Project of Health Department of Jiangsu Province, China (grant no. H201363), the Social Development Project of Taizhou City, Jiangsu, China (grant no. TS025) and the Project of Jiangsu University (grant no. 2014).
References
- 1.Torre LA, Bray F, Siegel RL, Ferlay J, Lortet-Tieulent J, Jemal A. Global cancer statistics, 2012. CA Cancer J Clin. 2015;65:87–108. doi: 10.3322/caac.21262. [DOI] [PubMed] [Google Scholar]
- 2.Tanaka K, Ichikawa Y, Endo I. Liver resection for advanced or aggressive colorectal cancer metastases in the era of effective chemotherapy: A review. Int J Clin Oncol. 2011;16:452–463. doi: 10.1007/s10147-011-0291-6. [DOI] [PubMed] [Google Scholar]
- 3.de Rosa M, Pace U, Rega D, Costabile V, Duraturo F, Izzo P, Delrio P. Genetics, diagnosis and management of colorectal cancer (Review) Oncol Rep. 2015;34:1087–1096. doi: 10.3892/or.2015.4108. [DOI] [PMC free article] [PubMed] [Google Scholar]
- 4.Yoshino T, Muro K, Yamaguchi K, Nishina T, Denda T, Kudo T, Okamoto W, Taniguchi H, Akagi K, Kajiwara T, et al. Clinical validation of a multiplex kit for ras mutations in colorectal cancer: Results of the RASKET (RAS KEy Testing) Prospective, multicenter study. EBioMedicine. 2015;2:317–323. doi: 10.1016/j.ebiom.2015.02.007. [DOI] [PMC free article] [PubMed] [Google Scholar]
- 5.Mani SA, Guo W, Liao MJ, Eaton EN, Ayyanan A, Zhou AY, Brooks M, Reinhard F, Zhang CC, Shipitsin M, et al. The epithelial-mesenchymal transition generates cells with properties of stem cells. Cell. 2008;133:704–715. doi: 10.1016/j.cell.2008.03.027. [DOI] [PMC free article] [PubMed] [Google Scholar]
- 6.Bringuier PP, Umbas R, Schaafsma HE, Karthaus HF, Debruyne FM, Schalken JA. Decreased E-cadherin immunoreactivity correlates with poor survival in patients with bladder tumors. Cancer Res. 1993;53:3241–3245. [PubMed] [Google Scholar]
- 7.Krishnadath KK, Tilanus HW, van Blankenstein M, Hop WC, Kremers ED, Dinjens WN, Bosman FT. Reduced expression of the cadherin-catenin complex in oesophageal adenocarcinoma correlates with poor prognosis. J Pathology. 1997;182:331–338. doi: 10.1002/(SICI)1096-9896(199707)182:3<331::AID-PATH860>3.0.CO;2-D. [DOI] [PubMed] [Google Scholar]
- 8.Pena C, Garcia JM, Silva J, García V, Rodríguez R, Alonso I, Millán I, Salas C, De Herreros AG, Muñoz A, Bonilla F. E-cadherin and vitamin D receptor regulation by SNAIL and ZEB1 in colon cancer: Clinicopathological correlations. Hum Mol Genet. 2005;14:3361–3370. doi: 10.1093/hmg/ddi366. [DOI] [PubMed] [Google Scholar]
- 9.Kanazawa T, Watanabe T, Kazama S, Tada T, Koketsu S, Nagawa H. Poorly differentiated adenocarcinoma and mucinous carcinoma of the colon and rectum show higher rates of loss of heterozygosity and loss of E-cadherin expression due to methylation of promoter region. Int J Cancer. 2002;102:225–229. doi: 10.1002/ijc.10690. [DOI] [PubMed] [Google Scholar]
- 10.Ng EK, Chong WW, Jin H, Lam EK, Shin VY, Yu J, Poon TC, Ng SS, Sung JJ. Differential expression of microRNAs in plasma of patients with colorectal cancer: A potential marker for colorectal cancer screening. Gut. 2009;58:1375–1381. doi: 10.1136/gut.2008.167817. [DOI] [PubMed] [Google Scholar]
- 11.Bandres E, Agirre X, Bitarte N, Ramirez N, Zarate R, Roman-Gomez J, Prosper F, Garcia-Foncillas J. Epigenetic regulation of microRNA expression in colorectal cancer. Int J Cancer. 2009;125:2737–2743. doi: 10.1002/ijc.24638. [DOI] [PubMed] [Google Scholar]
- 12.Zhang Y, Wang Z, Chen M, Peng L, Wang X, Ma Q, Ma F, Jiang B. MicroRNA-143 targets MACC1 to inhibit cell invasion and migration in colorectal cancer. Mol Cancer. 2012;11:23. doi: 10.1186/1476-4598-11-23. [DOI] [PMC free article] [PubMed] [Google Scholar]
- 13.Lei SL, Zhao H, Yao HL, Chen Y, Lei ZD, Liu KJ, Yang Q. Regulatory roles of microRNA-708 and microRNA-31 in proliferation, apoptosis and invasion of colorectal cancer cells. Oncol Lett. 2014;8:1768–1774. doi: 10.3892/ol.2014.2328. [DOI] [PMC free article] [PubMed] [Google Scholar]
- 14.Liu L, Chen L, Xu Y, Li R, Du X. microRNA-195 promotes apoptosis and suppresses tumorigenicity of human colorectal cancer cells. Biochem Biophys Res Commun. 2010;400:236–240. doi: 10.1016/j.bbrc.2010.08.046. [DOI] [PubMed] [Google Scholar]
- 15.Arndt GM, Dossey L, Cullen LM, Lai A, Druker R, Eisbacher M, Zhang C, Tran N, Fan H, Retzlaff K, et al. Characterization of global microRNA expression reveals oncogenic potential of miR-145 in metastatic colorectal cancer. BMC Cancer. 2009;9:374. doi: 10.1186/1471-2407-9-374. [DOI] [PMC free article] [PubMed] [Google Scholar]
- 16.de Krijger I, Mekenkamp LJ, Punt CJ, Nagtegaal ID. MicroRNAs in colorectal cancer metastasis. J Pathology. 2011;224:438–447. doi: 10.1002/path.2922. [DOI] [PubMed] [Google Scholar]
- 17.Liu X, Duan B, Dong Y, He C, Zhou H, Sheng H, Gao H, Zhang X. MicroRNA-139-3p indicates a poor prognosis of colon cancer. Int J Clin Exp Pathol. 2014;7:8046–8052. [PMC free article] [PubMed] [Google Scholar]
- 18.Tao K, Yang J, Guo Z, Hu Y, Sheng H, Gao H, Yu H. Prognostic value of miR-221-3p, miR-342-3p and miR-491-5p expression in colon cancer. Am J Transl Res. 2014;6:391–401. [PMC free article] [PubMed] [Google Scholar]
- 19.Livak KJ, Schmittgen TD. Analysis of relative gene expression data using real-time quantitative PCR and the 2(−Delta Delta C(T)) Method. Methods. 2001;25:402–408. doi: 10.1006/meth.2001.1262. [DOI] [PubMed] [Google Scholar]
- 20.Hanahan D, Weinberg RA. Hallmarks of cancer: The next generation. Cell. 2011;144:646–674. doi: 10.1016/j.cell.2011.02.013. [DOI] [PubMed] [Google Scholar]
- 21.Krakhmal NV, Zavyalova MV, Denisov EV, Vtorushin SV, Perelmuter VM. Cancer Invasion: Patterns and Mechanisms. Acta Naturae. 2015;7:17–28. [PMC free article] [PubMed] [Google Scholar]
- 22.Kim SA, Lee EK, Kuh HJ. Co-culture of 3D tumor spheroids with fibroblasts as a model for epithelial-mesenchymal transition in vitro. Exp Cell Res. 2015;335:187–196. doi: 10.1016/j.yexcr.2015.05.016. [DOI] [PubMed] [Google Scholar]
- 23.Dass SD, Cheah PL, Ong DB, Teoh KH, Looi LM. E-cadherin downregulation at the infiltrating tumour front is associated with histological grade and stage in colorectal carcinoma of Malaysians. Malay J Pathol. 2015;37:19–24. [PubMed] [Google Scholar]
- 24.Bruun J, Kolberg M, Nesland JM, Svindland A, Nesbakken A, Lothe RA. Prognostic significance of β-Catenin, E-Cadherin and SOX9 in Colorectal Cancer: Results from a large population-representative series. Front Oncol. 2014;4:118. doi: 10.3389/fonc.2014.00118. [DOI] [PMC free article] [PubMed] [Google Scholar]
- 25.Nielsen BS, Jørgensen S, Fog JU, Søkilde R, Christensen IJ, Hansen U, Brünner N, Baker A, Møller S, Nielsen HJ. High levels of microRNA-21 in the stroma of colorectal cancers predict short disease-free survival in stage II colon cancer patients. Clin Exp Metastasis. 2011;28:27–38. doi: 10.1007/s10585-010-9355-7. [DOI] [PMC free article] [PubMed] [Google Scholar]
- 26.Schepeler T, Reinert JT, Ostenfeld MS, Christensen LL, Silahtaroglu AN, Dyrskjøt L, Wiuf C, Sørensen FJ, Kruhøffer M, Laurberg S, et al. Diagnostic and prognostic microRNAs in stage II colon cancer. Cancer Res. 2008;68:6416–6424. doi: 10.1158/0008-5472.CAN-07-6110. [DOI] [PubMed] [Google Scholar]
- 27.Diaz R, Silva J, Garcia JM, Lorenzo Y, García V, Peña C, Rodríguez R, Muñoz C, García F, Bonilla F, Domínguez G. Deregulated expression of miR-106a predicts survival in human colon cancer patients. Genes Chromosomes Cancer. 2008;47:794–802. doi: 10.1002/gcc.20580. [DOI] [PubMed] [Google Scholar]
- 28.Korpal M, Lee ES, Hu G, Kang Y. The miR-200 family inhibits epithelial-mesenchymal transition and cancer cell migration by direct targeting of E-cadherin transcriptional repressors ZEB1 and ZEB2. J Biol Chem. 2008;283:14910–14914. doi: 10.1074/jbc.C800074200. [DOI] [PMC free article] [PubMed] [Google Scholar]
- 29.Korpal M, Kang Y. The emerging role of miR-200 family of microRNAs in epithelial-mesenchymal transition and cancer metastasis. RNA Biol. 2008;5:115–119. doi: 10.4161/rna.5.3.6558. [DOI] [PMC free article] [PubMed] [Google Scholar]
- 30.Liu L, Qiu M, Tan G, Liang Z, Qin Y, Chen L, Chen H, Liu J. miR-200c inhibits invasion, migration and proliferation of bladder cancer cells through down-regulation of BMI-1 and E2F3. J Transl Med. 2014;12:305. doi: 10.1186/s12967-014-0305-z. [DOI] [PMC free article] [PubMed] [Google Scholar]
- 31.Yu T, Li J, Yan M, Liu L, Lin H, Zhao F, Sun L, Zhang Y, Cui Y, Zhang F, et al. MicroRNA-193a-3p and -5p suppress the metastasis of human non-small-cell lung cancer by downregulating the ERBB4/PIK3R3/mTOR/S6K2 signaling pathway. Oncogene. 2015;34:413–423. doi: 10.1038/onc.2013.574. [DOI] [PubMed] [Google Scholar]