Abstract
Cystathionine-β-synthase (CBS) is upregulated and hydrogen sulfide (H2S) production is increased in colon cancer cells. The functional consequence of this response is stimulation of cellular bioenergetics and tumor growth and proliferation. Lactate dehydrogenase A (LDHA) is also upregulated in various colon cancer cells and has been previously implicated in tumor cell bioenergetics and proliferation. In the present study, we sought to determine the potential interaction between the H2S pathway and LDH activity in the control of bioenergetics and proliferation of colon cancer, using the colon cancer line HCT116. Low concentrations of GYY4137 (a slow-releasing H2S donor) enhanced mitochondrial function (oxygen consumption, ATP production, and spare respiratory capacity) and glycolysis in HCT116 cells. SiRNA-mediated transient silencing of LDHA attenuated the GYY4137-induced stimulation of mitochondrial respiration, but not of glycolysis. H2S induced the S-sulfhydration of Cys163 in recombinant LDHA, and stimulated LDHA activity. The H2S-induced stimulation of LDHA activity was absent in C163A LDHA. As shown in HCT116 cell whole extracts, in addition to LDHA activation, GYY4137 also stimulated LDHB activity, although to a smaller extent. Total cellular lactate and pyruvate measurements showed that in HCT116 cells LDHA catalyzes the conversion of pyruvate to lactate. Total cellular lactate levels were increased by GYY4137 in wild-type cells (but not in cells with LDHA silencing). LDHA silencing sensitized HCT116 cells to glucose oxidase (GOx)-induced oxidative stress; this was further exacerbated with GYY4137 treatment. Treatment with low concentrations of GYY4137 (0.3 mM) or GOx (0.01 U/ml) significantly increased the proliferation rate of HCT116 cells; the effect of GOx, but not the effect of GYY4137 was attenuated by LDHA silencing. The current report points to the involvement of LDHA in the stimulatory effect of H2S on mitochondrial respiration in colon cancer cells and characterizes some of the functional interactions between LDHA, H2S-stimulated bioenergetics under resting conditions, as well as during oxidative stress.
Keywords: mitochondrial electron transport, ROS, anticancer
Graphical abstract
1. Introduction
Cystathionine-β-synthase (CBS) is upregulated and hydrogen sulfide (H2S) production is increased in various types of cancer including colon cancer [1–3], ovarian cancer [4], breast cancer [5] and lung cancer [6]. The functional consequence of this response is stimulation of cellular bioenergetics, tumor growth and proliferation (overviewed in [7]). The mechanisms involved in the stimulation of mitochondrial function by H2S are multiple; they involve direct electron donation to the mitochondrial electron transport chain [8–10], inhibition of mitochondrial cAMP phosphodiesterases, followed by cAMP-stimulated increases in mitochondrial electron transport [11], mitochondrial antioxidant effects [12–15], stimulation of mitochondrial DNA repair [6,15] as well as a direct stimulation of mitochondrial ATP synthase via post-translational modification (S-sulfhydration) [16]. All of these effects occur at low-to-intermediate concentrations of H2S, while at higher concentrations, inhibitory effects of H2S on mitochondrial function become apparent - primarily mediated by the inhibition of mitochondrial Complex IV (cytochrome c oxidase) by H2S [17–19].
We previously showed that CBS is selectively overexpressed in colon cancer and that H2S produced by it serves to maintain the tumor’s cellular bioenergetics and to promote tumor angiogenesis; pharmacological inhibition or silencing of CBS reduced tumor bioenergetic function, inhibited tumor angiogenesis and suppressed tumor growth [1]. In contrast, the other H2S-producing enzyme, cystathionine gamma lyase (CSE) was not overexpressed in colon cancer tissues, and the pharmacological inhibition of CBS or CSE silencing did not inhibit tumor bioenergetics, angiogenesis or tumor cell growth [1]. These data indicate that in colon cancer, H2S, is an endogenous, tumor-derived bioenergetic and proliferation-inducing factor, and show that its production is primarily due to CBS (and not CSE).
Lactate dehydrogenases (LDH) are enzymes commonly found in all living cells (animals, plants, prokaryotes). LDH is a tetramer composed of two different subunits, LDHA and LDHB, which can assemble into five different combinations (reviewed in [20]). LDH1 is made up from four LDHB subunits; LDH2 has three LDHB subunits and one LDHA subunit; LDH3 contains two LDHA and two LDHB subunits; LDH4 has one LDHB subunit and three LDHA subunits; and LDH5 is made up from four LDHA subunits. LDHA has a higher affinity for pyruvate and a higher Vmax for pyruvate reduction to lactate than LDHB. Thus, LDH isoenzymes that are rich in LDHA tend to facilitate pyruvate to lactate conversion (with the concomitant production of NAD+), while LDH isoenzymes rich in LDHB tend to facilitate lactate-to-pyruvate conversion, with the product of the reaction (pyruvate) “feeding” into the Krebs cycle and generating electron donors (e.g. NADH), which, in turn, can promote mitochondrial electron transport and oxidative phosphorylation [20–26].
The LDH isoform that is generally considered most relevant for cancer cell biology is LDHA [20–26]. It is transcriptionally upregulated in various cancer cells (including colon cancer) by a variety of mechanisms. The common view is that cancer cells use LDHA to stimulate the rate of glycolysis, ATP and lactate production even when oxygen is available and oxidative phosphorylation is not impaired (a process called as aerobic glycolysis). Cancer cells, thus, utilize both glycolysis and oxidative phosphorylation to maximize ATP production in support of their growth, proliferation, and invasion. Indeed, several studies showed that inhibiting LDHA expression or LDHA activity can reduce the invasive and metastatic potential of cancer cells by either decreasing their proliferation rate and/or by reversing their chemotherapy resistance; these findings identify LDHA as a stand-alone anticancer therapeutic target (reviewed in [20–26]).
The primary goal of the current study was to explore whether there are functional interactions between the H2S pathway and LDHA in colon cancer cells. Our current studies were inspired by our recent metabolomic analysis in HCT116 colon cancer cells, showing that pharmacological inhibitor of CBS decreases lactate/pyruvate ratio [3], as well as by the direct in vitro cell-free follow-up studies demonstrating that H2S donation increases the catalytic activity of LDH [3]. The results of the present studies confirm and extend these findings and unveil complex functional interactions between H2S and LDHA in colon cancer cells - both in resting conditions as well as in the presence of oxidative stress.
2. Materials and Methods
2.1 Cell culture
The human colorectal carcinoma cell line, HCT116 (ATCC, Manassas, VA; Cat.# CCL-247) was cultured in McCoy’s 5A medium (ATCC) supplemented with 10% FBS, 100 IU/ml penicillin and 100 mg/ml streptomycin as described [1–3]. Cells were grown in a 37°C, 5% CO2 atmosphere.
2.2 Transient LDHA depletion with siRNA
HCT116 cells were transfected with 20 nM siRNA specific for LDHA (Thermo Fisher Scientific Inc., Carlsbad, CA; Cat.# 4390824) or control siRNA (Fisher; Cat.# 4390843) using Lipofectamine® RNAi/MAX Reagent (Invitrogen, Carlsbad, CA; Cat.# 13778075) per the manufacturer’s protocol. The level of depletion was calculated by densitometric analysis of Western blots relatively to loading control. Cells with 70–90% depletion measured 72 h post-transfection were used in subsequent experiments.
2.3 Western blotting
Cells were lysed in RIPA buffer (Sigma–Aldrich, St. Louis, MO) supplemented with protease inhibitor cocktail (Complete Mini EDTA-free, Roche Applied Science, Indianapolis, IN). Cell homogenates were resolved on 4–12% NuPage Bis-Tris acrylamide gels (Invitrogen), then transferred to nitrocellulose. Membranes were blocked in 10% non-fat dried milk and probed overnight with LDHA (Cell Signaling, Boston, MA; Cat.# 2012), CBS (Proteintech Group, Inc., Rosemont, IL; Cat.# 14787-1-AP) or β-actin (Santa Cruz Biotechnology Inc., Santa Cruz, CA; Cat.#47778). After incubation with peroxidase conjugates the blots were detected on a CCD-camera based detection system (GBox, Syngene USA, Frederick, MD). ImageJ was used for densitometric analysis.
2.4 Extracellular Flux Analysis
The XF24 Extracellular Flux Analyzer (Seahorse Bioscience, Agilent Technologies, North Billerica, MA) was used to measure bioenergetic function as described [1–3]. Cells were treated with GYY4137 (0.1–1 mM; a slow-releasing H2S donor) for 24 h, followed by analysis. Four key parameters of mitochondrial function (basal respiration, adenosine triphosphate (ATP) turnover, proton leak, and maximal respiration) were assessed through the sequential use of oligomycin (ATP synthase inhibitor, final concentration of 1.5 μM), FCCP (oxidative phosphorylation uncoupler, final concentration of 0.4 μM) and rotenone + antimycin A (complex I and III inhibitors, respectively - each at the final concentration of 4 μM). The difference between the maximal and the basal respirations was considered the respiratory reserve capacity (the capacity of a cell to generate ATP via oxidative phosphorylation in response to increased demand for energy).
Glycolytic Stress Test was used to estimate various parameters of cellular glycolysis (glycolysis, maximal glycolytic capacity and glycolytic reserve capacity), which was obtained with the sequential use of 25 mM glucose, 5 μM oligomycin (to block mitochondrial respiration and force the cells to rely on glycolysis for ATP production) and 100 mM 2-deoxyglucose (2-DG, a glucose analog and inhibitor of glycolytic ATP production). Glycolytic reserve was calculated as the difference between the glycolytic capacity and the glycolysis; this parameter is indicative of the cellular ability to increase the glycolytic rate upon increased energy demand. Acidification of carbon dioxide, the end-product of the tricarboxylic acid (TCA) cycle, which can be converted to bicarbonate, is considered a major contributor to nonglycolytic acidification. Bioenergetic parameters were normalized to protein content via Lowry reagent (Bio-Rad) using BSA as a standard.
2.5 LDHA and LDHB enzymatic assays
LDHA and LDHB enzymatic activities were analyzed according to the online Worthington protocol at http://www.worthington-biochem.com/ldh/assay.html. Briefly, HCT116 cells were treated with 0.1–1 mM GYY4137 for 24 h and whole cell lysates were collected. Total cell lysates or human recombinant LDHA proteins were loaded onto a 96-well plate. The reaction was initiated by the addition of 6.6 mM NADH and 30 mM sodium pyruvate or 6.6 mM NAD+ and 30 mM sodium L-lactate to measure LDHA or LDHB activity, respectively. In regards to LDHA activity, the decrease in absorbance (λ= 340 nm) was proportional to the increase in NAD+ production; for LDHB, the increase in absorbance (λ= 340 nm) was proportional to the increase in NADH production. Absorbances were immediately recorded at 340 nm/min for 6 min at 25°C in a on a monochromator-based reader (Powerwave HT, Biotek).
2.6 Production of WT LDHA and C163A LDHA
GenScript (Piscataway, NJ) was contracted to synthesize and produce full length protein constructs of normal human LDHA (WT) and C163A LDHA, which were verified by DNA sequencing. 1 μg of either LDHA or C163A LDHA was used when determining catalytic enzymatic activity.
2.7 Mass spectrometry based S-sulfhydration assay
WT or C163A LDHA (1 μg) was incubated with 10 μM NaHS (a rapid-releasing H2S donor) for 1 h at 37°C. Next, 20 mM iodoacetamide was added and samples were incubated for 1 h at 37°C in dark. Equal volume of 2X loading buffer (without β-mercaptoethanol) was added and samples were run on NuPAGE 4–12% gel. Band corresponding to LDHA was excised and carboxyamidomethyl-S-sulfhydration was analyzed by mass spectrometry at the UTMB Mass Spectrometry Core Faculty, as described below and similarly to a previously employed protein S-sulfhydration protocol [6].
Accordingly, gel samples are cut into 1 mm size pieces or smaller and placed into separate 0.5 mL polypropylene tubes. 100 μl of 50 mM ammonium bicarbonate buffer was added to each tube and the samples were then incubated at 37°C for 30 min. After incubation, the buffer was removed and 100 μl of water was added to each tube. The samples were then incubated again at 37°C for 30 min. After incubation, the water was removed and 100 μl of acetonitrile was added to each tube to dehydrate the gel pieces. The samples were vortexed, and after 5 min the acetonitrile was removed. The samples were then placed in a speedvac for 45 min to dry. A 25 mM ammonium bicarbonate pH 8.0 solution was used to prepare 10 ng/μl trypsin (Promega Corp.) solution. Trypsin solution was added to each sample tube in an amount to just cover the gel. The samples were then incubated at 37°C for 6 h to overnight. After digested with trypsin, 3 μl of sample was injected to mass spectrometer. Nano-LC/MS/MS was performed on a Thermo Scientific Orbitrap Fusion system, coupled with a Dionex Ultimate 3000 nano HPLC and auto sampler with 40 well standard trays. Sample was injected onto a trap column (300 μm i.d. × 5 mm, C18 PepMap 100) and then followed by a C18 reversed-phase nano LC column (Acclaim PepMap 100 75 μm × 25 cm), which is heated to 40°C in a chamber. Flow rate was set to 400 nl/min with 60 min LC gradient, where mobile phases were A (99.9% water, 0.1% FA) and B (99.9% ACN, 0.1% FA). Once sample elutes from the column, it was sprayed through a charged emitter tip (PicoTip Emitter, New Objective, 10±1 μm) and into the mass spectrometer. Parameters include the following: tip voltage at +2.2 kV, FTMS mode for MS acquisition of precursor ions (resolution 120,000); ITMS mode for subsequent MS/MS of top 10 precursors selected; MS/MS was accomplished via CID. Proteome Discoverer 1.4 was used for protein identification, modification and peak area analysis. UniPort human database was used to analysis raw data. Other parameters include the following: selecting the enzyme as trypsin; maximum missed cleavages = 2; precursor tolerance is set at 10 ppm; MS/MS fragment tolerance is set at 0.6 Da; and peptide charges are considered as +2, +3 and +4. The significance of a peptide match is based on expectation values smaller than 0.05.
2.8. Modified biotin switch assay of S-sulfhydration
The assay was conducted as described elsewhere [16] with modifications. Briefly, human recombinant LDHA (1 μg; Sigma) was suspended in HEN buffer [250 mM Hepes (pH 7.7), 1 mM EDTA, and 0.1 mM neocuproine] supplemented with 100 μM deferoxamine and centrifuged at 14,000 rpm for 20 min at 4°C. Blocking buffer (HEN buffer adjusted to 2.5% SDS and 20 mM MMTS) was added to the samples, which were then incubated at 50°C for 20 min with frequent shaking. After the addition of acetone, proteins were precipitated at −20°C for 20 min. Next, acetone was removed and proteins were resuspended in HENS buffer (HEN buffer adjusted to 1% SDS) with the addition of biotin-HPDP. After incubation at 25°C for 3 h, the biotinylated proteins were precipitated by streptavidin agarose beads and washed 5X with HENS buffer. The biotinylated proteins were eluted by 6X loading buffer and samples were subjected to Western blot analysis.
2.9 MTT conversion and LDH release assays
The MTT assay and LDH activity measurements were performed as previously described [1–3]. Briefly, cells were incubated in medium containing 0.5 mg/ml, 3-(4,5-dimethyl-2-thiazolyl)-2,5-diphenyl-2H-tetrazolium bromide (MTT; Calbiochem, EMD BioSciences, San Diego, CA) for 1 h at 37°C in a 5% CO2 atmosphere. The converted formazan dye was dissolved in DMSO. The plates were read on a Molecular Devices M2 microplate reader at a test wavelength of 570 nm and a reference wavelength of 630 nm. Cell viability was calculated as the ratio of absorbance in treated cultures to absorbance in untreated control cultures.
LDH activity in the cell supernatant was estimated by mixing cell culture supernatant (30 μL) with 100 μl LDH assay reagent containing 110 mM lactic acid, 1.35 M nicotinamide adenine dinucleotide (NAD+), 290 mM N-methylphenazonium methyl sulfate (PMS), 685 mM 2-(4-Iodophenyl)-3-(4-nitrophenyl)-5-phenyl-2H-tetrazolium chloride (INT) and 200 mM Tris (pH 8.2). The changes in absorbance were read kinetically at 492 nm for 15 min (kinetic LDH assay). LDH activity values are shown as Vmax (mOD/min).
2.10 Apoptosis and necrosis detection by flow cytometry
Detection of cell death was performed using PE Annexin V Apoptosis Detection Kit I (BD Biosciences Pharmingen, San Diego, CA) according to the manufacturer’s recommendations. Briefly, transiently transfected HCT116 cells were trypsinized, washed in ice-cold PBS and re-suspended in 1 ml binding buffer. 1×10⁵ cells in 500 μl were incubated with annexin V-phycoerythrin (Annexin V-PE) and 7-aminoactinomycin D (7-AAD) staining for for 10 min at 25°C in the dark, and analyzed immediately using a Guava EasyCyte Plus Flow Cytometer (Millipore, Billerica, MA). CytoSoft 5.3 software was used to estimate the subpopulations of early and late apoptotic, as well as necrotic cells, as a percentage of the total cell count.
2.11 Measurement of intracellular lactate and pyruvate levels
Intracellular lactate and pyruvate levels were analyzed via lactate assay kit (Sigma; Cat.# MAK064) or pyruvate assay kit (Sigma, Cat.# MAK071) according to the manufacturer’s instructions. In the lactate assay, lactate specifically reacts with an enzyme mix to generate a product, which interacts with a specific probe to produce color (570 nm). In the pyruvate assay, pyruvate is oxidized by pyruvate oxidase via enzyme reactions to generate color (λ= 570 nm). Accordingly, cell lysates were deproteinized with a 10 kDa MWCO spin filter and the filtrate was added to reaction wells containing 50 μl of reaction buffer (i.e. assay buffer, enzyme mix, and probe). The reaction was incubated on a shaker for 30 min at room temperate and protected from light. Thereafter, the endpoint absorbance was recorded at 570 nm and endogenous lactate or pyruvate levels were quantified by plotting against standard curves and displayed as a percentage to the scrambled siRNA CLT group.
2.12 Cell proliferation assays
For assessment of cell proliferation, the xCELLigence system (Roche Applied Science, Indianapolis, IN) was used as described [1–3]. Briefly, HCT116 cells were cultured until ~70% confluence and were transfected with siRNA or siLDHA. After 24 h, cells were detached by trypsin–EDTA and resuspended in fresh culture media at a concentration of 60,000 cells/ml. Cell suspension was added to each well (6,000 cells/well) of an E-plate 96, a specially designed 96-well microtiter plate containing interdigitated microelectrodes to noninvasively monitor the cell proliferation by measuring the relative change in the electrical impedance of the cell monolayer, a unitless parameter named cell index. After 24 h, cells were treated with various pharmacological agents - e.g. glucose oxidase, to generate a steady-state, low-level oxidative stress and/or GYY4137 (to generate a steady release of H2S - and proliferation was monitored for 48 h.
2.13 Chemicals and statistical analysis
All chemicals and commercially available enzymes used in this study were obtained from Sigma-Aldrich (St. Louis, MO) unless otherwise stated. All data are presented as mean ± SEM and were analyzed using GraphPad Prism software (GraphPad, San Diego, CA, USA). Statistical analyses included Student’s t test, one- or two-way ANOVA followed by Tukey’s multiple comparisons were used to detect differences between groups. Statistical significance was considered when p < 0.05.
3. Results
3.1 Functional LDHA is required for the H2S-induced stimulation of oxidative phosphorylation
First, we sought to determine the possibility of a bioenergetic partnership between the two tumor-supporting factors H2S and LDHA. In order to attenuate LDHA expression, HCT116 cells were transiently transfected with 20 nmol siRNA specific for LDHA for 72 h (or scrambled siRNA control; CTL). Efficient suppression of LDHA in HCT116 cells (Fig. 1A) did not affect CBS protein expression level (Fig. 1B), nor did it effect baseline oxidative phosphorylation and mitochondrial electron transport parameters (Fig. 2A). Knockdown of LDHA did, however, significantly reduce the baseline glycolytic activity of the HCT116 cells (Fig. 2B).
Figure 1. SiRNA-mediated LDHA silencing reduces LDHA and has no effect on CBS protein levels in HCT116 cells.
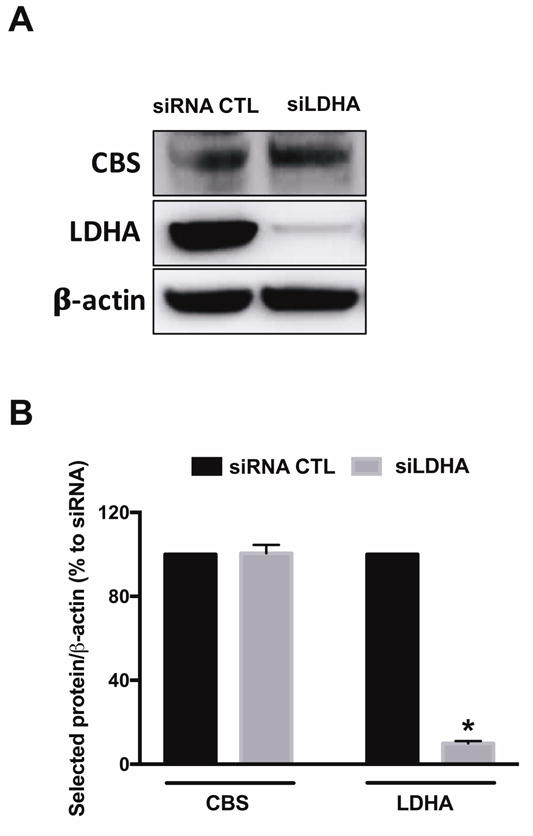
HCT116 cells were transiently transfected with 20 nM nontargeting (siRNA, control) or siLDHA for 72 h. Lipofectamine RNAiMAX was used as the transfection reagent. (A) LDHA and CBS protein expression levels in siRNA or siLDHA transfected HCT116 cells are shown. (B) The density of LDHA protein was normalized to that of β-actin and expressed as a percentage of the corresponding siRNA transfected HCT116 cells. Data represent mean ± SEM and expressed as a percentage of the corresponding siRNA CTL. LDHA: n = 5, for each group; CBS: n = 4, for each group. *P < 0.05 vs siRNA (based on two-tail Student’s t-test for pairwise comparison).
Figure 2. LDHA silencing does not affect oxidative phosphorylation, but attenuates glycolysis in HCT116 cells.
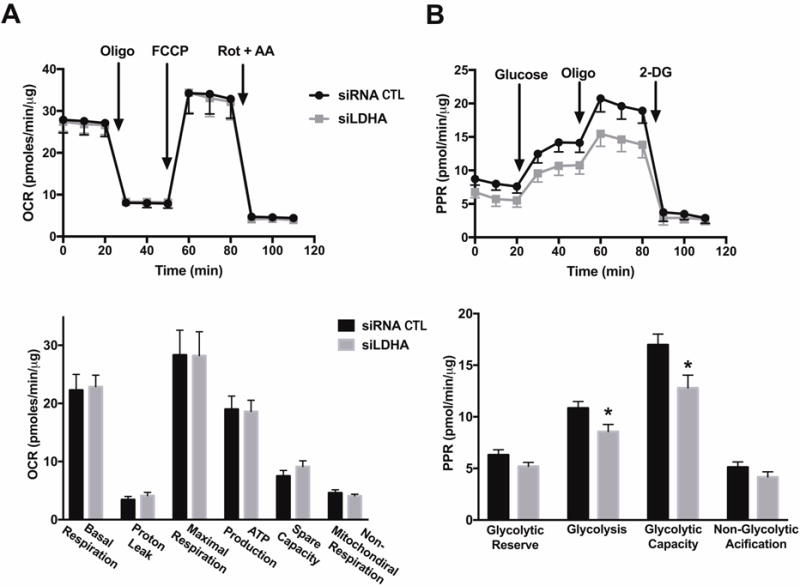
HCT116 cells were transiently transfected with 20 nM nontargeting (siRNA, control) or siLDHA for 72 h. Lipofectamine RNAiMAX was used as the transfection reagent. Extracellular Flux Analysis was then performed. (A) Oxygen consumption rate (OCR) in HCT116 cells transfected with either nontargeting or siLDHA (FCCP: carbonyl cyanide 4-(trifluoromethoxy)phenylhydrazone, a mitochondrial oxidative phosphorylation uncoupler; Rot: rotenone; and AA: antimycin A; inhibitors of complex I and III, respectively; top panel). Comparison of cellular bioenergetics parameters based on OCR (bottom panel). (B) Changes in the prolife of proton production rate (PPR) in HCT cells subjected to either siRNA or siRNA silencing of LDHA (oligo: oligomycin, an inhibitor of ATP synthase; 2-DG: 2-deoxy-D-glucose; an inhibitor of glycolysis; top panel). Comparison of cellular bioenergetics parameters based on PPR (bottom panel). Data represent mean ± SEM. n = 4–6 for each group. *P < 0.05 vs. siRNA (based on two-tailed Student’s t-test for pairwise comparison).
Direct measurements of lactate and pyruvate levels in HCT116 cell homogenates suggested that LDHA supports a basal pyruvate-to-lactate enzymatic conversion: LDHA silencing reduced total cellular lactate levels and increased total cellular pyruvate levels (by approximately 20% each), thus decreasing baseline lactate/pyruvate ratio (Fig. 3). Interestingly, a 24-h delivery of H2S via GYY4137 administration (0.1–0.3 mM) significantly stimulated both lactate and pyruvate generation in siRNA transfected HCT116 cells, while a high GYY concentration (1 mM) diminished lactate production (Fig. 3A). GYY supplementation had no effect on lactate generation in siLDHA transfected HCT116 cells (Fig. 3A), yet an increase in pyruvate level was observed with 0.1 mM GYY treatment (Fig. 3B).
Figure 3. LDHA silencing suppresses H2S-stimulated lactate production in HCT116 cells.
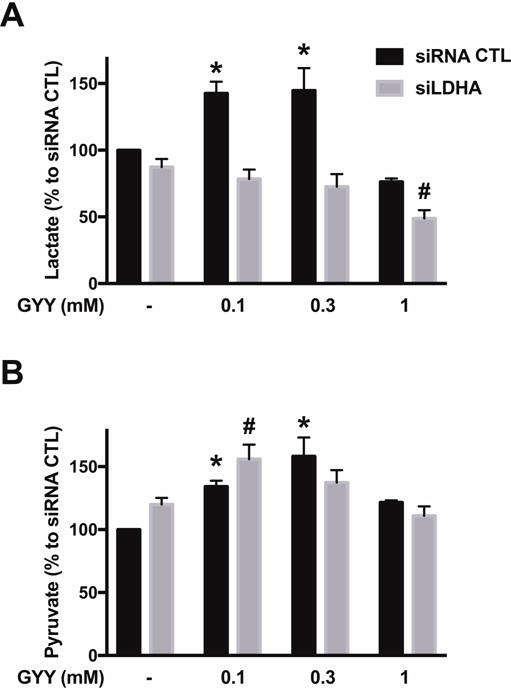
HCT116 cells (either with scrambled siRNA treatment or with siRNA-mediated LDHA silencing) were treated with vehicle or GYY4137 (0.1, 0.3 or 1 mM) for 24 h. Total cellular lactate (A) or pyruvate (B) levels were determined via lactate or pyruvate assay kits, respectively. Absolute control values for lactate and pyruvate amounted to 17.45±0.67 and 2.05+0.47 μmoles/g cell extract. Data represent mean ± SEM and expressed as a percentage of the corresponding siRNA CTL group. n = 4–5, for each group (A); n = 3–5, for each group (B). *P < 0.05 vs. siRNA CTL, #P < 0.05 vs. siLDHA CTL (based on one-way ANOVA corrected with Tukey’s post-hoc test).
In agreement with prior observations demonstrating the stimulatory effect of low-to-intermediate concentrations of H2S on cellular bioenergetics [1–19], GYY4137 administration (0.1–0.3 mM) significantly enhanced mitochondrial function (including basal mitochondrial respiration, maximal respiration, ATP production, and spare capacity) in control HCT116 cells (treated with scrambled siRNA control) (Fig. 4). In cells with siRNA-mediated LDHA silencing, however, the stimulatory effect of GYY4137 on mitochondrial function was absent (Fig. 4). In line with the well-known bell-shaped concentration responses that are characteristic of H2S [7], higher concentration (1 mM) of the H2S donor no longer stimulated mitochondrial function - and even suppressed some of the bioenergetic parameters to levels that are below control values. These inhibitory effects of GYY4137 were independent of the presence or absence of LDHA (Fig. 4).
Figure 4. H2S stimulates mitochondrial respiration in HCT116 cells; this response requires functional LDHA.
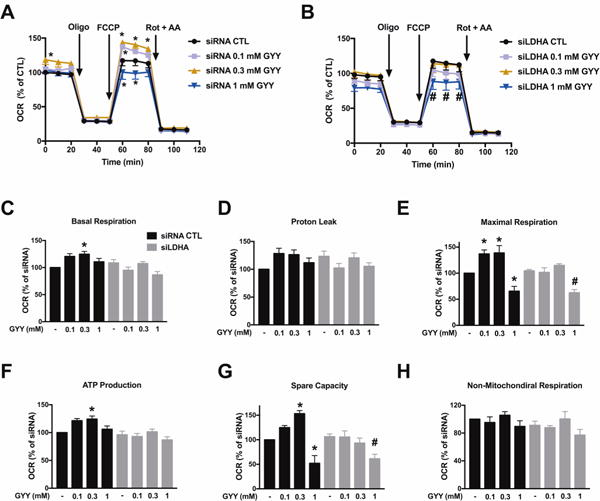
HCT116 cells (either with scrambled siRNA treatment or with siRNA-mediated LDHA silencing) were treated with GYY4137 (0.1, 0.3 or 1 mM) for 24 h, followed by Extracellular Flux Analysis. OCR in HCT116 cells transfected with either nontargeting (A) or siLDHA (B) is shown. C–H: Comparison of cellular bioenergetics parameters. Data represent mean ± SEM and expressed as a percentage of the corresponding siRNA CTL group. n = 3–6 for each group. *P < 0.05 vs. siRNA CTL; #P < 0.05 vs. siLDHA CTL (based on two-way ANOVA (A, B), or one-way ANOVA (C–H) corrected with Tukey’s post-hoc test).
H2S is an endogenous stimulator of glycolysis in colon cancer cells [1]. In line with these prior observations, GYY4137 enhanced glycolytic reserve and glycolic capacity in control HCT116 cells (treated with scrambled siRNA control) (Fig. 5). In HCT116 cells with LDHA silencing, GYY4137 (0.3 mM) induced a restoration of the glycolytic activity to the levels seen in normal control cells (without H2S donors) (Fig. 5D). With respect to all other parameters, LDHA silencing had no major influence on the stimulatory effect of GYY4137 on most of the glycolytic parameters of HCT116 cells (Fig. 5).
Figure 5. LDHA silencing does not affect H2S-enhanced glycolysis in HCT116 cells.
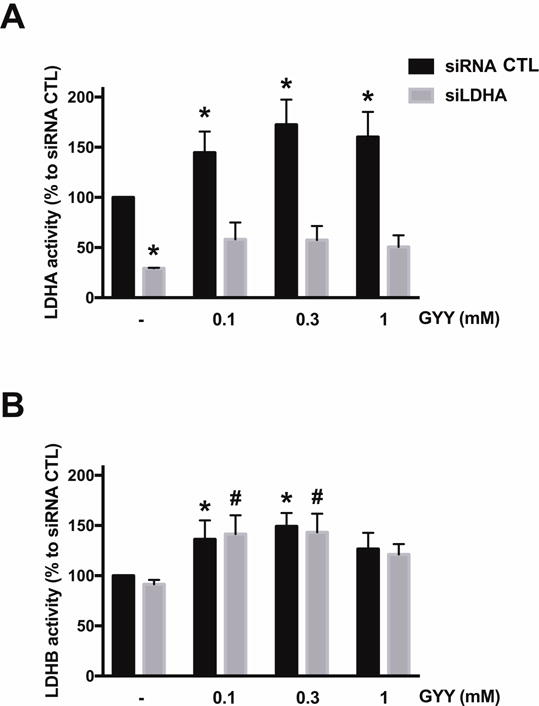
HCT116 cells (either with scrambled siRNA treatment or with siRNA-mediated LDHA silencing) were treated with GYY4137 (0.1, 0.3 or 1 mM) for 24 h, followed by Extracellular Flux Analysis. PPR are shown in control scrambled siRNA (A) or siLDHA (B) transfected HCT116. C–F: Comparison of cellular bioenergetics parameters. Data represent mean ± SEM and expressed as a percentage of the corresponding siRNA CTL group. n = 4–6 for each group. *P < 0.05 vs. siRNA CTL; #P < 0.05 vs. siLDHA CTL (based on two-way ANOVA (A, B), or one-way ANOVA (C–F) corrected with Tukey’s post-hoc test).
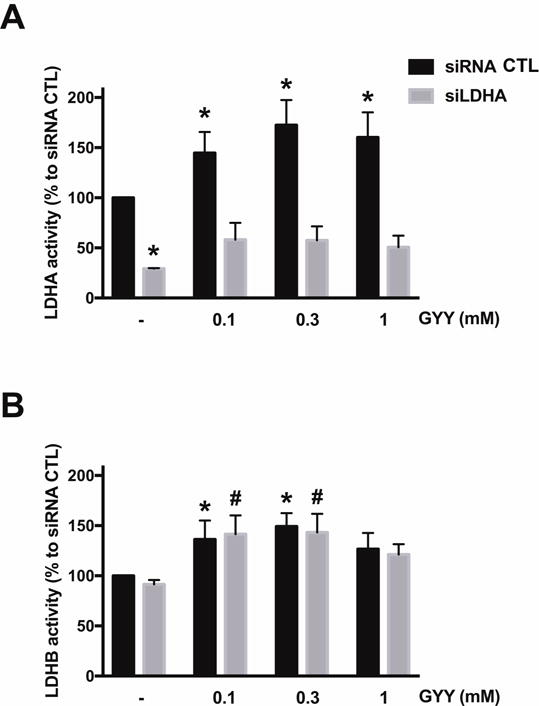
Next, the effect of H2S donation by GYY4137 on LDHA and LDHB activity of HCT116 homogenates was measured in vitro. The H2S donor stimulated LDHA activity (pyruvate-to-lactate conversion) in cell extracts from control (wild-type) cells, but not from cell extracts of cells with siRNA-mediated LDHA silencing (Fig. 6A). To a smaller extent, the H2S donor also stimulated LDHB activity (lactate-to-pyruvate conversion) in the cell extracts; as expected, this response was unaffected by LDHA silencing (Fig. 6B). Direct measurements of lactate levels in HCT116 cell homogenates demonstrated that lactate levels were enhanced by 0.1 and 0.3 mM GYY4137 in control cells (but not in LDHA silenced cells) (Fig. 3); these findings are consistent with the activation of LDHA activity by the intermediate concentrations of H2S. In parallel, there was also a GYY4137-induced increase in cellular pyruvate levels, an effect, which was largely unaffected by LDHA silencing (Fig. 3) and which effect, therefore, is presumably due to actions of GYY4137 on cellular targets other than LDHA (for instance, LDHB).
Figure 6. Effect of GYY4137 on LDHA and LDHB activity of HCT116 cell extracts.
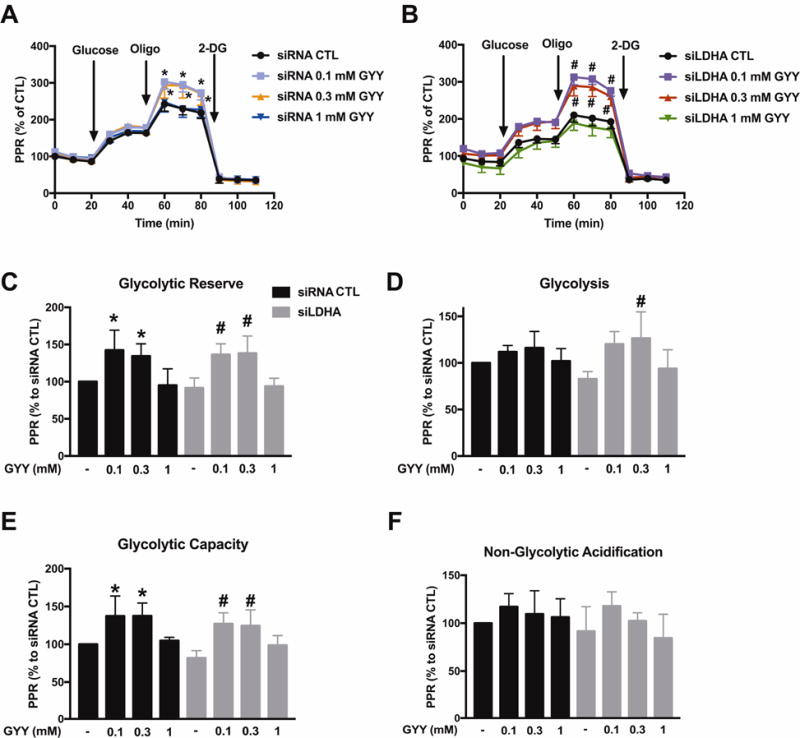
HCT116 cells (either with scrambled siRNA treatment or with siRNA-mediated LDHA silencing) were treated with 0.1–1 mM GYY4137 for 24 h and total cell lysates were collected. LDHA (A) or LDHB (B) enzymatic activities were measured as described in Materials and Methods. n = 4–6, for each group (A); n = 3–6, for each group (B); *P < 0.05 vs. untreated siRNA group, #P < 0.05 vs. untreated siLDHA group (based on two-way ANOVA corrected with Tukey’s post-hoc test).
3.2 H2S activates human LDHA via S-sulfhydrating Cys163
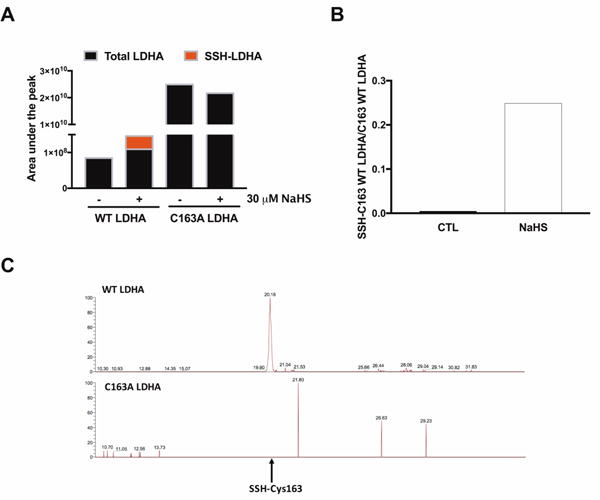
Human recombinant wild-type LDHA (WT) and a C163A LDHA enzyme were generated (Fig. 7A), and their respective enzyme activities were measured (Fig. 7B). The basal specific activity of C163A LDHA was significantly lower than the basal activity of the wild-type enzyme (Fig. 7B). H2S donation via NaHS (30–300 μM) concentration-dependently stimulated WT LDHA activity. On the other hand, C163A LDHA activity was unaffected by H2S (Fig. 7B). NaHS (10 μM) increased the S-sulfhydration of wild-type LDHA by ~53 fold (Fig. 8), on Cys163, as well as several other cysteine residues (Table 1). LDHA sulfhydration was reduced in the 10 μM NaHS-treated C163A LDHA samples (Fig. 8).
Figure 7. H2S stimulates the catalytic activity of wild-type LDHA catalytic activity, but not the activity of C163A LDHA.
(A) Protein sequences of WT LDHA and C163A LDHA. Protein sequences of WT LDHA and C163A LDHA. A His tag was added to the end of each protein to aid in the protein isolation and purification steps (letters shown in red). The Cys residue substituted to Ala in C163A LDHA is shown bold and highlighted. (B) WT LDHA or C163A LDHA (1 μg) were pre-incubated with 10–300 μM NaHS for 30 min at 37°C. LDHA enzymatic analysis was carried out as described in the Materials and Methods. Data represent mean ± SEM and expressed as a percentage of the corresponding untreated WT LDHA group. n = 4–6, for each group; *P < 0.05 vs. WT LDHA CTL (based on one-way ANOVA corrected with Tukey’s post-hoc test).
Figure 8. H2S S-sulfhydrates LDHA.

MS/MS/LC was used to identify and quantity the post-translational modification of NaHS-induced S-sulfhydration (SSH) of LDHA. (A) Figure shows the area under the peak of SSH-Cys163 and the total digested protein without the SSH modification in both WT and C163A LDHA. (Total wild-type LDHA protein used in the assay was 1 μg; total C163A LDHA was increased to 2.5 μg in order to increase the detection of residual sulfhydrated cysteines.) Only minimal amount of sulfhydrated cysteines was detected in the C163A LDHA. (B) Figure represents the ratio of the area under the peak of SSH-Cys163 vs. the area under the peak of the digested peptide without S-sulfhydration modification in WT LDHA. (C) Extracted Ion Chromatogram (XIC) of WT LDHA (top) and C163A LDHA (bottom) treated with 10 μM NaHS. NaHS-treated WT LDHA produced a significant SSH-Cys163 peak at retention time (RT) 20.16 min, which was absent in NaHS-treated C163A LDHA.
Table 1.
| Enzyme | Digested peptide sequence | Thiolocarbamidomethyl Modified cysteine residue |
|---|---|---|
| WT LDHA | ITVVGVGAVGMAcAISILMK | Cys 35 |
| VIGSGcNLDSAR | Cys 163 | |
| LGVHPLScHGWVLGEHGDSSVPVWSGMNVAGVSLK | Cys 185 | |
| DDVFLSVPcILGQNGISDLVK | Cys 293 | |
| C163A LDHA | ITVVGVGAVGMAcAISILMK | Cys 35 |
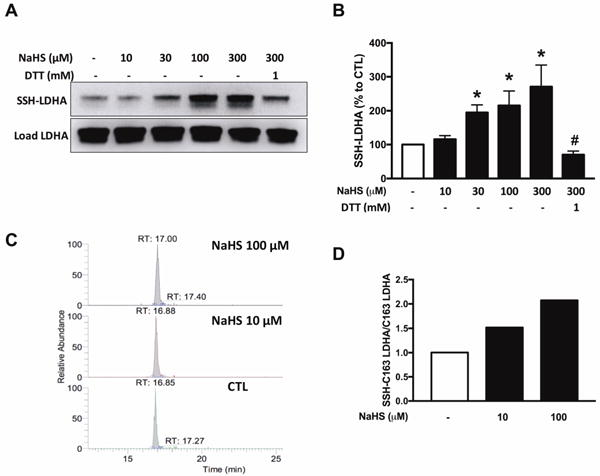
Using purified LDH enzyme from Sigma-Aldrich, we have previously showed that NaHS stimulates the enzymatic activity of LDH as well [3]. LC/MS/MS analysis on the Sigma-Aldrich LDH enzyme confirmed the S-sulfhydration of the enzyme on Cys163 (Fig. 9).
Figure 9. H2S S-sulfhydrates LDHA on Cys 163.
(A) S-sulfhydration of LDHA (1 μg; Sigma–Aldrich LDHA) under various concentrations of NaHS (10–300 μM) in the presence or absence of 1 mM DTT. n = 5–6, for each group. *P < 0.05 vs. untreated group (based on one-way ANOVA corrected with Tukey’s post-hoc test); #P < 0.05 shows the significant inhibitory effect of DTT (300 μM NaHS vs. 300 μM NaHS+ 1 mM DTT). (B) XIC of LDHA treated with 10 or 100 μM NaHS. (C) Figure represents the ratio of the area under the peak of SSH-Cys163 vs. the area under the peak of the digested peptide without S-sulfhydration modification in LDHA. Data represent mean ± SEM and expressed as a percentage of the corresponding CTL.
3.3 LDHA silencing inhibits cell proliferation and sensitizes HCT116 cells to oxidative stress
Because of the role of oxidative stress in the biology of cancer cells, we have evaluated the effect of various concentrations of glucose oxidase (GOx, an enzyme, which - in the presence of glucose in the culture medium - produces low, continuous levels of hydrogen peroxide [H2O2]) on cell proliferation and cell viability responses, in the presence or absence of H2S donation.
In line with the results of the Extracellular Flux Analysis, basal MTT conversion (a global indicator of mitochondrial activity and cell viability) was lower in LDHA silenced cells than in cells treated with scrambled control siRNA (Fig. 10A). However, LDHA silencing did not significantly affect HCT116 cell proliferation (Fig. 11). H2O2 generation via GOx diminished MTT conversion in a concentration-dependent manner in both scrambled siRNA control and siLDHA cells (Fig. 10A); these effects were more pronounced in the siLDHA cells; in other words, LDHA silencing sensitized the HCT116 cells to the inhibitory effect of H2O2 on mitochondrial MTT conversion. However, H2O2 generation, in the GOx concentration range used in the current study, did not manifest in increased LDH levels in the culture medium (Fig. 10B), indicative that the cells did not develop necrosis. With respect to cell proliferation, the lowest concentrations of GOx used (0.01 U/ml) increased cell proliferation in wild-type (scrambled siRNA-treated) cells, while it inhibited cell proliferation in siLDHA cells. Higher concentrations (0.03 and 0.1 U/ml) of GOx inhibited cell proliferation in both cell lines, with the effect being much more pronounced in the siLDHA cells (Fig. 11). Indeed, an increase in cell death (evidenced by increased cell subpopulations exhibiting early and late apoptosis) was observed in siLDHA cells co-treated with GYY and 0.03 U/ml GOx (Fig. 10C and D). In short, the data show that LDHA silencing markedly potentiates the antiproliferative effect of oxidative stress.
Figure 10. LDHA silencing sensitizes HCT116 cells to oxidative stress and increases the proportion of apoptotic cells after GYY4137 treatment.
HCT116 cells (either with scrambled siRNA treatment or with siRNA-mediated LDHA silencing) were treated with vehicle or GOx (0.01–0.1 U/mL) for 1 h. Next, the cells were washed and the medium was replaced with vehicle or GYY4137 (0.3 mM) and incubated for another 24 h. (A) MTT reduction in HCT116 transiently transfected with control or siRNA specific LDHA treated under various conditions. (B) Necrotic cell death determined by LDH release in control or siLDHA transfected HCT116 under various treatment conditions. Data represent mean ± SEM and expressed as a percentage of the corresponding siRNA CTL group. (C) Graph represents changes in subpopulations of apoptotic cells. Solid bars reflect siRNA groups while stripped bars denote siLDHA groups. Total cell number in each group was set to 100%. (D) Apoptotic rate was calculated by dividing the sum of stained cells to live cells. n = 5–8, for each group (A); n = 6, for each group (B); n = 3, for each group (C,D). *P < 0.05 vs. siRNA CTL, #P < 0.05 vs. siLDHA CTL; ‡P < 0.05 vs. siLDHA GYY4137 group; †P < 0.05 (based on two-way ANOVA corrected with Tukey’s post-hoc test).
Figure 11. LDHA silencing inhibits HCT116 cell proliferation under moderate oxidative stress conditions.
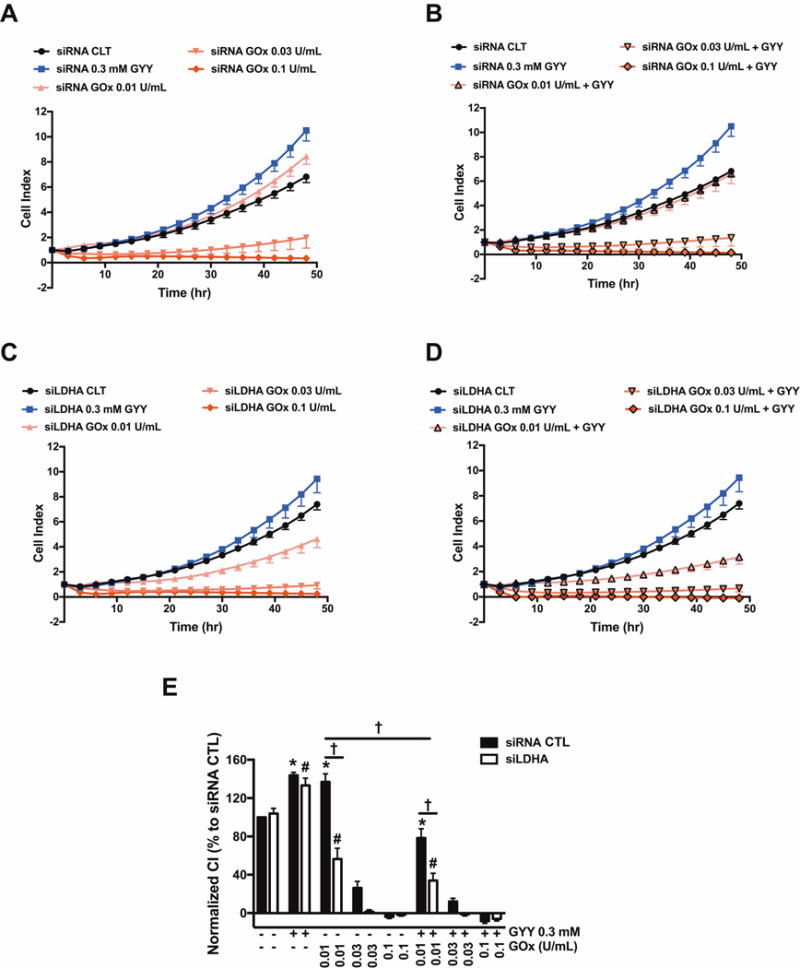
HCT116 cells (either with scrambled siRNA treatment or with siRNA-mediated LDHA silencing) were seeded at the density of 6,000 cells per well in xCELLigence plates and proliferation was monitored for 24 h. Thereafter, cells were treated with or without GYY4137 (0.3 mM) with or with GOx (0.01–0.1 U/ml), and proliferation was monitored for another 48 h. Cell proliferation is shown over time for siRNA (A, B) and siLDHA cells (C, D) under various treatments. (E) Statistical analysis of cell proliferation endpoints normalized to cell index and expressed as a percentage of the corresponding control group. Data represent mean ± SEM. n = 5–6, for each group. *P < 0.05 vs. siRNA CTL, #P < 0.05 vs. siLDHA CTL; †P < 0.05 (based on two-way ANOVA corrected with Tukey’s post-hoc test).
Exposure of the HCT116 cells to H2S via GYY4137 (at 0.3 mM, a concentration at which the donor increased both oxidative phosphorylation and glycolysis in wild-type cells; see above) did not have a significant effect on MTT conversion in wild-type cells, but increased it in siLDHA cells (Fig. 10). The inhibitory effects of GOx on mitochondrial MTT conversion remained largely unaffected by the H2S donor (Fig. 10A), while at the highest concentration of GOx used, in the scrambled siRNA control cells (but not in the siLDHA cells), the combination of H2S and H2O2 generation increased cytosolic LDH activity (Fig. 10B), possibly suggestive of a cytotoxic effect. (It must be noted, however, that - based on the results of the current study - the validity of cell viability assays that are solely based on the measurement of LDH activity in the supernatant must be re-evaluated; see also Discussion).
GYY4137 also increased basal cell proliferation, both in scrambled siRNA-treated control cells and in siLDHA cells (Fig. 11). GYY4137 adversely affected the GOx-induced effects on cell proliferation: for instance, 0.01 U/ml GOx, on its own, stimulated HCT116 proliferation in control cells, while in the presence of the H2S donor, the same concentration of GOx caused an approximately 50% inhibition of proliferation. A more pronounced degree of GOx + GYY4137 induced suppression of cell proliferation was observed in the LDHA-silenced cells than in the control siRNA-treated cells (Fig. 11); these effects were associated with (and perhaps - at least in part - due to an increase in cell death / decrease in cell viability in the LDHA-silenced cells (Fig. 10C).
4. Discussion
The key conclusions of the current paper are the following: (1) In HCT116 cells, LDHA catalyzes the conversion of pyruvate to lactate; (2) total cellular lactate levels are increased by H2S donation; (3) the catalytic activity of LDHA is markedly enhanced by H2S (with H2S also exerting a slight stimulatory effect on LDHB activity); (4) the H2S-mediated enhancement of LDHA activity is, at least in part, mediated by S-sulfhydration of its Cys163; (5) basal LDHA activity in HCT116 cells is important to maintain glycolysis, but it is not required to maintain basal oxidative phosphorylation; (6) H2S stimulates oxidative phosphorylation in HCT116 cells in a manner that is dependent on LDHA; (7) H2S stimulates glycolysis in HCT116 cells in a manner that is not prevented by LDHA silencing, and therefore, must be largely independent of LDHA activation; (8) basal LDHA activity in HCT116 cells is not obligatory to maintain cell proliferation; (9) under conditions of oxidative stress; LDHA activity becomes essential to maintain HCT116 cell viability and proliferation, and (10) oxidative stress prevents the ability of H2S to stimulate HCT116 proliferation.
The current findings are in line with prior data, demonstrating (a) the importance of LDHA in the support of basal lactate generation and basal maintenance of the glycolytic activity of cancer cells [28–36] (b) the ability of H2S to increase the catalytic activity of LDHA [3,27]. In addition, the data presented in the current paper, overall, are consistent with multiple sets of prior data indicating that H2S donation, at low concentrations, exerts positive bioenergetic effects on cancer cells and stimulates cell proliferation (see: Introduction), while higher concentrations of H2S suppress these responses (overviewed in [7]). We conclude that the stimulatory bioenergetic effects of the H2S donor GYY4137, on mitochondrial electron transport and oxidative phosphorylation parameters, require the presence of LDHA (Fig. 4), while the stimulatory effects of GYY4137 on glycolysis (Fig. 5) and on cell proliferation (Fig. 11) appear to be largely independent of LDHA.
How do we interpret the combination of findings that (a) LDHA silencing inhibits baseline glycolysis; (b) H2S activates LDHA and increases cellular lactate levels; (c) H2S also increases cellular pyruvate levels; (d) H2S activates glycolysis and yet (e) LDHA silencing does not prevent the activating effect of H2S on glycolysis? Since LDHA activity is expected to reduce cellular NAD+, the inhibition of basal glycolysis after LDHA silencing may be due to the inhibition of glycerol-3-phosphate dehydrogenase (a NAD+-dependent enzyme). We hypothesize that the activating effect of H2S on glycolysis may involve glycolytic enzymes other than LDHA - for instance, GAPDH, an enzyme previously identified target of H2S [37].
The current data indicate that the stimulatory effect of H2S on HCT116 cell bioenergetics and the stimulatory effect of H2S on cell proliferation don’t always occur simultaneously. This may be due to the fact, that H2S can stimulate cell proliferation pathways independently of its action cellular bioenergetics. For instance, H2S has been previously demonstrated to stimulate the Akt/PI3K pathway in various tumor cells [38–40].
The current paper shows that H2S induces the S-sulfhydration of LDHA. While multiple S-sulfhydrated cysteines have been identified (Table 1), the mutation studies on Cys163 suggest that sulfhydration of this particular amino acid plays an important functional role. However, one caveat of these studies is that the basal activity of LDHA was also markedly reduced by this mutation, indicating the functional importance of this cysteine in the activity of the enzyme (even in the absence of exogenous H2S stimulation). It is conceivable that basal, endogenous H2S production maintains a baseline, physiological sulfhydration of LDHA, thereby maintaining its catalytic activity. Of note, Cys163 of LDHA has previously been previously identified as an important regulatory site of this enzyme via S-nitrosation [41].
How, then, does the H2S-stimulated LDHA activity increase mitochondrial respiration in HCT116 cells? Measurements of total cellular lactate and pyruvate levels (Fig. 3) may offer some clues, but they do not provide a full picture, because there are separate cytosolic and mitochondrial lactate and pyruvate pools [42,43], which have not been measured in the current study. Considering, nevertheless, that total cellular lactate levels are substantially higher than pyruvate levels [42], GYY4137 elicited an increase in total cellular lactate/pyruvate ratio. Moreover, the GYY4137-stimulated increase in total cellular lactate levels was abolished by LDHA silencing, while the changes in pyruvate were only slightly affected. This suggests that the H2S-induced changes in cellular pyruvate levels must primarily occur through cellular targets other than LDHA: with LDHB being a possible candidate.
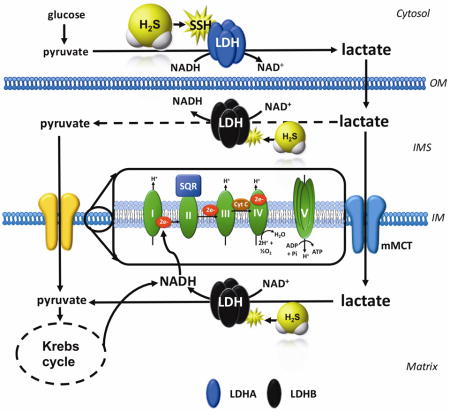
Our current working hypothesis (Fig. 12) is the following: (a) H2S stimulates cytosolic LDHA activity, which, in turn, (b) increases cytosolic lactate levels; (c) some of this lactate is transported into the mitochondria, where (d) it gets converted into pyruvate via LDHB - which, according to recent studies, is the predominant mitochondrial LDH isoform in cancer cells [43], which, in turn, (e) produces electron donors to increase mitochondrial electron flow, cellular respiration and, ultimately, ATP generation. The various additional effects of H2S, occurring via different mechanisms (see: Introduction) are also likely to contribute to the increased cellular bioenergetic function measured after GYY4137 treatment.
Figure 12. Working hypothesis H2S stimulates LDHA activity and stimulates mitochondrial electron transport in colon cancer cells.
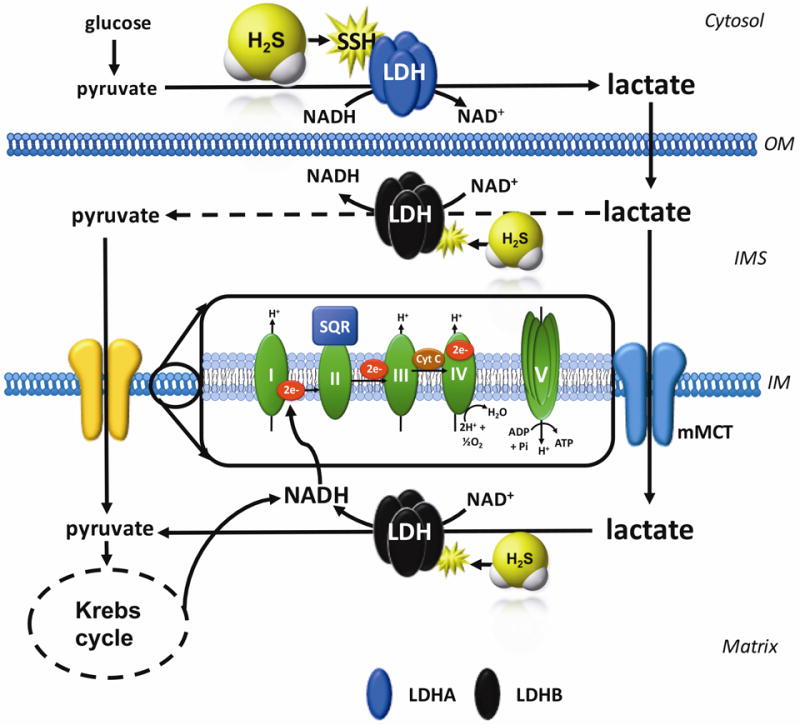
H2S increases the catalytic activity of LDHA (which is primary cytosolic, for instance, four LDHA tetramers constitute LDH5). This results in an increase in cytosolic lactate, followed by an increased flux of lactate into the mitochondria through the intracellular lactate shuttle. Lactate enters the mitochondrial intermembrane space; lactate and pyruvate also enter the mitochondrial matrix (the latter process is facilitated by the mitochondrial monocarboxylate transporter (mMCT). Lactate is oxidized to pyruvate via the mitochondrial LDH (which is primarily made up from LDHB; this response may also be stimulated by H2S). Pyruvate in the mitochondria is oxidized via the Krebs cycle to produce electron donors (NADH), which, in turn stimulates mitochondrial electron transport. In addition, the lactate-pyruvate conversion, catalyzed by mitochondrial LDH, utilizes NAD+ and produces NADH. This NADH, in turn, can be used by the mitochondrial electron chain to further support electron transport. IM, inner mitochondrial membrane; IMS, inner mitochondrial membrane space; OM, outer mitochondrial membrane.
One caveat of the current functional model that it is based on data generated using the H2S donor GYY4137; this additional H2S is added to the cells over and above their (already substantial) endogenous H2S levels, with H2S produced from CBS being the principal supporter of cellular bioenergetics in HCT116 cells [1]. When cancer cells produce H2S from strictly endogenous sources, the relative contribution of the various H2S-associated metabolic and bioenergetic components to the overall bioenergetic response may be different. Nevertheless, prior studies in HCT116 cells have demonstrated that the stimulatory effect of GYY4137 is maintained even after the pharmacological inhibition of endogenous H2S production [44].
Given the well-known bell-shaped bioenergetic effect of H2S [7,44], it was not surprising to us that the highest concentration of GYY4137 no longer stimulated mitochondrial electron transport, and, in fact, exerted inhibitory effect on some of the bioenergetic parameters (Fig. 4); this is the expected bioenergetic response, primarily mediated by the direct inhibition of mitochondrial Complex IV (cytochrome c oxidase) by H2S [18,19]. However, it was surprising that the stimulatory effect of GYY4137 on cellular lactate levels (a rather substantial increase at 0.1 and 0.3 mM) was no longer apparent at 1 mM. This may indicate that, at high H2S fluxes, there may be an inhibitory effect of H2S on LDHA activity - either via S-sulfhydration or perhaps through additional mechanisms; this remains to be explored in future studies.
The last part of the current study began to explore the interrelationship between oxidative stress and the LDHA/H2S interactions identified in the current study. We have selected a scenario where cells were first pre-exposed to glucose oxidase (to induce a pre-existing oxidative stress), followed by a washout and subsequent exposure to the H2S donors. This design intended to avoid potential complex chemical direct interactions between H2S and various ROS generated by GOx. Given the known pro-proliferative signaling effect of low concentrations of ROS [45], it was not surprising that the lowest concentration of GOx used stimulated (rather than inhibited) HCT116 proliferation. At higher concentration, the expected concentration-dependent inhibition of cell proliferation by ROS was noted. Interestingly, the low-ROS induced stimulation of cell proliferation was no longer noted in cells with LDHA silencing. It should be mentioned that LDHA silencing has previously been shown to increase oxidative stress - at least in part via stimulation of membrane-associated NADPH oxidase (NOX) [46,47]. An increased basal generation of ROS in siLDHA transfected HCT116 cells may explain why GOx (0.01 U/ml) did not increase siLDHA cell proliferation (Fig. 10C).
The role of ROS in tumor cells is a complex and multifaceted one. According to several studies, some tumor cells are resistant against exogenous H2O2-induced apoptosis, likely due to the high concentration of membrane-associated catalase [48,49]. Tumor cells regulate intercellular apoptosis-inducing ROS signaling, at least in part, through the activity of membrane-associated extracellular catalase. Whether LDHA or H2S affects these processes, and whether this influences the proliferation or the survival of the HCT116 cells remains to be studied in future experiments.
Our findings may have some general methodological implications, as well. Quantification of LDH activity in tissue culture medium is commonly used to estimate cell death, because, as the integrity of the cell membrane is disrupted, intracellular content (including LDH) is leaking to the extracellular space [50,51]. The method assumes that the amount of LDH in the cell culture supernatant is proportional with its enzymatic activity. However, if the presence of endogenous factors (e.g. H2S, as shown in the current study) affects the specific LDH activity, the relationship between LDH content and LDH activity may no longer be linear. This issue needs to be kept in mind when employing LDH-related assays, especially in studies where cellular H2S homeostasis is pharmacologically modulated.
Taken together, the current report supports the importance of LDHA as a tumor-cell-supporting bioenergetic factor and anticancer target. Moreover, it identifies LDHA as a novel effector of H2S-induced bioenergetic responses in cancer cells. LDHA, via S-sulfhydration, is activated by H2S, and this response, in turn, appears to be obligatory for the stimulatory effect of low-to-intermediate concentrations of H2S on HCT116 cancer cell mitochondrial electron transport and bioenergetics. The current report further supports the general concept that depriving cancer cells of their H2S “supply” may be used as an anticancer approach.
Acknowledgments
This work was supported by grants from the National Institutes of Health (R01 CA175803) and the Cancer Prevention Research Institute of Texas (DP150074).
Abbreviations
- 2-DG
2-deoxyglucose
- AA
antimycin A
- ATP
adenosine triphosphate
- CBS
cystathionine-β-synthase
- CSE
cystathionine gamma lyase
- CTL
control
- FCCP
carbonyl cyanide 4-(trifluoromethoxy)phenylhydrazone
- GOx
glucose oxidase
- H2O2
hydrogen peroxide
- H2S
hydrogen sulfide
- INT
2-(4-Iodophenyl)-3-(4-nitrophenyl)-5-phenyl-2H-tetrazolium chloride
- LDH
lactate dehydrogenase
- MTT
3-(4,5-dimethyl-2-thiazolyl)-2,5-diphenyl-2H-tetrazolium bromide
- NAD
nicotinamide adenine dinucleotide
- NOX
NADPH oxidase
- OCR
oxygen consumption rate
- oligo
oligomycin
- PMS
N-methylphenazonium methyl sulfate
- PPR
proton production rate
- ROS
reactive oxygen species
- Rot
rotenone
- SSH
S-sulfhydration
- TCA
tricarboxylic acid
- Vmax
the maximum rate of the reaction
- WT
wild-type
- XIC
extracted ion
Footnotes
Publisher's Disclaimer: This is a PDF file of an unedited manuscript that has been accepted for publication. As a service to our customers we are providing this early version of the manuscript. The manuscript will undergo copyediting, typesetting, and review of the resulting proof before it is published in its final citable form. Please note that during the production process errors may be discovered which could affect the content, and all legal disclaimers that apply to the journal pertain.
Author Disclosure Statement
C.S. and M.R.H. are founders and shareholders of CBS Therapeutics Inc., an UTMB spin-off company focusing on therapeutic approaches around H2S biosynthesis inhibition in cancer cells. For the other authors, no competing financial interests exist.
Author contributions
AAU - carried out molecular biology and pharmacological assays, contributed to writing the paper. GO - performed flow cytometry analysis; KM - advised on Seahorse analysis and revised the manuscript critically for scientific content; MRH - contributed to experimental design and data interpretation and manuscript writing. CS - designed, planned and supervised the project, wrote the paper.
References
- 1.Szabo C, Coletta C, Chao C, Módis K, Szczesny B, Papapetropoulos A, et al. Tumor-derived hydrogen sulfide, produced by cystathionine-β-synthase, stimulates bioenergetics, cell proliferation, and angiogenesis in colon cancer. Proc Natl Acad Sci USA. 2013;110:12474–9. doi: 10.1073/pnas.1306241110. [DOI] [PMC free article] [PubMed] [Google Scholar]
- 2.Módis K, Coletta C, Asimakopoulou A, Szczesny B, Chao C, Papapetropoulos A, et al. Effect of S-adenosyl-L-methionine (SAM), an allosteric activator of cystathionine-β-synthase (CBS) on colorectal cancer cell proliferation and bioenergetics in vitro. Nitric Oxide. 2014;41:146–56. doi: 10.1016/j.niox.2014.03.001. [DOI] [PMC free article] [PubMed] [Google Scholar]
- 3.Chao C, Zatarain JR, Ding Y, Coletta C, Mrazek AA, Druzhyna N, et al. Cystathionine-β-synthase inhibition for colon cancer: enhancement of the efficacy of aminooxyacetic acid via the prodrug approach. Mol Med. 2016;22:361–79. doi: 10.2119/molmed.2016.00102. [DOI] [PMC free article] [PubMed] [Google Scholar]
- 4.Bhattacharyya S, Saha S, Giri K, Lanza IR, Nair KS, Jennings NB, et al. Cystathionine beta-synthase (CBS) contributes to advanced ovarian cancer progression and drug resistance. PLoS One. 2013;8:e79167. doi: 10.1371/journal.pone.0079167. [DOI] [PMC free article] [PubMed] [Google Scholar]
- 5.Sen S, Kawahara B, Gupta D, Tsai R, Khachatryan M, Roy-Chowdhuri S, et al. Role of cystathionine β-synthase in human breast Cancer. Free Radic Biol Med. 2015;86:228–38. doi: 10.1016/j.freeradbiomed.2015.05.024. [DOI] [PubMed] [Google Scholar]
- 6.Szczesny B, Marcatti M, Zatarain JR, Druzhyna N, Wiktorowicz JE, Nagy P, et al. Inhibition of hydrogen sulfide biosynthesis sensitizes lung adenocarcinoma to chemotherapeutic drugs by inhibiting mitochondrial DNA repair and suppressing cellular bioenergetics. Sci Rep. 2016;6:36125. doi: 10.1038/srep36125. [DOI] [PMC free article] [PubMed] [Google Scholar]
- 7.Szabo C. Gasotransmitters in cancer: from pathophysiology to experimental therapy. Nat Rev Drug Discov. 2016;15:185–203. doi: 10.1038/nrd.2015.1. [DOI] [PMC free article] [PubMed] [Google Scholar]
- 8.Goubern M, Andriamihaja M, Nübel T, Blachier F, Bouillaud F. Sulfide, the first inorganic substrate for human cells. FASEB J. 2007;21:1699–706. doi: 10.1096/fj.06-7407com. [DOI] [PubMed] [Google Scholar]
- 9.Módis K, Coletta C, Erdélyi K, Papapetropoulos A, Szabo C. Intramitochondrial hydrogen sulfide production by 3-mercaptopyruvate sulfurtransferase maintains mitochondrial electron flow and supports cellular bioenergetics. FASEB J. 2013;27:601–11. doi: 10.1096/fj.12-216507. [DOI] [PubMed] [Google Scholar]
- 10.Abou-Hamdan A, Guedouari-Bounihi H, Lenoir V, Andriamihaja M, Blachier F, Bouillaud F. Oxidation of H2S in mammalian cells and mitochondria. Methods Enzymol. 2015;554:201–28. doi: 10.1016/bs.mie.2014.11.042. [DOI] [PubMed] [Google Scholar]
- 11.Módis K, Panopoulos P, Coletta C, Papapetropoulos A, Szabo C. Hydrogen sulfide-mediated stimulation of mitochondrial electron transport involves inhibition of the mitochondrial phosphodiesterase 2A, elevation of cAMP and activation of protein kinase A. Biochem Pharmacol. 2013;86:1311–9. doi: 10.1016/j.bcp.2013.08.064. [DOI] [PubMed] [Google Scholar]
- 12.Pun PB, Lu J, Kan EM, Moochhala S. Gases in the mitochondria. Mitochondrion. 2010;10:83–93. doi: 10.1016/j.mito.2009.12.142. [DOI] [PubMed] [Google Scholar]
- 13.Suzuki K, Olah G, Modis K, Coletta C, Kulp G, Gerö D, et al. Hydrogen sulfide replacement therapy protects the vascular endothelium in hyperglycemia by preserving mitochondrial function. Proc Natl Acad Sci USA. 2011;108:13829–34. doi: 10.1073/pnas.1105121108. [DOI] [PMC free article] [PubMed] [Google Scholar]
- 14.Xie ZZ, Liu Y, Bian JS. Hydrogen sulfide and cellular redox homeostasis. Oxid Med Cell Longev. 2016;2016:6043038. doi: 10.1155/2016/6043038. [DOI] [PMC free article] [PubMed] [Google Scholar]
- 15.Szczesny B, Módis K, Yanagi K, Coletta C, Le Trionnaire S, Perry A, et al. AP39, a novel mitochondria-targeted hydrogen sulfide donor, stimulates cellular bioenergetics, exerts cytoprotective effects and protects against the loss of mitochondrial DNA integrity in oxidatively stressed endothelial cells in vitro. Nitric Oxide. 2014;41:120–30. doi: 10.1016/j.niox.2014.04.008. [DOI] [PMC free article] [PubMed] [Google Scholar]
- 16.Módis K, Ju Y, Ahmad A, Untereiner AA, Altaany Z, Wu L, et al. S-Sulfhydration of ATP synthase by hydrogen sulfide stimulates mitochondrial bioenergetics. Pharmacol Res. 2016;113:116–24. doi: 10.1016/j.phrs.2016.08.023. [DOI] [PMC free article] [PubMed] [Google Scholar]
- 17.Nicholls P. Inhibition of cytochrome c oxidase by sulphide. Biochem Soc Trans. 1975;3:316–9. doi: 10.1042/bst0030316. [DOI] [PubMed] [Google Scholar]
- 18.Szabo C, Ransy C, Módis K, Andriamihaja M, Murghes B, Coletta C, et al. Regulation of mitochondrial bioenergetic function by hydrogen sulfide. Part I. Biochemical and physiological mechanisms. Br J Pharmacol. 2014;171:2099–122. doi: 10.1111/bph.12369. [DOI] [PMC free article] [PubMed] [Google Scholar]
- 19.Modis K, Bos EM, Calzia E, van Goor H, Coletta C, Papapetropoulos A, et al. Regulation of mitochondrial bioenergetic function by hydrogen sulfide. Part II. Pathophysiological and therapeutic aspects. Br J Pharmacol. 2014;171:2123–46. doi: 10.1111/bph.12368. [DOI] [PMC free article] [PubMed] [Google Scholar]
- 20.Doherty JR, Cleveland JL. Targeting lactate metabolism for cancer therapeutics. J Clin Invest. 2013;123:3685–92. doi: 10.1172/JCI69741. [DOI] [PMC free article] [PubMed] [Google Scholar]
- 21.Fiume L, Manerba M, Vettraino M, Di Stefano G. Inhibition of lactate dehydrogenase activity as an approach to cancer therapy. Future Med Chem. 2014;6:429–45. doi: 10.4155/fmc.13.206. [DOI] [PubMed] [Google Scholar]
- 22.Augoff K, Hryniewicz-Jankowska A, Tabola R. Lactate dehydrogenase 5: an old friend and a new hope in the war on cancer. Cancer Lett. 2015;358:1–7. doi: 10.1016/j.canlet.2014.12.035. [DOI] [PubMed] [Google Scholar]
- 23.Gallo M, Sapio L, Spina A, Naviglio D, Calogero A, Naviglio S. Lactic dehydrogenase and cancer: an overview. Front Biosci (Landmark Ed) 2015;20:1234–49. doi: 10.2741/4368. [DOI] [PubMed] [Google Scholar]
- 24.Petrelli F, Cabiddu M, Coinu A, Borgonovo K, Ghilardi M, Lonati V, et al. Prognostic role of lactate dehydrogenase in solid tumors: a systematic review and meta-analysis of 76 studies. Acta Oncol. 2015;54:961–70. doi: 10.3109/0284186X.2015.1043026. [DOI] [PubMed] [Google Scholar]
- 25.Rani R, Kumar V. Recent update on human lactate dehydrogenase enzyme 5 (hLDH5) inhibitors: A promising approach for cancer chemotherapy. J Med Chem. 2016;59:487–96. doi: 10.1021/acs.jmedchem.5b00168. [DOI] [PubMed] [Google Scholar]
- 26.Valvona CJ, Fillmore HL, Nunn PB, Pilkington GJ. The regulation and function of lactate dehydrogenase A: therapeutic potential in brain tumor. Brain Pathol. 2016;26:3–17. doi: 10.1111/bpa.12299. [DOI] [PMC free article] [PubMed] [Google Scholar]
- 27.Liang M, Jin S, Wu DD, Wang MJ, Zhu YC. Hydrogen sulfide improves glucose metabolism and prevents hypertrophy in cardiomyocytes. Nitric Oxide Biol Chem. 2015;46:114–22. doi: 10.1016/j.niox.2014.12.007. [DOI] [PubMed] [Google Scholar]
- 28.Le A, Cooper CR, Gouw AM, Dinavahi R, Maitra A, Deck LM, et al. Inhibition of lactate dehydrogenase A induces oxidative stress and inhibits tumor progression. Proc Natl Acad Sci USA. 2010;107:2037–42. doi: 10.1073/pnas.0914433107. [DOI] [PMC free article] [PubMed] [Google Scholar]
- 29.Xie H, Hanai J, Ren JG, Kats L, Burgess K, Bhargava P, et al. Targeting lactate dehydrogenase— a inhibits tumorigenesis and tumor progression in mouse models of lung cancer and impacts tumor-initiating cells. Cell Metab. 2014;19:795–809. doi: 10.1016/j.cmet.2014.03.003. [DOI] [PMC free article] [PubMed] [Google Scholar]
- 30.Allison SJ, Knight JR, Granchi C, Rani R, Minutolo F, Milner J, et al. Identification of LDH-A as a therapeutic target for cancer cell killing via (i) p53/NAD(H)-dependent and (ii) p53-independent pathways. Oncogenesis. 2014;3:e102. doi: 10.1038/oncsis.2014.16. [DOI] [PMC free article] [PubMed] [Google Scholar]
- 31.Liu X, Yang Z, Chen Z, Chen R, Zhao D, Zhou Y, et al. Effects of the suppression of lactate dehydrogenase A on the growth and invasion of human gastric cancer cells. Oncol Rep. 2015;33:157–62. doi: 10.3892/or.2014.3600. [DOI] [PubMed] [Google Scholar]
- 32.Daniele S, Giacomelli C, Zappelli E, Granchi C, Trincavelli ML, Minutolo F, et al. Lactate dehydrogenase-A inhibition induces human glioblastoma multiforme stem cell differentiation and death. Sci Rep. 2015;5:15556. doi: 10.1038/srep15556. [DOI] [PMC free article] [PubMed] [Google Scholar]
- 33.Xian ZY, Liu JM, Chen QK, Chen HZ, Ye CJ, Xue J, et al. Inhibition of LDHA suppresses tumor progression in prostate cancer. Tumour Biol. 2015;36:8093–100. doi: 10.1007/s13277-015-3540-x. [DOI] [PMC free article] [PubMed] [Google Scholar]
- 34.Wang J, Wang H, Liu A, Fang C, Hao J, Wang Z. Lactate dehydrogenase A negatively regulated by miRNAs promotes aerobic glycolysis and is increased in colorectal cancer. Oncotarget. 2015;6:19456–68. doi: 10.18632/oncotarget.3318. [DOI] [PMC free article] [PubMed] [Google Scholar]
- 35.Wang ZY, Loo TY, Shen JG, Wang N, Wang DM, Yang DP, et al. LDH-A silencing suppresses breast cancer tumorigenicity through induction of oxidative stress mediated mitochondrial pathway apoptosis. Breast Cancer Res Treat. 2012;131:791–800. doi: 10.1007/s10549-011-1466-6. [DOI] [PubMed] [Google Scholar]
- 36.Rellinger EJ, Craig BT, Alvarez AL, Dusek HL, Kim KW, Qiao J, et al. FX11 inhibits aerobic glycolysis and growth of neuroblastoma cells Surgery. 2017 doi: 10.1016/j.surg.2016.09.009. in press. [DOI] [PMC free article] [PubMed] [Google Scholar]
- 37.Mustafa AK, Gadalla MM, Sen N, Kim S, Mu W, Gazi SK, et al. H2S signals through protein S-sulfhydration. Sci Signal. 2009;2:ra72. doi: 10.1126/scisignal.2000464. [DOI] [PMC free article] [PubMed] [Google Scholar]
- 38.Huang Y, Li F, Tong W, Zhang A, He Y, Fu T, et al. Hydrogen sulfide, a gaseous transmitter, stimulates proliferation of interstitial cells of Cajal via phosphorylation of AKT protein kinase. Tohoku J Exp Med. 2010;221:125–32. doi: 10.1620/tjem.221.125. [DOI] [PubMed] [Google Scholar]
- 39.Yin P, Zhao C, Li Z, Mei C, Yao W, Liu Y, et al. Sp1 is involved in regulation of cystathionine γ-lyase gene expression and biological function by PI3K/Akt pathway in human hepatocellular carcinoma cell lines. Cell Signal. 2012;24:1229–40. doi: 10.1016/j.cellsig.2012.02.003. [DOI] [PubMed] [Google Scholar]
- 40.Zheng D, Chen Z, Chen J, Zhuang X, Feng J, Li J. Exogenous hydrogen sulfide exerts proliferation, anti-apoptosis, migration effects and accelerates cell cycle progression in multiple myeloma cells via activating the Akt pathway. Oncol Rep. 2016;36:1909–16. doi: 10.3892/or.2016.5014. [DOI] [PubMed] [Google Scholar]
- 41.Sengupta R, Holmgren A. Thioredoxin and thioredoxin reductase in relation to reversible s-nitrosylation. Antioxid Redox Signal. 2013;18:259–69. doi: 10.1089/ars.2012.4716. [DOI] [PubMed] [Google Scholar]
- 42.Brooks GA, Dubouchaud H, Brown M, Sicurello JP, Butz CE. Role of mitochondrial lactate dehydrogenase and lactate oxidation in the intracellular lactate shuttle. Proc Natl Acad Sci USA. 1999;96:1129–34. doi: 10.1073/pnas.96.3.1129. [DOI] [PMC free article] [PubMed] [Google Scholar]
- 43.Chen YJ, Mahieu NG, Huang X, Singh M, Crawford PA, Johnson SL, Gross RW, Schaefer J, Patti GJ. Lactate metabolism is associated with mammalian mitochondria. Nat Chem Biol. 2016;12:937–94. doi: 10.1038/nchembio.2172. [DOI] [PMC free article] [PubMed] [Google Scholar]
- 44.Hellmich MR, Coletta C, Chao C, Szabo C. The therapeutic potential of cystathionine β-synthetase/hydrogen sulfide inhibition in cancer. Antioxid Redox Signal. 2015;22:424–48. doi: 10.1089/ars.2014.5933. [DOI] [PMC free article] [PubMed] [Google Scholar]
- 45.Schieber M, Chandel NS. ROS function in redox signaling and oxidative stress. Curr Biol. 2014;24:R453–62. doi: 10.1016/j.cub.2014.03.034. [DOI] [PMC free article] [PubMed] [Google Scholar]
- 46.Irani K1, Xia Y, Zweier JL, Sollott SJ, Der CJ, Fearon ER, Sundaresan M, Finkel T, Goldschmidt-Clermont PJ. Mitogenic signaling mediated by oxidants in Ras-transformed fibroblasts. Science. 1997;275:1649–52. doi: 10.1126/science.275.5306.1649. [DOI] [PubMed] [Google Scholar]
- 47.Le A, Cooper CR, Gouw AM, Dinavahi R, Maitra A, Deck LM, Royer RE, Vander Jagt DL, Semenza GL, Dang CV. Inhibition of lactate dehydrogenase A induces oxidative stress and inhibits tumor progression. Proc Natl Acad Sci USA. 2010;107:2037–42. doi: 10.1073/pnas.0914433107. [DOI] [PMC free article] [PubMed] [Google Scholar]
- 48.Heinzelmann S1, Bauer G. Multiple protective functions of catalase against intercellular apoptosis-inducing ROS signaling of human tumor cells. Biol Chem. 2010;391:675–93. doi: 10.1515/BC.2010.068. [DOI] [PubMed] [Google Scholar]
- 49.Böhm B, Heinzelmann S, Motz M, Bauer G. Extracellular localization of catalase is associated with the transformed state of malignant cells. Biol Chem. 2015;396:1339–56. doi: 10.1515/hsz-2014-0234. [DOI] [PubMed] [Google Scholar]
- 50.Korzeniewski C, Callewaert DM. An enzyme-release assay for natural cytotoxicity. J Immunol Meth. 1983;64:313–20. doi: 10.1016/0022-1759(83)90438-6. [DOI] [PubMed] [Google Scholar]
- 51.Decker T, Lohmann-Matthes ML. A quick and simple method for the quantitation of lactate dehydrogenase release in measurements of cellular cytotoxicity and tumor necrosis factor (TNF) activity. J Immunol Meth. 1988;115:61–9. doi: 10.1016/0022-1759(88)90310-9. [DOI] [PubMed] [Google Scholar]


