Abstract
Introduction
Studies have shown that cross-polarization optical coherence tomography (CP-OCT) can be used to image the internal structure of carious lesions in vivo. The objective of this study was to show that CP-OCT can be used to monitor changes in the internal structure of early active carious lesions on smooth surfaces during non-surgical intervention with fluoride.
Methods
Lesions on the smooth surfaces of teeth were imaged using CP-OCT on 17 test subjects. Lesion structural changes were monitored during fluoride varnish application at 6-week intervals for 30 weeks. The lesion depth (Ld), integrated reflectivity (ΔR), and surface zone thickness (Sz) were monitored.
Results
A distinct transparent surface zone that may be indicative of lesion arrestment was visible in CP-OCT images on 62/63 lesions before application of fluoride varnish. The lesion depth and internal structure were resolved for all the lesions. The overall change in the mean values for Ld, ΔR, and Sz for all the lesions was minimal and was not significant during the study (P > 0.05). Only 5/63 lesions manifested a significant increase in Sz during intervention.
Conclusion
Even though it appears that most of the lesions manifested little change with fluoride varnish application in the 30 weeks of the study, CP-OCT was able to measure the depth and internal structure of all the lesions including the thickness of the important transparent surface zone located at the surface of the lesions, indicating that CP-OCT is ideally suited for monitoring lesion severity in vivo.
Keywords: cross polarization optical coherence tomography, tooth demineralization, dental caries
Introduction
During dental decay, organic acids produced by cariogenic bacteria dissolve the mineral phase in the enamel and dentin increasing the tooth's porosity. The increased porosity of the demineralized enamel increases light scattering by 2–3 orders of magnitude at 1,300 nm which makes demineralization easily detected with near-IR optical techniques [1]. Dental decay or demineralization can be arrested or reversed if new mineral is deposited into the lesion. This can be accomplished with the application of fluoride that aids in the deposition of fluoroapatite mineral which is more resistant to dissolution than the original carbonated hydroxyapatite mineral phase [2]. Typically during remineralization, new mineral fills the outer layers of the lesion forming a highly mineralized outer transparent surface zone greatly reducing the diffusion of oral fluids into the body of the lesion. Growth of the lesion subsequently becomes arrested and no further dissolution (demineralization) or new mineral deposition (remineralization) occurs. Clinical criteria for caries lesion activity based on visual-tactile examination have been incorporated in the ICDAS II caries classification system [3,4]. However, dentists are unable to reliably assess lesion activity and determine whether lesions are active (undergoing demineralization) or arrested [2]. Arrested caries lesions exhibit a more glossy appearance with a surface hardness that is comparable to sound enamel because they have a highly mineralized surface layer on the outer surface of the lesion [5,6]. Optical diagnostic tools exploit changes in light scattering and have great potential for the diagnosis of the current “state of lesion activity,” that is, whether or not the caries lesion is active and expanding or whether the lesion has been arrested. Other technologies such as quantitative light fluorescence (QLF) have been used to monitor changes in lesions after fluoride intervention, however, this method does not resolve the internal changes in the lesion structure [7,8]. Several studies have demonstrated that polarization sensitive optical coherence tomography (PS-OCT) can be used to nondestructively measure the severity of subsurface demineralization in enamel and dentin and is therefore well suited for this role [9–20]. The most important advantage of OCT over other competing technologies is that it has the ability to acquire depth resolved images of the lesion structure with high resolution in vivo and that the integrated reflectivity measured nondestructively correlates with the integrated mineral loss measured with microradiography, the gold standard.
Ekstrand describes the patho-anatomical changes in enamel during caries initiation, progression and arrestment [5], definitive features, such as a weakly scattering transparent surface zone, form during the process of remineralization that are indicative of an arrested lesion. Kidd showed that there were structural differences in the histopathology of enamel lesions between young and old permanent teeth [21]. It is most likely that the lesions in older teeth better represent lower levels of lesion activity or arrested lesions because the lesions in the older teeth had larger and more definitive transparent surface zones than the lesions in younger teeth. Therefore, the thickness of this transparent surface zone may serve as an indicator of lesion activity. Since PS-OCT can resolve changes in lesion structure, that is, show the formation of a surface zone of reduced light scattering, we postulate that it can be used to monitor the lesion activity and help identify arrested lesions or developmental defects that do not need further intervention. Developmental defects typical of mild fluorosis that are not undergoing active demineralization also show a very thick transparent surface zone with higher mineral content than the hypomineralized body of the defect [2].
We developed an approach to quantifying the severity of demineralization by integrating the reflectivity of the orthogonal axis (⊥) or cross polarization image [13]. This approach also has the added advantage of reducing the intensity of the strong reflection from the tooth surface that can prevent resolution of the lesion area near the tooth surface, which is important for measurement of the lesion surface zone [22,23]. Use of cross polarization images also facilitates direct integration of the lesion reflectivity to quantify the lesion severity, regardless of the tooth topography. Since the most important information regarding lesion activity is near the surface of the lesion, a cross polarization OCT system is invaluable for imaging the internal surface structure of early lesions. In order to rapidly process the images and effectively quantify lesion severity, algorithms are needed to automatically extract lesion depth and severity information. We carried out the first clinical study using PS-OCT to monitor early lesions in 2010 [18] where we demonstrated that PS-OCT could monitor the development of new lesions on both smooth and occlusal tooth surfaces and the increases in the integrated reflectivity (ΔR) measured nondestructively in vivo were confirmed using transverse microradiography, the gold standard, after the teeth were extracted after imaging. We have also demonstrated that automated algorithms can be applied successfully both for in vitro and in vivo studies to calculate the depth of demineralization and the overall or integrated reflectivity from the zone of demineralization [24,25].
The objective of this study was to monitor changes in the depth (Ld), integrated reflectivity (ΔR), and surface zone thickness (Sz) of active lesions on test subjects during intervention with fluoride varnish using CP-OCT.
Materials and Methods
Clinical Protocol
This study involved the recruitment of 20 test subjects with enamel lesions on tooth facial (smooth) surfaces, 17 test subjects completed the study. Three test subjects dropped out during the study for unknown reasons. Most of the test subjects that completed the study (15/17) were assessed as high risk for dental caries, that is, each had multiple lesions on the tooth facial surfaces. It was anticipated that these test subjects would have a high percentage of active lesions that will respond to fluoride intervention. Test subjects were recruited from the UCSF predoctoral clinics that see ∼33,000 patient visits per year. Up to four lesions on each test subject were monitored for a period of 30 weeks. The OCT scans and the fluoride varnish were repeated once every 6 weeks for 30 weeks, thus producing data at 0, 6, 12, 18, 24, and 30 weeks.
The demographics of the patient population in the study were; 75% male and 25% female and all the test subjects recruited for the study were adults 18 or over. Permission to recruit and carry out the testing was obtained from the Committee on Human Research (CHR) at UCSF and subjects were fully informed of the procedures. Test subjects with at least two new lesions that were diagnosed using conventional visual and tactile methods and were recommended by clinicians in the predoctoral clinics for nonsurgical intervention were invited to participate in the study. The test subjects received topical fluoride varnish treatments at 6 week intervals. DuraShield (Sultan Healthcare, Englewood, NJ) 5% NaF varnish was used. Two scans of a selected 6 × 6 mm2 area encompassing the lesion were taken at each time point. Teeth were scanned just before fluoride varnish application and at 6-week intervals up to a period of 30-weeks. Digital photographs were taken at the beginning and end of the study. The inclusion and exclusion criteria are listed below.
(1) Inclusion criteria
These criteria will not be based on race or gender. Participants will be patients at the predoctoral dental clinic at UCSF and must be
Aged 18–60 years.
Able to give informed consent in English.
Willing to comply with all study procedures and protocols.
Residing in San Francisco or nearby locales with community fluoridation.
Must have at least two suspected, non-cavitated enamel lesions.
Willing to waive a HIPAA acknowledgment that data will only be used for research.
(2) Exclusion criteria
Subjects suffering from systemic diseases.
Taking medications that may effect the oral flora or salivary flow (e.g., antibiotic use in the past 3 months, drugs associated with dry mouth/xerostomia).
Other conditions that may decrease the likelihood of adherence to study protocol.
In-office fluoride treatment within the past 3 months.
Cross Polarization (CP)-OCT System
The cross polarization OCT system used for this study was purchased from Santec (Komaki, Aichi, Japan). This system acquires only the cross polarization image (CP-OCT), not both the cross and co-polarization images (PS-OCT). The Model IVS-300-CP utilizes a swept laser source; Santec Model HSL-200-30 operating with a 30 kHz a-scan sweep rate. The interferometer is integrated into the handpiece which also contains the microelectromechancial (MEMS) scanning mirror and the imaging optics. It is capable of acquiring complete tomographic images of a volume of 6 × 6 × 7 mm in approximately 3 seconds. The imaging system along with close-up images of the scanning hand-piece are shown in Figure 1. The body of the handpiece is 7 × 18 cm with an imaging tip that is 4 cm long and 1.5 cm across. This system operates at a wavelength of 1,321 nm with a bandwidth of 111 nm with a measured axial resolution in air of 11.4 μm (3 dB). The lateral resolution is 80 μm (1/e2) with a transverse imaging window of 6 × 6 mm and a measured imaging depth of 7 mm in air. The polarization extinction ratio was measured to be 32 dB.
Fig. 1.
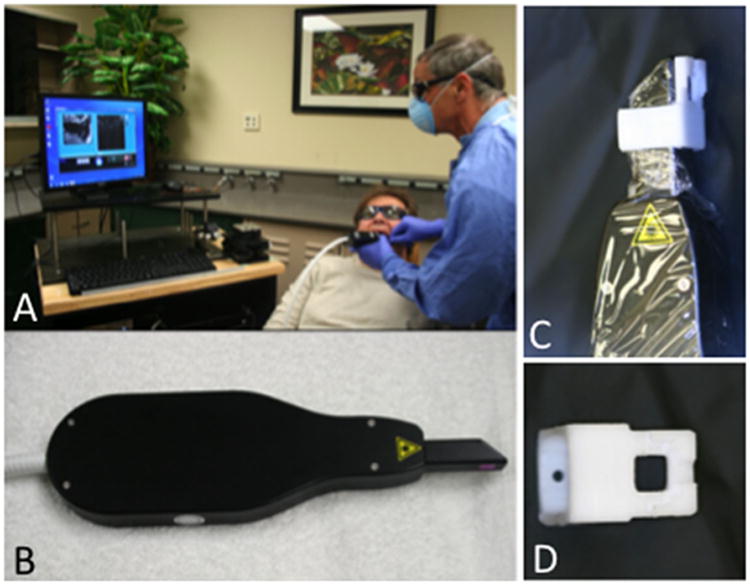
CP-OCT system from Santec used for the clinical study. (A) Scan is acquired in test subject, (B) scanning handpiece, (C) scanner with delrin sleeve and cellophane covering for infection control, and (D) delrin sleeve.
We developed a small sleeve made out of Delrin that fits over the window and prevents the brackets from coming in direct contact with the window of the scanner. Cellophane film is used as an infection control barrier on the handpiece which we found only minimally interferes with the images (Fig. 1). The sleeve was placed in direct contact with the tooth surface and it served to aid the positioning process and prevent damage to the window covering the OCT scanner. The Delrin sleeve was sterilized by autoclave prior to each procedure.
During clinical procedures the images were acquired by positioning the scanner against the tooth surface while acquiring real-time en face images of the tooth surface in preview mode using the Santec software. The images were acquired with the U-shaped gingival margin centered in the image so that images acquired at different time points could be aligned and compared. Figure 2 shows a surface rendering of a typical 3D image acquired showing the position of the enamel (E) and the gingiva (G) with the areas of high reflectivity shown in yellow. High reflectivity areas on the enamel indicate the position of the lesion (L).
Fig. 2.
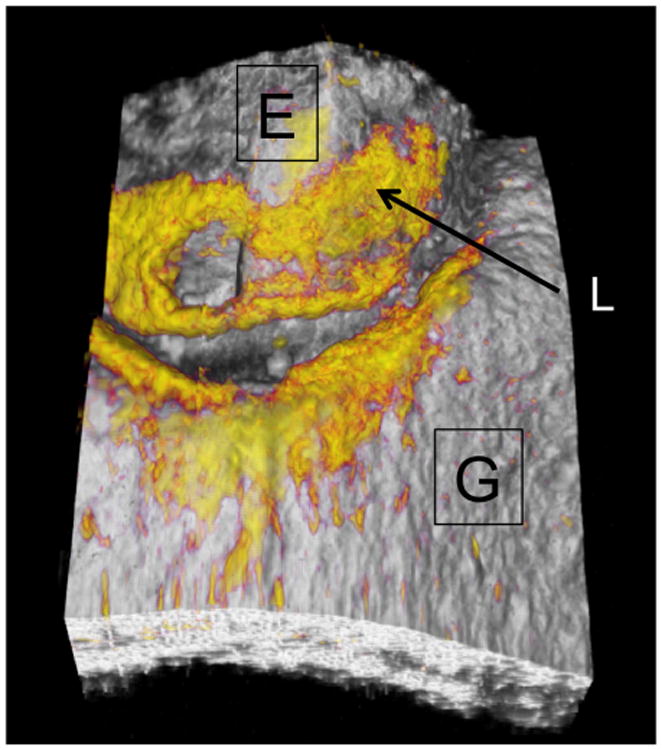
A surface rendering of a typical 3D image acquired showing the position of the enamel (E) and the gingiva (G) with the areas of high reflectivity shown in yellow. High reflectivity areas on the enamel indicate the position of the lesion (L).
Analysis of CP-OCT Images
CP-OCT scans were analyzed using software that we developed using LabView (National Instruments, Austin, TX). A 50 × 50 pixel square (∼1.5 ×1.5 mm) Region of Interest (ROI) centered on each lesion (see Fig. 3) was selected for each tooth and analyzed at each time point.
Fig. 3.
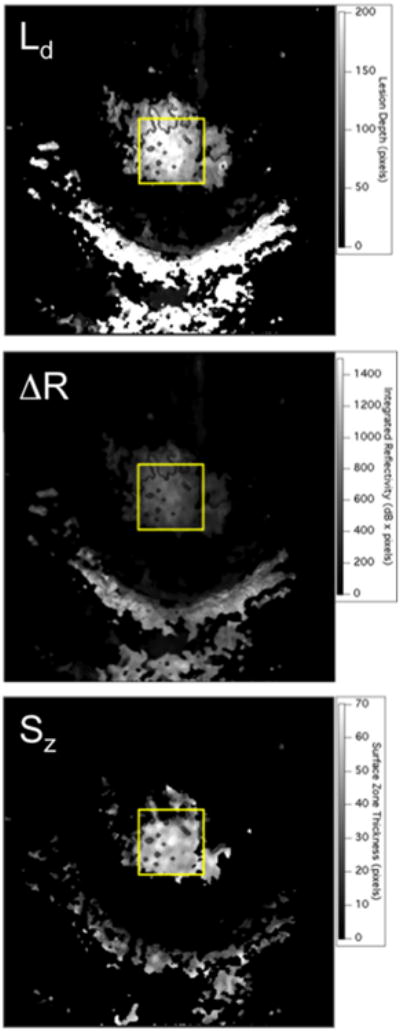
Two dimensional projection images of ΔR, Ld, and Sz, calculated for one of the lesions at a single time point. The lesion is located in the area of the yellow rectangular box. The half moon shaped region of high reflectivity below the yellow box is the gingiva.
The steps involved in converting the 3D CP-OCT images into the mean values of the lesion depth (Ld) and integrated reflectivity over the lesion depth (ΔR) in the ROI are described in reference [25] and shown graphically in the flowchart of that paper. For speckle noise reduction, signals not exceeding four standard deviations from the mean background noise floor were reduced to the mean background value and a Gaussian blur smoothing algorithm was applied using a 5 × 5 pixel convolution kernel [26–28]. Finally, a modified rotating kernel transformation (RKT) emphasizing more on horizontal edges than on vertical edges was applied to each 2D b-scan image to further increase signal-to-noise ratio thereby increasing the optical penetration [26,27]. In the edge-detection approach, the enamel edge, and the lower lesion boundary were determined by applying an edge locator [26–28]. The program first locates the maximum of each a-scan, and differentiates the a-scan maximum as either demineralized or sound using the signal-to-noise ratio as a threshold. The depth of the lesion (Ld) was calculated by locating the upper and lower lesion boundaries, by identifying the first pixels that fall under the threshold for the full width half maximum (FWHM) value in each a-scan. The distance per pixel conversion factor was obtained experimentally by system calibration. Each a-scan of the CP-OCT images was reduced to single values representing ΔR in units of (dB × μm) by integrating over Ld. Ld represents the number of pixels above the intensity threshold for “sound” enamel and it is used principally to determine how deep to integrate to calculate ΔR [26–28]. Even though the intensity of the specular reflection from the surface is reduced by 32 dB (extinction ratio) in the cross polarization image, it is not completely eliminated.
An algorithm that calculated the zero-crossing points after taking the first-order derivative was used to identify the top and bottom edges of the surface zone. The modified RKT used for speckle reduction further enhanced the contrast of the edges of the surface zone. The algorithm also verified that the reflectivity was minimal within the surface zone using an empirically derived intensity threshold (8 dB). The distance between the two edges yielded the surface zone thickness, Sz.
Two dimensional projections of Ld, ΔR, and Sz are well suited for visualization of the large volume of OCT data in volumetric OCT scans [28]. An example of the three projection images for one lesion are shown in Figure 3. Ld, ΔR, and Sz were calculated in the ROI for each patient at every available time point.
Repeated measures analysis of variance (ANOVA) with Tukey's multiple comparison test was used to determine differences in lesion depth (Ld), integrated reflectivity with lesion depth (ΔR), and the thickness of the lesion surface zone (Sz) with Prism software (GraphPad, San Diego, CA) for the 17 test subjects that completed all five imaging sessions. P < 0.05 was considered significant.
In order to assess changes in the three lesion parameters: Ld, ΔR, Sz for each individual lesion; each parameter was plotted versus time, that is, as shown in Figure 7. Linear regression was used to determine the increase or decrease in magnitude of each parameter (slope) with time and determine if the slope was significantly different from zero (P < 0.05).
Fig. 7.
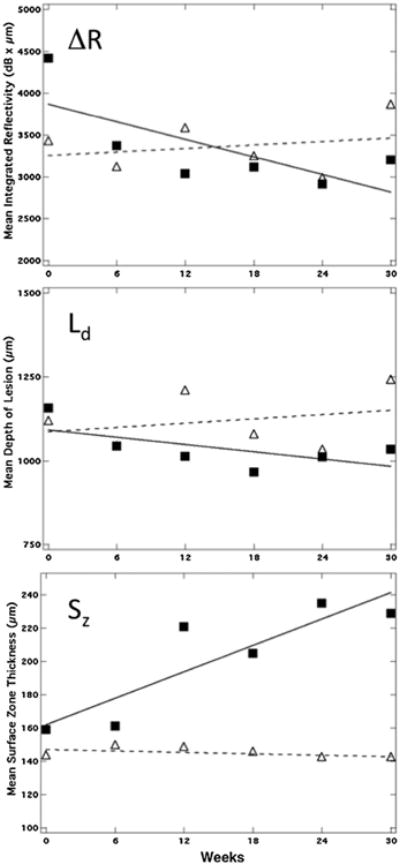
Plots of Sz, Ld, and ΔR for one of the five lesions for which the surface zone thickness manifested a significant (P < 0.05) increase over time (solid square) along with a lesion that manifested no significant increase (P < 0.05) (open triangles). There was no significant change in Ld and ΔR over time for either lesion.
Results
Enamel lesions on facial surfaces were imaged using CP-OCT before intervention with topical fluoride varnish and at 6-week intervals over a period of 30 weeks.
A transparent surface zone was detected in all but one lesion (62/63) in the initial CP-OCT images before the application of fluoride varnish. The presence of a previously existing surface zone suggests that the lesion may have been already arrested. CP-OCT images from one test subject are shown in Figure 4 before and after the completion of the study. A distinct surface zone approximately 150 μm thick is clearly visible at week 0. After 30 weeks the lesion structure, depth, and severity (integrated reflectivity) remained the same, suggesting that this lesion was already arrested. The great majority of the lesions manifested no significant changes in Sz over the 30 week period, 56/63. For one lesion we observed the formation of an additional transparent layer on top of the existing surface zone, that is, multiple transparent zones (see Fig. 5). The overall lesion depth increased indicating a new layer was formed over the existing lesion, most likely an oriented (epitaxial) layer of mineral since the layer appears transparent.
Fig. 4.
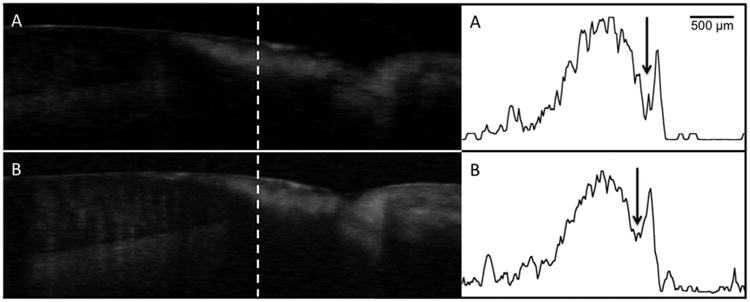
Processed CP-OCT b-scans of a cervical enamel lesion taken at week 0 (A) and again at week 30 (B). The lesion is clearly visible and it has a well-defined surface zone (Sz) that is visible. The dentinal enamel junction (DEJ) and the gingival (G) are visible in the image and the position of the scans are indicated on the photograph of the tooth. A-scans extracted at the position of the dashed line from each image are shown on the right with the tooth surface oriented on the right. The weakly scattering surface zone is located at the position of the arrow. The sharp spike to the right of the arrow is reflection from the tooth surface and the lesion body is the large broad peak to the left of the arrow. There was little change in the lesion structure after 30-weeks.
Fig. 5.
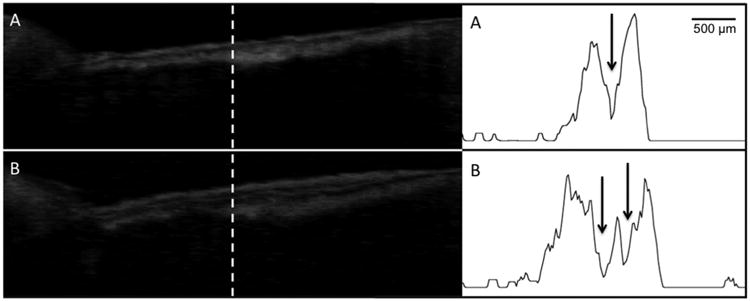
Processed CP-OCT b-scans of a cervical enamel lesion taken at week 0 and again after 30 weeks. A-scans extracted at the position of the dashed line from each image are also shown. The lesion (L) is clearly visible and it has a well defined surface zone that is visible. After 30 weeks a double layer is visible in the lesion at the positions of the two arrows.
The mean values of the lesions parameters: Ld, ΔR, and Sz are tabulated in Table 1 for each of the 6 week time periods. There was no significant change (P > 0.05) in the mean lesion depth, Ld, ΔR, or the surface zone thickness (Sz) after 30 weeks for the 63 enamel lesions monitored. All 63 lesions were present after 30 weeks and no changes were apparent upon clinical examination (photographs). Linear regression was used to determine if there was a significant increase in Sz with time for each individual lesion (positive slope significantly different from zero, P < 0.05) and only a small fraction of the lesions manifested a significant increase in Sz, 5 out of 63. Two of those lesions were on the same test subject, and all four of the lesions on that test subject manifested relatively large increases in surface zone thickness with time (fit had large positive slope), although for only 2/4 lesions was the slope significantly different from zero. Figure 6 shows one of the five lesions where the surface zone thickness increased significantly with time. The sharp spike by the asterisk in the lower a-scan shows the tooth surface. In Figure 7, we show the values for Ld, ΔR, and Sz for two of the lesions, one lesion that showed a significant increase in the surface zone thickness over 30 weeks and another lesion that manifested no significant change.
Table 1. Mean±S.D. of Integrated Reflectivity (ΔR), Lesion Depth (Ld), and Surface Zone Thickness (Sz) for all lesions (n = 63).
| ΔR (dB × μm) | Lesion depth (μm) | Surface zone thickness (μm) | |
|---|---|---|---|
| Week 0 | 2,730 ± 1,099 | 846 ± 270 | 179 ± 50 |
| Week 6 | 2,551 ± 955 | 830 ± 270 | 172 ± 57 |
| Week 12 | 2,629 ± 1,075 | 832 ± 269 | 179 ± 60 |
| Week 18 | 2,507 ± 1,075 | 816 ± 249 | 178 ± 60 |
| Week 24 | 2,536 ± 870 | 826 ± 280 | 184 ± 56 |
| Week 30 | 2,535 ± 955 | 831 ± 263 | 184 ± 60 |
Fig. 6.
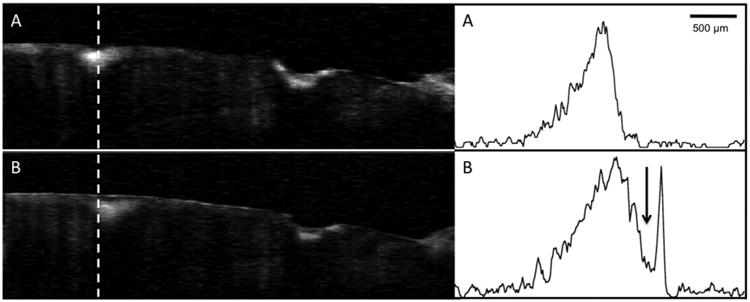
Processed CP-OCT b-scans of a tooth with two lesions acquired at week 0 and week 30. A-scans extracted at the position of the dashed line from each image are also shown. The surface zone thickness increased by 30% after 30-weeks. Note a well defined surface zone is also present on the cavitated lesion on the right as well as after 30-weeks.
Five of the lesions showed a significant decrease in ΔR and two of those lesions also showed a significant decrease in Ld. Two of the lesions were on the same test subject. Overall ten of the lesions manifested significant changes in values for Ld, ΔR, and Sz indicating that the severity of the lesion had decreased during the study.
Five of the lesions had values for Ld, ΔR, and Sz indicating that the lesion became more severe over the period of the study. Two of the lesions manifested a significant decrease in Sz and three of the lesions showed a significant increase in the integrated reflectivity. Two of those lesions also had a matching significant increase in lesion depth and two of the lesions were on the same test subject.
Discussion
The aim of this study was to test the hypothesis that cross-polarization optical coherence tomography (CP-OCT) can be used to longitudinally monitor changes in the structure of active lesions after intervention with fluoride in vivo. CP-OCT could clearly resolve the depth and severity of all the cervical lesions and measure the thickness of the transparent surface zone of higher mineral content. CP-OCT detected highly mineralized surface zones on all but one of the 63 lesions in CP-OCT images. CP-OCT could also resolve significant changes in the lesion parameters over the period of intervention for individual lesions.
During the remineralization of lesions, mineral is deposited at the lesion surface increasing the thickness of the surface zone (Sz), therefore, we anticipated an increase in the surface zone thickness and a decrease in the overall integrated reflectivity from the lesion (ΔR) without a change in the lesion depth (Ld). The greatest change should occur in the thickness of the lesion surface zone. The minimal changes in the lesion parameters suggests that the majority of the lesions were arrested and did not respond to 30-weeks of fluoride application. The presence of a well defined surface zone is a key indicator of an arrested lesion [21,29,30] and it is likely that most of these lesions, even though they were diagnosed clinically as active based on conventional diagnosis, were arrested. In addition, out of 17 test subjects that completed the study 15 were identified as high risk for caries. That diagnosis is based on various factors but it is principally based on the number of lesions identified in the mouth and the number of lesions that needed surgical intervention.
Our results suggest that conventional visual-tactile methods for the diagnosis of lesion activity are unreliable and that most of the lesions identified on tooth facial surfaces from the adult population in this study are likely arrested and do not require further intervention. Our results further demonstrate the need for new methods for assessing lesion activity. CP-OCT is very promising since it is capable of resolving the microstructural changes that take place due to remineralization. Other methods that monitor the diffusion of water from the lesion are also promising for assessing lesion activity, since the formation of the highly mineralized surface zone on the lesion upon remineralization reduces the permeability of the lesion and reduces the rate of water loss [7,31–34]. Ultimately, if the thickness of the transparent surface zone can be directly correlated with lesion activity, as suggested by the study by Kidd [21] and lesion dehydration studies [7,31–34], and the thickness of that transparent surface can be monitored with CP-OCT as demonstrated in this study, then CP-OCT should be able to determine the activity of lesions in a single non-destructive measurement.
This system was easy to use clinically and we feel that with only a few modifications it is a viable clinical system. An air nozzle needs to be integrated into the handpiece to prevent condensation on the imaging window, an assistant had to do this manually during the study. In addition, methods for infection control are needed that do not involve use of a sleeve covering the imaging window since that degrades image quality. An integrated camera would also be helpful for more accurate positioning along with methods for image registration for longitudinal monitoring.
These studies demonstrate that changes in the internal microstructure of carious lesions can be monitored overtime during preventative intervention. This ability offers many intriguing possibilities for caries research. Although it is very promising to be able to resolve the transparent surface zone and identify changes in the lesion severity, it was disappointing that such a small fraction of the lesions actually manifested changes in 30-weeks.In the future, we plan to monitor the effectiveness of preventative intervention on a pediatric population of high caries risk likely to have active lesions on the virgin surfaces of primary teeth that will likely be more sensitive to intervention with fluoride varnish.
Acknowledgments
This work was supported by NIH/NIDCR Grant R01-DE17869.
Contract grant sponsor: NIH/NIDCR; Contract grant number: R01-DE17869.
Footnotes
Conflict of Interest Disclosures: All authors have completed and submitted the ICMJE Form for Disclosure of Potential Conflicts of Interest and none were reported.
References
- 1.Darling CL, Huynh GD, Fried D. Light scattering properties of natural and artificially demineralized dental enamel at 1310-nm. J Biomed Optics. 2006;11(3):034023 034021–034023 034011. doi: 10.1117/1.2204603. [DOI] [PubMed] [Google Scholar]
- 2.Fejerskov O, Kidd E. Dental caries: The disease and its clinical management. Oxford: Blackwell; 2003. [Google Scholar]
- 3.Nyvad B, Machiulskiene V, Baelum V. Reliability of a new caries diagnostic system differentiating between active and inactive caries lesions. Caries Res. 1999;33(4):252–260. doi: 10.1159/000016526. [DOI] [PubMed] [Google Scholar]
- 4.Ismail A, Banting D, Eggertsson H, Ekstrand K, Ferreira-Zandona A, Longbottom C, Pitts N, Reich E, Ricketts D, Selwitz R, Sohn W, Topping G, Zero D. Rationale and evidence for the International Caries Detection and Assessment System (ICDAS II) proceedings of the 7th Indiana conference. 2005:161–221. [Google Scholar]
- 5.Ekstrand KR, Ricketts DN, Longbottom C, Pitts NB. Visual and tactile assessment of arrested initial enamel carious lesions: An in vivo pilot study. Caries Res. 2005;39(3):173–177. doi: 10.1159/000084794. [DOI] [PubMed] [Google Scholar]
- 6.Thylstrup A, Bruun C, Holmen L. In vivo caries models-mechanisms for caries initiation and arrestment. Adv Dent Res. 1994;8(2):144–157. doi: 10.1177/08959374940080020401. [DOI] [PubMed] [Google Scholar]
- 7.Ando M, Stookey GK, Zero DT. Ability of quantitative light-induced fluorescence (QLF) to assess the activity of white spot lesions during dehydration. Am J Dent. 2006;19(1):15–18. [PubMed] [Google Scholar]
- 8.Ferreira Zandona A, Santiago E, Eckert G, Fontana M, Ando M, Zero DT. Use of ICDAS combined with quantitative light-induced fluorescence as a caries detection method. Caries Res. 2010;44(3):317–322. doi: 10.1159/000317294. [DOI] [PMC free article] [PubMed] [Google Scholar]
- 9.Baumgartner A, Dicht S, Hitzenberger CK, Sattmann H, Robi B, Moritz A, Sperr W, Fercher AF. Polarization-sensitive optical optical coherence tomography of dental structures. Caries Res. 2000;34:59–69. doi: 10.1159/000016571. [DOI] [PubMed] [Google Scholar]
- 10.Wang XJ, Milner TE, de Boer JF, Zhang Y, Pashley DH, Nelson JS. Characterization of dentin and enamel by use of optical coherence tomography. Applied Optics. 1999;38(10):2092–2096. doi: 10.1364/ao.38.002092. [DOI] [PubMed] [Google Scholar]
- 11.Everett MJ, Colston BW, Sathyam US, Silva LBD, Fried D, Featherstone JDB. Non-invasive diagnosis of early caries with polarization sensitive optical coherence tomography (PS-OCT) Lasers in Dentistry V; 1999 Proc SPIE. 1999;3593:177–183. [Google Scholar]
- 12.Feldchtein FI, Gelikonov GV, Gelikonov VM, Iksanov RR, Kuranov RV, Sergeev AM, Gladkova ND, Ourutina MN, Warren JA, Reitze DH. In vivo OCT imaging of hard and soft tissue of the oral cavity. Optics Express. 1998;3(3):239–251. doi: 10.1364/oe.3.000239. [DOI] [PubMed] [Google Scholar]
- 13.Fried D, Xie J, Shafi S, Featherstone JDB, Breunig T, Lee CQ. Early detection of dental caries and lesion progression with polarization sensitive optical coherence tomography. J Biomed Optics. 2002;7(4):618–627. doi: 10.1117/1.1509752. [DOI] [PubMed] [Google Scholar]
- 14.Jones RS, Fried D. Remineralization of enamel caries can decrease optical reflectivity. J Dent Res. 2006;85(9):804–808. doi: 10.1177/154405910608500905. [DOI] [PMC free article] [PubMed] [Google Scholar]
- 15.Jones RS, Darling CL, Featherstone JDB, Fried D. Remineralization of in vitro dental caries assessed with polarization sensitive optical coherence tomography. J Biomed Optics. 2006;11(1):014016. doi: 10.1117/1.2161192. [DOI] [PubMed] [Google Scholar]
- 16.Lee C, Darling C, Fried D. Polarization sensitive optical coherence tomographic imaging of artificial demineralization on exposed surfaces of tooth roots. Dent Mat. 2009;25(6):721–728. doi: 10.1016/j.dental.2008.11.014. [DOI] [PMC free article] [PubMed] [Google Scholar]
- 17.Manesh SK, Darling CL, Fried D. Polarization-sensitive optical coherence tomography for the nondestructive assessment of the remineralization of dentin. J Biomed Optics. 2009;14(4):044002. doi: 10.1117/1.3158995. [DOI] [PubMed] [Google Scholar]
- 18.Louie T, Lee C, Hsu D, Hirasuna K, Manesh S, Staninec M, Darling CL, Fried D. Clinical assessment of early tooth demineralization using polarization sensitive optical coherence tomography. Lasers Surg Med. 2010;42:738–745. doi: 10.1002/lsm.21013. [DOI] [PMC free article] [PubMed] [Google Scholar]
- 19.Staninec M, Douglas SM, Darling CL, Chan K, Kang H, Lee RC, Fried D. Nondestructive clinical assessment of occlusal caries lesions using near-IR imaging methods. Lasers Surg Med. 2011;43(10):951–959. doi: 10.1002/lsm.21139. [DOI] [PMC free article] [PubMed] [Google Scholar]
- 20.Kang H, Jiao JJ, Chulsung L, Le MH Darling CL, Fried DL. Nondestructive assessment of early tooth demineralization using cross-polarization optical coherence tomography. IEEE J Sel Top Quantum Electron. 2015;16(4):870–876. doi: 10.1109/JSTQE.2009.2033610. [DOI] [PMC free article] [PubMed] [Google Scholar]
- 21.Kidd EA. The histopathology of enamel caries in young and old permanent teeth. British Dent J. 1983;155(6):196–198. doi: 10.1038/sj.bdj.4805177. [DOI] [PubMed] [Google Scholar]
- 22.Amaechi BT, Podoleanu A, Higham SM, Jackson DA. Correlation of quantitative light-induced fluorescence and optical coherence tomography applied for detection and quantification of early dental caries. J Biomed Optics. 2003;8(4):642–647. doi: 10.1117/1.1606685. [DOI] [PubMed] [Google Scholar]
- 23.Mandurah MM, Sadr A, Shimada Y, Kitasako Y, Nakashima S, Bakhsh TA, Tagami J, Sumi Y. Monitoring remineralization of enamel subsurface lesions by optical coherence tomography. J Biomed Optics. 2013;18(4):046006. doi: 10.1117/1.JBO.18.4.046006. [DOI] [PubMed] [Google Scholar]
- 24.Le MH, Darling CL, Fried D. Automated analysis of lesion depth and integrated reflectivity in PS-OCT scans of tooth demineralization. Lasers Surg Med. 2010;42(1):62–68. doi: 10.1002/lsm.20862. [DOI] [PMC free article] [PubMed] [Google Scholar]
- 25.Nee A, Chan K, Kang H, Staninec M, Darling CL, Fried D. Longitudinal monitoring of demineralization peripheral to orthodontic brackets using cross polarization optical coherence tomography. J Dent. 2014;42(5):547–555. doi: 10.1016/j.jdent.2014.02.011. [DOI] [PMC free article] [PubMed] [Google Scholar]
- 26.Brezinski M. Optical coherence tomography: Principles and applications. London: Elsevier; 2006. [Google Scholar]
- 27.Kang H, Darling CL, Tom H, Fried D. Enhanced detection of dentinal lesions in OCT images using the RKT transformation. Lasers in Dentistry XXI, 2015 Proc SPIE. 2015;9306:P1–P5. doi: 10.1117/12.2083654. [DOI] [PMC free article] [PubMed] [Google Scholar]
- 28.Chan KH, Chan AC, Fried WA, Simon JC, Darling CL, Fried D. Use of 2D images of depth and integrated reflectivity to represent the severity of demineralization in cross-polarization optical coherence tomography. J Biophotonics. 2015:36–45. doi: 10.1002/jbio.201300137. [DOI] [PMC free article] [PubMed] [Google Scholar]
- 29.Ismail AI. Visual and visuo-tactile detection of dental caries. J Dent Res. 2004;83(Spec Iss C):C56–C66. doi: 10.1177/154405910408301s12. [DOI] [PubMed] [Google Scholar]
- 30.ten Cate JM, Arends J. Remineralization of artificial enamel lesions in vitro. Caries Res. 1977;11(5):277–286. doi: 10.1159/000260279. [DOI] [PubMed] [Google Scholar]
- 31.Kaneko K, Matsuyama K, Nakashima S. Proceedings of the 4th Annual Indiana Conference. Indiana University; Indianapolis, IN: 1999. Quantification of early carious enamel lesions by using an infrared camera Early detection of dental caries II; pp. 83–99. [Google Scholar]
- 32.Zakian CM, Taylor AM, Ellwood RP, Pretty IA. Occlusal caries detection by using thermal imaging. J Dent. 2010;38(10):788–795. doi: 10.1016/j.jdent.2010.06.010. [DOI] [PubMed] [Google Scholar]
- 33.Usenik P, Bürmen M, Fidler A, Pernuš F, Likar B. Near-infrared hyperspectral imaging of water evaporation dynamics for early detection of incipient caries. J Dent. 2014;42(10):1242–1247. doi: 10.1016/j.jdent.2014.08.007. [DOI] [PubMed] [Google Scholar]
- 34.Lee RC, Darling CL, Fried D. Assessment of remineralization via measurement of dehydration rates with thermal and near-IR reflectance imaging. J Dent. 2015;43:36–45. doi: 10.1016/j.jdent.2015.03.005. [DOI] [PMC free article] [PubMed] [Google Scholar]


