

Abstract
Enzyme-linked immunosorbent assays (ELISAs) have traditionally been used to detect alloantibodies in patient plasma samples post hematopoietic cell transplantation (HCT); however, protein microarrays have the potential to be multiplexed, more sensitive, and higher throughput than ELISAs. Here, we describe the development of a novel and sensitive microarray method for detection of allogeneic antibodies against minor histocompatibility antigens encoded on the Y chromosome, called HY antigens. Six microarray surfaces were tested for their ability to bind recombinant protein and peptide HY antigens. Significant allogeneic immune responses were determined in male patients with female donors by considering normal male donor responses as baseline. HY microarray results were also compared with our previous ELISA results. Our overall goal was to maximize antibody detection for both recombinant protein and peptide epitopes. For detection of HY antigens, the Epoxy (Schott) protein microarray surface was both most sensitive and reliable and has become the standard surface in our microarray platform.
Keywords: Protein microarray, HY antigen, Hematopoietic cell transplantation, Chronic graft versus host disease, Alloantibody
1. Introduction
Following HLA matched hematopoietic cell transplantation (HCT), minor histocompatibility antigen (mHA) presentation to both B and T lymphocytes is critical in both the graft versus leukemia as well as graft versus host responses (Miklos et al., 2005). These mHAs distinguish self from non-self cells and elicit allogeneic B and T cell immune responses. While T cell recognition of mHAs is HLA restricted, the B-lymphocytes express massively diverse B cell receptors, facilitating adaptive immunity to a nearly unlimited number of possible antigens. We have previously demonstrated that allogeneic antibodies develop from donor B cells 3 months post allogeneic HCT in association with chronic graft versus host disease (cGVHD) (Miklos et al., 2004; Miklos et al., 2005; Nakasone et al., 2015b).
cGVHD is a particularly severe problem in male recipients with female donors in which the gender disparity causes a targeted attack on the Y chromosome encoded proteins (Loren et al., 2006; Randolph et al., 2004). As a result, the risk for cGVHD for male patients with a female donor (F➔M) is significantly increased compared to any other gender combination in a conditioning-dependent manner. (Nakasone et al., 2015a). F➔M patients thus provide an excellent model for studying HY alloimmunity.
In our model for detection of allogeneic antibodies in F➔M HCT patients, the male graft recipients develop antibodies against Y-chromosome encoded antigens (HY antigens) that have up to 99% identity with their X-chromosome homologues. These HY antigens, which are ubiquitously expressed in all tissues, include DBY, EIF1AY, RPS4Y, UTY, and ZFY (Popli et al., 2014).
Traditionally, enzyme linked immunosorbent assays (ELISAs) have been used to provide quantitative antibody measurements and were first employed for HY antibody detection as well (Miklos et al., 2004). However, ELISA is only capable of testing a single antigen at a time and requires large amounts of both recombinant antigen and patient plasma samples (Wadia et al., 2011). Moreover, ELISAs are inefficient for studying peptides and specific epitopes, as one protein can be split into hundreds of smaller segments, each requiring its own well. Protein microarrays are a new technology that have promise to overcome these drawbacks.
Protein microarray technology allows for the analysis of ten or more patient samples against many spatially isolated antigens on a single glass slide with higher sensitivity than a conventional ELISA (Robinson et al., 2002; Wilson and Nock, 2003). While protein microarrays have been used for antibody detection in the past, there is disagreement regarding which slide surface chemistry is optimal, and results tend to be antigen-specific (Stoevesandt et al., 2009; Balboni et al., 2008; Guilleaume et al., 2005). We have developed a protein microarray system with high throughput and sensitivity to multiplex the identification of patients with reactivity to HY proteins and their composite epitopes, mimicked by overlapping peptides. To optimize HY protein microarrays, we here compare six commercially available surfaces using both protein and peptide antigens. Each surface was tested for its HY protein and peptide binding, IgG detection signal-to-noise ratio, and reproducibility. We then compared microarray quantifications of anti-HY antibodies to those previously measured by ELISA and their clinical utility. These efforts have maximized HY antibody detection in a high throughput manner, providing proven utility in examining clinical outcomes such as chronic GVHD prediction following allogeneic HCT.
2. Methods
2.1. Patient characteristics and plasma samples
Plasma samples were collected from 32 male patients who had undergone allogeneic HCT with either a related or unrelated HLA matched female donor. In order to test plasma most likely to have allogeneic antibodies against one or more of the HY antigens, we chose patients who had subsequently developed moderate to severe cGVHD. A non-complimentary set of 32 male donor plasma samples was also collected, as healthy males are not expected to have “self” HY antibodies. Patient plasma samples were collected 1 year post transplant and stored at −20 °C until use. HCT patient and donor characteristics are reported in Table 1. Approval for this study was obtained from the Stanford University Institutional Review Board and individual informed consent was obtained from all patients and donors.
Table 1.
Patient Characteristics.
| Patient characteristics | n = 32 |
|---|---|
| Median patient age, year (range) | 49 (18–64) |
| Median time since transplant, d (range) | 864 (32–3493) |
| Median donor age, year (range) | 46 (12–69) |
| Primary disease | |
| Acute lymphoblastic leukemia | 5 (16%) |
| Acute myelogenous leukemia | 6 (19%) |
| Hodgkin disease | 1 (3%) |
| Myelodysplastic syndrome | 3 (9%) |
| Myelofibrosis | 3 (9%) |
| Multiple myeloma | 8 (25%) |
| Non-Hodgkin lymphoma | 6 (19%) |
| Conditioning | |
| Myeloablative | 13 (41%) |
| Non-myeloablative | 19 (59%) |
| Donor | |
| Related | 26 (81%) |
| Unrelated | 6 (19%) |
| Graft | |
| Bone marrow | 2 (6%) |
| Peripheral blood stem cell | 30 (94%) |
| Normal male characteristics | n = 32 |
|
| |
| Median age, year (range) | 50 (12–71) |
2.2. Protein preparation
Five HY antigens and their X homologues were created using cDNA isolated from male peripheral blood mononuclear cells and amplified using polymerase chain reaction as previously reported by Miklos et al. (2005). Each gene was cloned into Escherichia coli (pET-Dest42 and pcDNA-Dest40), adding the V5 C-terminus epitope. Inclusion bodies were synthesized in E. coli and solubilized in 6 M guanidine. Purification occurred with nickel affinity chromatography in 6 M urea, which was removed over a 12-hour gradient. V5 tagged proteins were eluded using 250 mM imidazole with 20% glycerol for protein stability. Because the recombinant HY protein UTY is prohibitively large, it was divided into three overlapping fragments, UTY1, UTY2, and UTY3. As UTY2 is the most immunogenic of the three (Nakasone et al., 2015a, 2015b), we focused our UTY analysis on this fragment. Five peptides of the DBY protein, including the most immunogenic peptide, DBY2 (Sahaf et al., 2013), were synthesized by New England Peptide Inc. and used to test the platform’s peptide detection capabilities.
Two concentrations of IgG, 0.025 and 0.0125, served as positive control antigens with concentrations within the expected range of alloantibodies. As additional positive controls, we printed several infectious antigen products including cytomegalovirus antigen, herpes simplex virus 1, tetanus toxoid, pneumococcus, influenza, Epstein Barr virus nuclear antigen 1 (EBNA1-V5; R&D, Minneapolis, MN), and varicella zoster virus cell extract. We printed 1× PBS and the HIV antigen p24, which was cloned using a C-terminus V5 expression vector and purified in E. coli along with the HY antigens, as our negative controls (Wadia et al., 2010). Accordingly, all patient and control sera that were chosen were determined to be HIV negative.
2.3. ELISA analysis of the HY antigens
The 64 serum samples were analyzed using ELISA for their particular reactivity to the five HY antigens. Each protein was coated to a row of a 96 well NUNC plate with 50 μl/well at 1.0 μg/ml, as previously described by Miklos et al. (2004). The plates were washed using 1× Tris-buffered saline with 0.1% Tween-20 (TBST). Following this wash, the wells were blocked using 2% nonfat milk for one hour and incubated with the patient sera (1:50) at 4 °C overnight. The samples were developed using anti-human IgG conjugated to alkaline phosphatase. The absorbance was measured at 450–550 nm in order to measure the broadest area.
2.4. Microarray printing and slide surfaces
Each protein was printed in quadruplicate at 100 μm using four quill-tip pins on 16 identical subarrays (Fig. 1). The quill-tip pins enabled antigen to be printed on up to 5 slides, providing 100 applications, before requiring reloading. As seen in Fig. 1, each pin printed an entire subarray, decreasing pin-dependent variability within individual subarrays. Before printing a new antigen, the pins were extensively sonicated and washed. This study used a GeneMachines OmniGrid Accent protein microarray printer. After printing, all slides were left to dry in a desiccated environment for two weeks before plasma incubation.
Fig. 1.

Microarray printing and antibody detection. A) Recombinant HY proteins, peptides, and controls are loaded into quill-tipped pins from a 384 well plate and printed in a 16 subarray configuration on a glass slide. Subarrays of the same color are printed by the same pin. The sixteenth subarray of each well is reserved for control serum. B) Each subarray of a printed slide is incubated in a different patient serum sample before incubation with anti-V5 and antihuman IgG fluorescent secondary antibodies. Slides are then scanned at two different wavelengths for antibody detection.
Prior to printing, we stored and prepared each glass slide surface to its manufacturer’s specifications. The six slide surfaces were chosen based upon the currently available array of various chemistries. The surfaces consist of two epoxide-based surfaces, Epoxy 2 (ArrayIt Corp., Sunnyvale, CA) and Epoxy (Schott, Tempe, AZ), two nitrocellulose-based surfaces, Gentel Path Plus and Gentel Clear (Grace Bio-Labs, Bend, Oregon), one NHS-ester-based surface (ArrayIt Corp.), and one hydrogel surface (Schott). As all surfaces make use of different methods of binding antigen, examining epitope availability on each surface was especially important, which was accomplished through V5 and IgG antibody detection.
2.5. Slide processing and antibody detection
Before processing, each slide was pre-washed and blocked using 2% casein (EMD) and 0.08% Triton X-100 in PBS for 1 h at 4 °C. Following blocking, we placed each slide in a pre-blocked rubber gasket with 16 wells (ArrayIt Corp., Sunnyvale, CA). We incubated each subarray with patient plasma diluted at 1:50, determined to be the optimal dilution in prior ELISA experiments through a dilution series (Miklos et al., 2005), for 1 h at 4 °C in wash buffer composed of 0.1% Tween-20 and 1% casein (Sigma) in 1× PBS. The subarrays were aspirated and washed ten times with 100 μl of wash buffer per gasket to remove excess plasma. In our analysis, all donor and patient sera were incubated with a two color secondary antibody cocktail to co-detect both the amount of protein on the slide as well as the amount of human IgG binding each protein. Each gasket was filled with 80 μl of polyclonal goat anti human IgG Cy3 (Sigma C2571, St. Louis, MO)/anti-V5 Alexa 647 (Thermo Fisher 451,098, Grand Island, NY) diluted to 1:100 and 1:200 respectively at 4 °C for 90 min while rotating at 50 rpm. The slides were washed in wash buffer ten more times as described previously. Each was dipped into MilliQ® water 3 times and centrifuged at 1800 rpm for 15 min at 4 °C to dry. The slides were stored in a dark environment before scanning using a GenePix 4000B scanner at a fixed photomultiplier (PMT) setting of 600. As a positive control, the sixteenth subarray of each slide was incubated with a positive control serum, known to be seropositive for both DBY and UTY2.
2.6. Data acquisition and analysis
IgG specifically binding each antigen was quantified as the median fluorescence intensity (MFI) of four 70 μm replicate spots. Though the printed spots measured 100 μm in diameter, the use of 70 μm spots for detection allowed for a more accurate capture of the median. To account for sporadic misprints, experimental results were calculated as the mean of the two medians of the four spots. As no patients were HIV positive, each patient’s MFI values for the recombinant proteins were normalized according to his or her p24 signal. Thus, for each recombinant HY protein, the reported MFI is the patient’s p24 MFI subtracted from the antigen’s MFI, and all antigens with a negative MFI after normalization are recorded as 0 intensity. For peptides and other third-party antigens, we subtracted the MFI for 1× PBS, the relevant negative control. Thresholds for positivity were calculated for each antigen as the third quartile plus two times the interquartile range (Q3 + 2[IQR]) of the IgG Cy3 signal for normal male donors. Since HY proteins are considered “self” antigens for any male, we determined the threshold for seropositivity as the upper bound of the Q3 + 2[IQR] range. Since the data is bound at 0, the antibody levels are skewed in a non-normal manner; thus, this non-parametric statistical approach was applied (Nakasone et al., 2015b).
3. Results and discussion
3.1. Protein array binding using shared V5 epitope recognition
In order to determine the amount of antigen printed in each spot, we measured anti-V5 secondary antibody signals. As seen in Fig. 2, both the NHS and hydrogel based surfaces showed negligible V5 signal for every protein, suggesting no protein was bound. There are multiple explanations for this occurrence. The two most likely conclusions are either that the surfaces were not binding any of the recombinant proteins or that the V5 recognition epitopes were not available for antibody binding, either due to their orientation on the slide surface or matrix interference. Nevertheless, because of the inability of protein to be properly detected on the slide, these two surfaces were excluded from further analysis.
Fig. 2.
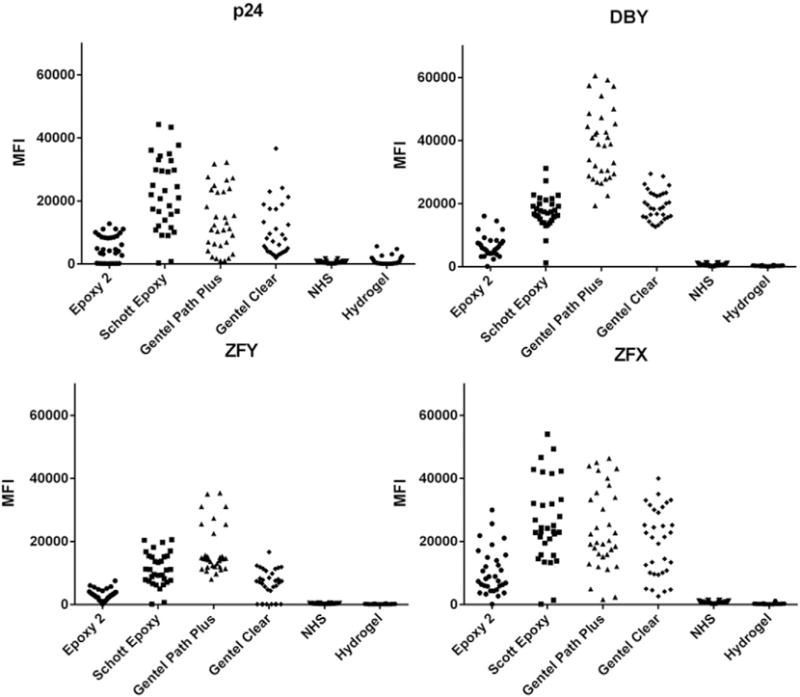
Anti-V5 antibody detection. Comparison of anti-V5 signal across the six slide surfaces and four recombinant proteins to determine the amount of antigen printed on each surface. Each symbol represents the MFI for a given antigen in a single subarray that had been incubated with a F➔M serum sample.
The remaining four surfaces included two commercially available products that used either epoxy or nitrocellulose chemistry. In general, binding varied by protein. For example, Epoxy (Schott) had the highest average MFI for both p24 (22,298) and ZFX (23,209), while Gentel Path Plus bound DBY, our most frequently targeted antigen, with the highest average signal (38,961). This effect could be due to multiple factors, including V5 epitope availability as well as surface binding efficiency. No surface bound every protein in a perfectly uniform fashion; however, the epoxide surfaces, especially Epoxy (Schott), tended to have more consistent printing with fewer outlying values, with a standard deviation of 5260 for DBY compared to the 11,300 DBY standard deviation of Gentel Path Plus. Across the four antigens examined, the Epoxy (Schott) surface consistently had one of the smallest coefficients of variation, pointing to the chemistry’s high reproducibility. For a full description of the anti-V5 detection distributions, see Supplemental Table 1.
Overall, Gentel Path Plus and Epoxy (Schott) appear to have the highest binding and least variation across the four proteins tested. However, we recognize the difficulty in expanding this conclusion to every antigen on the HY panel. Moreover, it is important to recognize that the use of anti-V5 detection is one tool for examining if a single epitope is uniformly presented. Antigen could be bound to the slide surface in a heterogeneous manner, either due to random orientation or perhaps polypeptide specific slide binding, affecting epitope availability. Thus, V5-epitope monoclonal antibody detection may not perfectly reflect the variation of polyclonal signal detection, as we have previously shown that the DBY protein has at least 10 immune dominant, frequently recognized epitopes (Miklos et al., 2004). Therefore, we also chose to examine anti-IgG detection as a secondary means of determining if sufficient protein bound to the surface.
3.2. Antibody detection
To quantitatively measure the levels of antibodies against HY antigens in patient plasma, we also detected the fluorescence of Cy3-conjugated anti-human IgG goat antibodies. As Fig. 3 shows, anti-IgG detection varied across the surfaces.
Fig. 3.

Anti-IgG antibody detection. Patient antibody responses against HY antigens and peptides. Measurements are shown for the negative control, p24, protein fragments UTY2 and its X homologue, UTX2, DBY, and a peptide of DBY, DBY2. Each dot represents a F➔M patient’s relative amount of antibodies against a given antigen. The gray boxes represent the threshold established by healthy male donors, with any sample above the box considered seropositive.
Based on the thresholds determined by measuring healthy male donors, Epoxy 2 showed the highest seropositivity cutoff across the different antigens, which lowered the surface’s sensitivity to detecting seropositivity in F➔M samples. Epoxy (Schott) and Gentel Path Plus, on the other hand, generally showed the most sensitivity, with low cutoffs and high MFI values for F➔M samples. For a detailed summary of seropositivity cutoffs and normal male MFI ranges for the four HY antigens and four surfaces, see Supplemental Table 2.
As the HY model relies upon female B cell recognition of Y-chromosome encoded minor histocompatibility antigens, levels of antibodies against HY antigens are expected to exceed those of antibodies against their HX homologues (Miklos et al., 2005). Comparing the detection of antibodies against UTY2 and its X homologue, UTX2, all surfaces displayed more seropositivity against UTY2 than UTX2, as was expected. However, only the Epoxy (Schott) and Gentel Path Plus surfaces exhibited similar cutoffs for both protein fragments. These results suggest that these two surfaces will provide the most unbiased comparison of HY antigens and their X homologues.
Epoxy (Schott) showed the best ability to differentiate signal from background noise across many antigens. As compared to the IgG MFI values for DBY on the Epoxy 2 surface, Epoxy (Schott) showed seropositive signals that were both higher and more clearly separated from the negative serum samples. As a true negative control and best indicator of background noise, the negative control p24 antibody signal on the Epoxy (Schott) surface showed high levels of anti-V5 detection but low patient derived IgG binding across all samples. Although one would expect the anti-p24 IgG signal to be closer to zero, we remind the reader that p24 IgG MFI was not normalized by subtracting itself, as p24 signal is subtracted from all other recombinant protein signals to normalize for background fluorescence.
To test each surface’s ability to present short peptides for antibody recognition, we printed an overlapping series of “tiled” peptides covering the entire 650 amino acid DBY protein. With this peptide tiling method, we previously discovered 10 immunogenic epitopes as 15–18 amino acid peptides, of which DBY2 is the most frequently recognized H-Y peptide (Miklos et al., 2004). Tiling efficiency and peptide interactions preclude adding the 10 amino acid V5-epitope to each candidate peptide; thus we are unable to ensure matrix binding using anti-V5 detection as we did with our recombinant H-Y proteins above. In the absence of a V5 epitope, it was not possible to directly quantify the amount of peptide printed on each surface using antibodies. We therefore compared antibody frequencies for a panel of the five most immune dominant DBY peptides as an indirect means by which to determine if the peptide was bound and presented. Because of the microarray’s multiplexed nature, peptides and proteins were able to be printed in the same subarray as the HY proteins and incubated with the same patient sera as in previous sections. As shown in Fig. 4, the epoxy surfaces provided higher frequencies of seropositive antibody detection against five immune dominant DBY peptides compared to the nitrocellulose surfaces.
Fig. 4.

Anti-IgG DBY peptide detection. Heatmap showing patient antibody responses against HY peptides of the DBY protein. Intensity of the antibody response is color-coded as a multiple of each HY-seropositivity threshold as determined by male donors, and total seropositivity frequency for each peptide is displayed on the bottom row.
Comparing Epoxy (Schott) and Gentel Path Plus, the two best surfaces for recombinant protein detection, Epoxy (Schott) exhibited a higher frequency of seropositivity for every peptide fragment of the DBY protein than Gentel Path Plus. Overall, Epoxy (Schott) was superior, providing high sensitivity and clear separation of positive and negative signals across both recombinant protein and peptide antigens.
3.3. Comparison of HY microarray with ELISA
Because our prior allogeneic antibody research was conducted using ELISA technology, we compared the two best overall microarray surfaces, Epoxy (Schott) and Gentel Path Plus, with ELISA to determine relative performance characteristics. Fig. 5 compares the anti-IgG MFI values obtained for the Epoxy (Schott) and Gentel Path Plus surface chemistries to ELISA results for the recombinant proteins DBY and UTY2 as well as the peptide DBY2. Surprisingly, microarray concordance with ELISA varied by antigen. Detailed statistical tests for each HY antigen and each surface are included in Supplemental Table 3. As can be seen, UTY2 showed a strong association with ELISA (R2 = 0.8795 for Epoxy (Schott), R2 = 0.6959 for Gentel Path Plus). However, when measuring DBY antibody response, 50% of the ELISA responders were undetectable by HY microarray. We believe these patients were truly DBY seropositive because: 1) Prospective ELISA testing showed DBY antibody development and persistence over time in association with cGVHD, and 2) DBY peptide antibodies were detected in 67% of the plasma samples that tested positive for DBY. However, the incongruent DBY antibody results suggest access to antibody binding epitopes varies by matrix substrate and emphasizes the importance of measuring alloimmunity against multiple HY-antigens concurrently. The HY microarray’s ability to simultaneously test a panel of HY antigens and their immune dominant peptide epitopes makes the platform a logical and sensitive approach for identifying alloimmunity. Overall, Epoxy (Schott) provided the greatest similarity to ELISA results across our HY antigens.
Fig. 5.

Comparison of microarray and ELISA anti-HY antibody quantifications. Detection of antibodies against HY protein fragment UTY2, HY protein DBY, and HY peptide DBY2 for two slide surfaces. Y axis shows microarray MFI, while X axis shows ELISA absorbance. Horizontal and vertical lines represent seropositivity cutoffs for microarray and ELISA, respectively. See Supplemental Table 3 for correlation coefficients and p values.
3.4. Reproducibility and standard practice
To ensure that every batch of microarray slides are consistently printed and processed reproducibly, we detect a positive control serum in the 16th subarray of all HY microarrays. The concurrent testing of positive control sera is a valuable advantage of multiplexed assays. In practice, we compare the positive control results to our previously acquired data, as shown in Fig. 6. If the MFI for each antigen falls within the interquartile range (IQR) of its control distribution, we consider the slide suitable for analysis. To further ensure consistency, the same set of 60 male donor plasma is tested to establish cutoffs for new print batches.
Fig. 6.
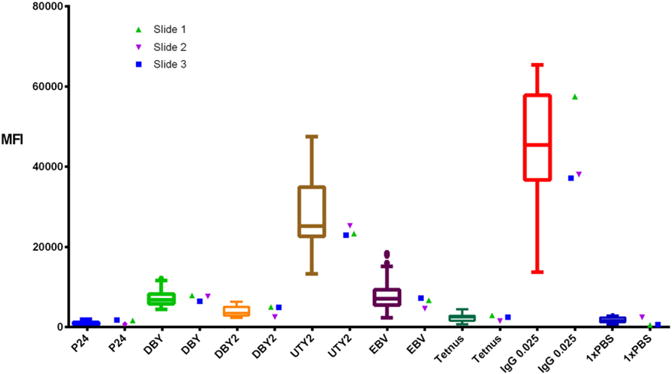
Control serum reproducibility. Comparison of three slides’ control serum quantifications for antibodies against several antigens. Box and whisker plots represent the MFI range for the same serum sample across 37 previously run sides. Measurements within the IQR of this distribution are considered acceptable.
3.5. Clinical utility
Because of Epoxy’s (Schott) consistency and high sensitivity to detecting HY antibodies against both proteins and peptides, coupled with its increased sensitivity compared to ELISA measurements, we chose this slide surface for our subsequent microarray analyses.
Over ten years ago, we used ELISA technology to discover HY antibodies develop in association with cGVHD. In order to confirm the clinical utility of our HY microarray technology, we quantified serum levels of IgG against 5 H-Y antigens in 118 F➔M HCT patient plasma samples collected between 1 and 1.5 years post-transplant. We then related any H-Y seropositivity to cGVHD development. As shown in Fig. 7, patients with cGVHD exhibit both a higher frequency and intensity of anti-HY antibodies for every antigen compared to patients who never developed cGVHD. For example, there was over a four-fold increase in seropositivity frequency for antibodies against the UTY protein in patients who had cGVHD compared to patients without cGVHD (43% versus 11%).
Fig. 7.
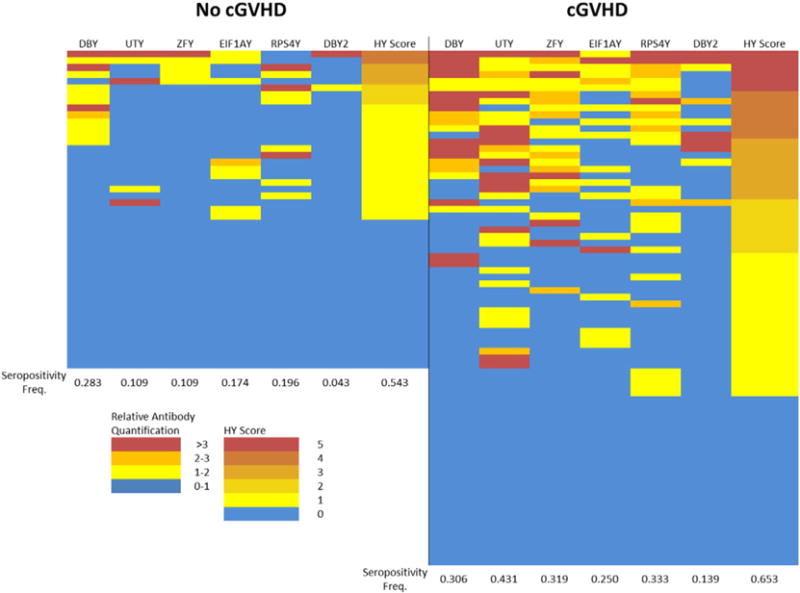
Anti-HY antibody responses in F➔M HCT recipients with and without cGVHD. Comparison included 118 F➔M samples taken between 1 and 1.5 years post-transplant. Intensity of the antibody response is color-coded as a multiple of each HY-seropositivity threshold. HY score represents the cumulative number of seropositive HY antigens. The cGVHD group shows a statistically significant difference in the number of patients with an HY score greater than 1 compared to the non-cGVHD group (p = 0.0082; Fisher’s exact test).
Additionally, the multiplexed nature of the HY microarray allows us to measure the HY score of each patient, or the cumulative number of seropositivies against each HY protein. This score has been shown to correlate with both cGVHD development and non-relapse mortality in F➔M HCT patients (Nakasone et al., 2014). Once again, the cGVHD group has a higher frequency and intensity of HY scores greater than 0, with a significant difference between the two groups in the frequency of patients with an HY score greater than 1 by Fisher’s exact test (p = 0.0082).
From this limited experiment, we conclude that HY microarray confirms our previous observation that HY seropositivity correlates with cGVHD development, with the added benefit of microarrays being a more efficient and multiplexed technology. Using HY micro-arrays, we have now determined that HY antibodies detected at 3-months post transplant associate with both cGVHD development and non-relapse mortality; moreover, female donor HY status has no correlation with clinical outcomes post-transplant in male recipients (Nakasone et al., 2015a, 2015b).
4. Conclusion
Overall, our results suggest that protein microarrays allow for a more multiplexed, sensitive, and efficient method of detecting alloantibodies against both HY proteins and peptides compared to ELISA. These experiments sought to maximize the detection of allogeneic antibodies for studying the HY model of alloreactivity. Both Epoxy (Schott) and the nitrocellulose-based Gentel Path Plus surfaces provided high sensitivity and consistency for detection of antibodies against recombinant proteins. However, Epoxy (Schott) also reproducibly presented peptides for antibody detection. Our comparison of ELISA to microarray detection shows how surface chemistry can restrict epitope availability in a non-predictable manner, highlighting the need of a multiplexed assay for the collection of empiric signal data for each HY antigen and its corresponding peptides. The use of Epoxy (Schott) microarrays has allowed us to further study alloimmunity in F➔M HCT patients and reveal an association between anti-HY antibody detection and cGVHD development. Moreover, the ability to study peptides enables the examination of individual epitopes, granting unprecedented specificity to the study of HY alloimmunity. For maximum utility of HY microarrays, Epoxy (Schott) surfaces can be studied in concert with ELISA-based detection, as there is no method currently considered the “gold standard” for alloantibody detection. Nevertheless, the use of Epoxy (Schott) coated HY microarrays has the potential to refine and optimize the clinical utility of HY antibody detection.
Supplementary Material
Abbreviations
- ELISA
enzyme-linked immunosorbent assay
- HCT
hematopoietic cell transplantation
- mHA
minor histocompatibility antigen
- cGVHD
chronic graft versus host disease
- F➔M
female donor into a male recipient
- MFI
median fluorescence intensity
- IQR
interquartile range
Appendix A. Supplementary data
Supplementary data to this article can be found online at http://dx.doi.org/10.1016/j.jim.2016.02.009.
References
- Balboni I, Limb C, Tenenbaum JD, Utz PJ. Evaluation of microarray surfaces and arraying parameters for autoantibody profiling. Proteomics. 2008;8:3443–3449. doi: 10.1002/pmic.200800146. http://dx.doi.org/10.1002/pmic.200800146. [DOI] [PMC free article] [PubMed] [Google Scholar]
- Guilleaume B, Buneß A, Schmidt C, Klimek F, Moldenhauer G, Huber W, Arlt D, Korf U, Wiemann S, Poustka A. Systematic comparison of surface coatings for protein microarrays. Proteomics. 2005;5:4705–4712. doi: 10.1002/pmic.200401324. http://dx.doi.org/10.1002/pmic.200401324. [DOI] [PubMed] [Google Scholar]
- Loren AW, Bunin GR, Boudreau C, Champlin RE, Cnaan A, Horowitz MM, Loberiza FR, Porter DL. Impact of donor and recipient sex and parity on outcomes of HLA-identical sibling allogeneic hematopoietic stem cell transplantation. Biol Blood Marrow Transplant. 2006;12:758–769. doi: 10.1016/j.bbmt.2006.03.015. http://dx.doi.org/10.1016/j.bbmt.2006.03.015. [DOI] [PubMed] [Google Scholar]
- Miklos DB, Kim HT, Miller KH, Guo L, Zorn E, Lee SJ, Hochberg EP, Wu CJ, Alyea EP, Cutler C, Ho V, Soiffer RJ, Antin JH, Ritz J. Antibody responses to H-Y minor histocompatibility antigens correlate with chronic graft-versus-host disease and disease remission. Blood. 2005;105:2973–2978. doi: 10.1182/blood-2004-09-3660. [DOI] [PMC free article] [PubMed] [Google Scholar]
- Miklos DB, Kim HT, Zorn E, Hochberg EP, Guo L, Mattes-Ritz A, Viatte S, Soiffer RJ, Antin JH, Ritz J. Antibody response to DBY minor histocompatibility antigen is induced after allogeneic stem cell transplantation and in healthy female donors. Blood. 2004;103:353–359. doi: 10.1182/blood-2003-03-0984. [DOI] [PMC free article] [PubMed] [Google Scholar]
- Nakasone H, Remberger M, Tian L, Brodin P, Sahaf B, Wu F, Mattsson J, Lowsky R, Negrin R, Miklos DB, Meyer E. Risks and benefits of sex-mismatched hematopoietic cell transplantation differ by conditioning strategies. Haematologica. 2015a doi: 10.3324/haematol.2015.125294. [DOI] [PMC free article] [PubMed] [Google Scholar]
- Nakasone H, Tian L, Sahaf B, Kawase T, Schoenrock K, Perloff S, Ryan CE, Paul J, Popli R, Wu F, Otani JM, Coller J, Warren EH, Miklos DB. Allogeneic HY antibodies detected 3 months after female-to-male HCT predict chronic GVHD and nonrelapse mortality in humans. Blood. 2015b;125:3193–3201. doi: 10.1182/blood-2014-11-613323. [DOI] [PMC free article] [PubMed] [Google Scholar]
- Popli R, Sahaf B, Nakasone H, Lee J, Miklos D. Clinical impact of H-Y alloimmunity. Immunol Res. 2014;58:249–258. doi: 10.1007/s12026-014-8514-3. http://dx.doi.org/10.1007/s12026-014-8514-3. [DOI] [PMC free article] [PubMed] [Google Scholar]
- Randolph SSB, Gooley TA, Warren EH, Appelbaum FR, Riddell SR. Female donors contribute to a selective graft-versus-leukemia effect in male recipients of HLA-matched, related hematopoietic stem cell transplants. Blood. 2004;103:347–352. doi: 10.1182/blood-2003-07-2603. [DOI] [PubMed] [Google Scholar]
- Robinson WH, DiGennaro C, Hueber W, Haab BB, Kamachi M, Dean EJ, Fournel S, Fong D, Genovese MC, de Vegvar HEN, Skriner K, Hirschberg DL, Morris RI, Muller S, Pruijn GJ, van Venrooij WJ, Smolen JS, Brown PO, Steinman L, Utz PJ. Autoantigen microarrays for multiplex characterization of autoantibody responses. Nat Med. 2002;8:295–301. doi: 10.1038/nm0302-295. [DOI] [PubMed] [Google Scholar]
- Sahaf B, Yang Y, Arai S, Herzenberg LA, Herzenberg LA, Miklos DB. H-Y antigen-binding B cells develop in male recipients of female hematopoietic cells and associate with chronic graft vs. host disease Proc Natl Acad Sci. 2013;110:3005–3010. doi: 10.1073/pnas.1222900110. http://dx.doi.org/10.1073/pnas.1222900110. [DOI] [PMC free article] [PubMed] [Google Scholar]
- Stoevesandt O, Taussig MJ, He M. Protein microarrays: high-throughput tools for proteomics. Expert Rev Proteomics. 2009;6:145–157. doi: 10.1586/epr.09.2. http://dx.doi.org/10.1586/epr.09.2. [DOI] [PMC free article] [PubMed] [Google Scholar]
- Wadia PP, Coram M, Armstrong RJ, Mindrinos M, Butte AJ, Miklos DB. Antibodies specifically target AML antigen NuSAP1 after allogeneic bone marrow transplantation. Blood. 2010;115:2077–2087. doi: 10.1182/blood-2009-03-211375. [DOI] [PMC free article] [PubMed] [Google Scholar]
- Wadia P, Sahaf B, Miklos D. Recombinant antigen microarrays for serum/plasma antibody detection. In: Wu CJ, editor. Protein Microarray for Disease Analysis SE - 7, Methods in Molecular Biology. Humana Press; 2011. pp. 81–104. http://dx.doi.org/10.1007/978–1-61779-043-0_7. [DOI] [PubMed] [Google Scholar]
- Wilson DS, Nock S. Recent developments in protein microarray technology. Angew Chemie Int Ed. 2003;42:494–500. doi: 10.1002/anie.200390150. http://dx.doi.org/10.1002/anie.200390150. [DOI] [PubMed] [Google Scholar]
Associated Data
This section collects any data citations, data availability statements, or supplementary materials included in this article.