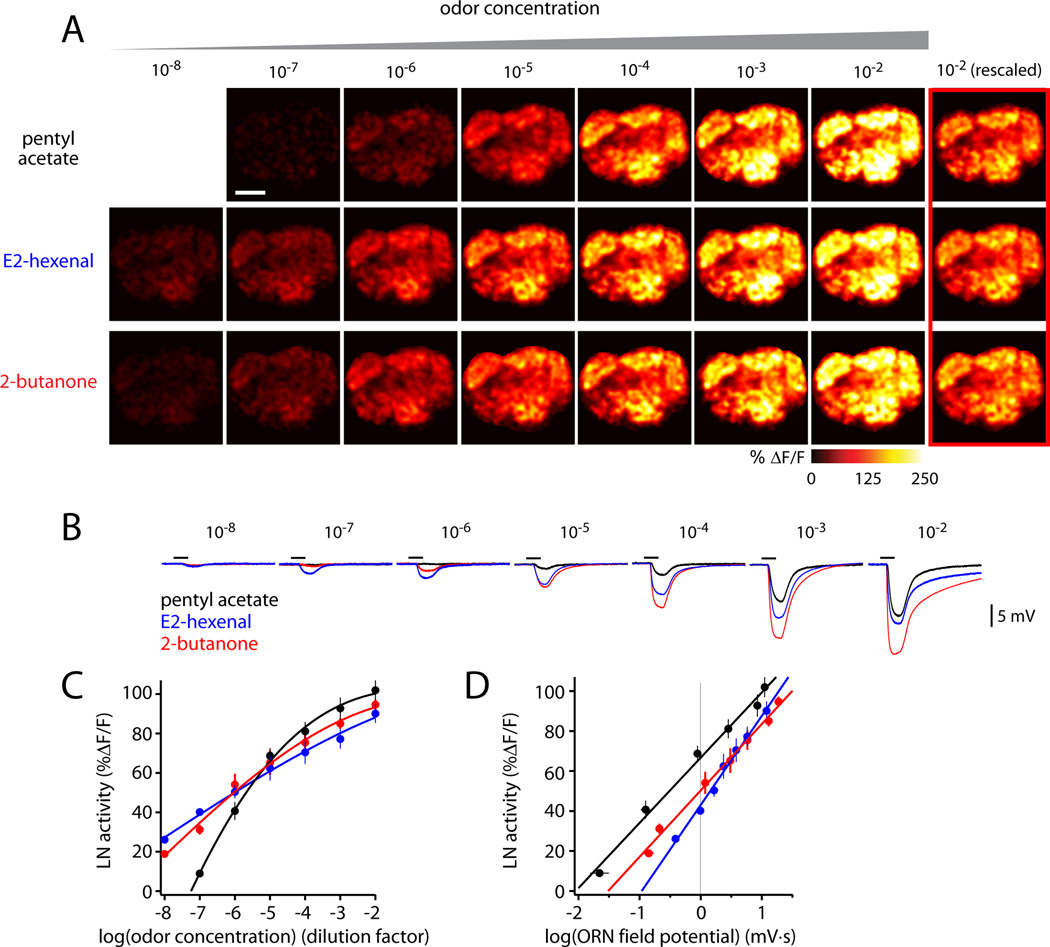
Figure 3. LN activity increases with total ORN input.
(A) Odor-evoked calcium signals in LNs elicited by a family of concentrations for each odor. GCaMP3 is expressed under the control of GH298-Gal4. Note that the color scale differs from that in Figure 1. Scale bar, 20 µm. Different stimuli elicit similar spatial patterns of LN activity, but with different magnitudes. The last column (red outline) is the response to the highest concentration (10−2) rescaled to match the response to an intermediate concentration (10−4): note the similarity in spatial patterns.
(B) Local field potentials recorded in an antenna elicited by the same stimuli. The black bar is the 500-msec odor stimulus period.
(C) Overall levels of LN activity increase with odor concentration. For each concentration of each odor, LN activity (%ΔF/F) was averaged across all glomeruli and experiments. Error bars are ± SEM across experiments. Lines are Hill equation fits. Either GH298-Gal4 (5–7 experiments) or NP3056-Gal4 (3 experiments) was used to drive GCaMP expression; the two data sets were pooled because results were similar.
(D) Overall levels of LN activity depend linearly on the logarithm of ORN input. LN data is the same as in (C). ORN input is measured by averaging local field potential recordings (8 antennal recordings like that in (B), averaged together with 5 palp recordings, each weighted according to the proportion of ORNs housed in each respective structure, ± SEM; see Supplemental Experimental Procedures). Analysis of covariance indicates a significant interaction between LN activity and odor across concentrations (p=0.002).

