

Abstract
Mass cytometry (CyTOF), a mass spectrometry-based single cell phenotyping technology, allows utilization of over 35 antibodies in a single sample and is a promising tool for translational human immunology studies. Although several analysis tools are available to interpret the complex data sets generated, a robust method for standardization and quality control within and across studies is needed. Here we report an efficient and easily adaptable method to monitor quality of individual samples in human immunology studies and to facilitate reproducible data analysis. Samples to be assessed are spiked with a defined amount of reference peripheral blood mononuclear cells from a healthy donor, derived from a single large blood draw. The presence of known standardized numbers and phenotypic profiles of these reference cells greatly facilitates sample analysis by allowing for: 1) quality control for consistent staining of each antibody in the panel, 2) identification of potential batch effects, and 3) implementation of a robust gating strategy. We demonstrate the utility of this method using peripheral blood and bronchoalveolar lavage samples from HIV+ patients by characterizing their CD8+ T-cell phenotypes and cytokine expression, respectively. Our results indicate that this method allows quality control of experimental conditions and results in highly reproducible population frequencies through a robust gating strategy.
Keywords: Mass cytometry, CyTOF, HIV, clinical studies, human immunology
Introduction
Mass Cytometry (CyTOF) is an emerging single cell phenotyping technology with potential as a discovery and screening tool in translational clinical research. The principle of this technology is similar to flow cytometry, but antibodies are labeled with monoisotopic lanthanide metals rather than fluorochromes, and detection is based on inductively coupled plasma time-of-flight mass spectrometry (1).
The main advantages of mass cytometry over fluorescent cytometry are minimal spectral overlap between channels, the absence of auto-fluorescence and natural contaminants (lanthanide metals are not abundant in biological materials), and the straightforward use of much larger antibody panels than has been possible with standard flow cytometry (2,3). Today, up to 46 different metal-isotopes are routinely utilized for mass cytometry (4,5), with future developments having the potential to increase this number up to the current technical limit of 100–130 different isotopes (3,6,7). In contrast, multicolor flow cytometry panels with 17 or more fluorochromes have only rarely been reported, due to the inherent technical challenges (8,9). Thus, mass cytometry holds great potential as a routine screening and surveillance tool for high parameter phenotyping to support translational clinical research and should facilitate biomarker discovery in cancer, infectious diseases, autoimmunity, and other disorders.
With increasing numbers of parameters being assessed simultaneously by CyTOF, data analysis becomes significantly more challenging (10). Furthermore, quality control of individual experiments is of crucial importance, especially in clinical settings, as is the ability to assess staining performance for 30 or more different antibodies. Therefore, there is a particularly urgent need for methods to standardize both within and across studies. With this in mind, there has been an effort to develop protocols and software to determine reproducibility and facilitate high dimensional data analysis (4,10-13). Today, mass cytometry experiments routinely include bead standards that allow for normalization of instrument variation (12). Furthermore, barcoding tools allow for acquisition of up to 20 samples simultaneously, leading to significantly reduced batch effects within experiments caused by differential antibody staining or instrument sensitivity (4,13). However, data reproducibility and variation among independent experiments performed on different days still remain a major concern. While bead standards enable some compensation for signal variations due to variations in machine performance, they do not sufficiently control for experimental variability. Current bar-coding protocols allow identical staining conditions for up to 20 samples, but may be unfeasible for some CyTOF staining protocols that require staining of surface markers in their native conformation using unfixed cells and also cannot control for experimental variation between different sets of experiments. Therefore, standardization methods that are applicable to large studies with samples run over multiple days or studies relying on fresh samples that require many separate sets of experiments to be run over the duration of a study are still widely lacking.
To address these concerns, we developed a reference sample method to assess the quality of individual experiments and samples in the context of human immunology studies with the goal of identifying and compensating for variations within different sets of experiments during data analysis. We designed this protocol to be easily adaptable to many different scientific questions in order to ensure applicability of this method to a wide range of human mass cytometry studies. Furthermore, we describe a data quality control strategy, which can be applied using FlowJo or similar flow cytometry analysis software and does not require knowledge about complex algorithms and analysis tools. This method is thus anticipated to facilitate assessment of data quality as well as monitoring of individual experiments throughout a particular study.
The core principle of the proposed method is the inclusion of CD45-barcoded reference peripheral blood mononuclear cells (PBMCs), derived from one single large blood sample from a healthy donor, into each individual patient sample prior to staining with the panel. This allows application of the reference method even to antibody panels that contain fixation-sensitive epitopes. During data analysis the reference PBMCs provide a baseline for robust gating and allow controlling for staining variations among different sets of experiments. Additionally, the reference PBMCs can be utilized for quality control of antibody staining, as the different cell populations within the same reference sample exhibit stable frequencies over all experiments and for all antibodies within the panel. We show here the applicability of this quality control method in the context of two experimental setups: 1) reproducibility of CD8+ T-cell phenotyping in HIV-infected individuals and 2) comparison of cytokine expression between bronchoalveolar lavage (BAL) and matched peripheral blood from HIV-infected subjects.
Materials and Methods
Human Subjects
PBMCs for the reference samples were obtained from buffy coats of healthy blood donors at Massachusetts General Hospital and were cryopreserved according to IRB approved protocols. HIV-infected subjects were recruited from outpatient clinics at local Boston hospitals and referred from providers throughout the United States, following institutional review board approval and written informed consent (IRB protocol #2003P001894). For the second part of the study, BAL samples with donor-matched peripheral blood samples from HIV-infected patients were used. Participants were recruited from existing cohorts at Massachusetts General Hospital following institutional review board approval and written informed consent (IRB protocol #2013P002436). Bronchoscopy was performed under conscious sedation via standard technique. Two BALs were performed with 120 mL of normal saline each in a segment of the lingula and a segment of the right middle lobe. Peripheral blood from the study subjects was obtained on the same day as the bronchos-copy and all samples were processed immediately and stained for CyTOF analysis, without cryopreservation.
Antibodies and Reagents
The antibody panels used for mass cytometry experiments in this study are summarized in Supporting Information Table S1. Pre-labeled antibodies were purchased from Fluidigm (South San Francisco, CA); unlabeled antibodies were purchased in carrier-free buffer from BioLegend (San Diego, CA), BD Biosciences (San Jose, CA), and eBioscience (San Diego, CA) as indicated in Supporting Information Table S1. Conjugation of unlabeled antibodies with lanthanide metals was performed using MaxPar® Antibody X8 conjugation kits (Fluidigm) according to manufacturer’s instructions, reconstituted in PBS-based antibody stabilizer (CANDOR Bioscience, Wangen, Germany) and stored at 4°C. Prior to use, each batch of labeled antibodies was titrated to determine optimal staining concentrations and diluted to 100× working stocks with antibody stabilizer. Anti-CD8a eVolve605 (eBio-science) was used for mass cytometry experiments and detected with the 114Cd channel.
RPMI-1640 (Sigma-Aldrich, St. Louis, MO) was supplemented with 10% FBS (Sigma-Aldrich), penicillin–streptavidin (Corning Cellgro, Manassas, VA), l-glutamine (Corning Cellgro), and HEPES (Corning Cellgro) (further referred to as R10-medium) was used for thawing and culturing PBMCs. Sample preparation for mass cytometry experiments was performed using Ca2+ and Mg2+-free PBS (Sigma-Aldrich), Cell Staining Media (CSM, PBS with 5 mg/mL protease-free bovine serum albumin (Sigma-Aldrich) and 0.2 mg/mL sodium azide (Sigma-Aldrich)), 16% PFA solution (Electron Microscopy Sciences, Hatfield, PA), Fix and Perm buffer (Fluidigm) for simultaneous fixation and permeabilization of the cells prior to intracellular staining and Cell Staining Media with 0.3% saponin (Sigma-Aldrich) (CSM-S) as permeabilization buffer. MilliQ ultrapure water was used for additional sample washing steps and as sample carrier during the CyTOF run.
Cell Isolation and In Vitro Culture
PBMCs were processed from peripheral blood, leukapheresis, or whole blood buffy coat using Ficoll density-gradient centrifugation, and either used immediately for CyTOF staining or frozen in fetal bovine serum (FBS) (Sigma-Aldrich) + 10% DMSO (Fisher BioRegents, Fair Lawn, NJ) in liquid nitrogen for long-term storage. A single buffy coat yields ~500 million PBMCs, therefore cells serving as the reference samples were frozen in a large batch of at least 50 aliquots with 10 million cells each. For isolation of BAL cells the BAL fluid was filtered through a 70-μm cell strainer. The cells were then harvested by centrifugation at 300 × g for 10 min. After resuspension of the cell pellet in R10 media, BAL cells were used immediately for CyTOF staining.
Mass Cytometry
Patient and reference PBMC samples were thawed at the same time using warm R10 media and rested in R10 media at a concentration of 5M viable cells per mL for 2 h at 37°C. For the PBMC study, CD8+ T cells from patients were isolated using untouched magnetic separation (Stemcell, Vancouver, Canada). We transferred 2 × 10⁶ patient CD8+ T cells per sample into 5 mL FACS tubes and then stained with anti-CD45 141Pr. At the same time PBMCs from the reference sample were stained with anti-CD45 89Y. After washing out excess antibody, 4 × 10⁵ reference PBMCs were spiked into 2 × 10⁶ patient cells (ratio 1:5) before continuing with the CyTOF staining protocol. Cells were then stained with 103Rh viability dye (1:400) for 20 min at room temperature. After washing the cells once with CSM, Fc receptors were blocked in 50 μL volume (Human TruStain FcX, BioLegend, San Diego, CA) for 5 min at room temperature immediately before adding 50 μL of surface antibody cocktail, which was filtered through a 0.1-μm spin filter (EMD Millipore, Billerica, MA) for 10 min at 14,000 × g prior to staining to remove aggregates and incubated with the cells for 30 min at room temperature. Samples were then fixed and permeabilized for 20 min at room temperature using 500 μL Fix and Perm buffer (Fluidigm). Fix and Perm buffer was removed by two wash steps, using 1 mL of CSM-S each. The intracellular antibody cocktail was filtered through a 0.1-μm spin filter for 10 min at 14,000g to remove aggregates, then added to the samples and incubated for 45 min at room temperature in a total volume of 100 μL. Excess antibodies were washed out by two washing steps with CSM-S, followed by staining of DNA with Cell-ID Intercalator-Ir (Fluidigm) at a final concentration of 125 nM in 500 μL 4% fresh PFA (diluted in PBS) over night at 4°C. Immediately prior to sample acquisition using the CyTOF2, cells were washed twice with PBS and twice with MilliQ water. Samples were resuspended at 2.5−5 × 10⁵ cells per mL in MilliQ water containing EQ™ Four Element Calibration Beads (1:20) (Fluidigm) and filtered through a 35-μm cell strainer (Corning Incorporated, Durham, NC).
Flow Cytometry
For comparison of lineage frequencies between Mass Cytometry and Flow Cytometry, 1 × 10⁶ PBMCs from the reference sample were stained with LIVE/DEADV® Fixable Blue Stain (1:2,000, Thermo Fisher). Fc receptors were blocked in 50 μL volume (Human TruStain FcX, BioLegend) for 5 min at room temperature immediately before adding 50 μL of surface antibody cocktail, which included CD3 BV605 (clone OKT3; BioLegend), CD8 BUV395 (clone RPA-T8; BD Biosciences), CD14 BV510 (clone M5E2; BioLegend), and CD19 APC-Cy7 (HIB19; BioLegend). After 20 min incubation at room temperature, excess antibody was washed out with Flow buffer (PBS + 1% FBS) and the cells were fixed in 2% PFA for 15 min at room temperature. Samples were acquired with a 5-laser LSRFortessa, equipped with following lasers: 488 nm, 561 nm, 640 nm, 405 nm, and 355 nm (BD Biosciences).
Data Analysis and Statistics
FCS files derived from the CyTOF2 machine were normalized and concatenated (if necessary) using Fluidigm Helios software (version 6.3.119, Fluidigm). FlowJo software (v10.0.8 for Mac) was used to analyze and display data, except for viSNE analyses and the histograms shown in Supporting Information Figure S2, which were performed using Cytobank (Cytobank, Inc., Mountain View, CA).
Semi-automated gating (“tethered gating”) in FlowJo was utilized to determine gates for each individual marker based on the negative population of the reference sample. First, the following populations were gated according to lineage markers in the panel: CD8+ T cells (CD3+ CD8+), CD4+ T cells (CD3 + CD8−), B cells (CD3−CD19+ CD14−), Monocytes (CD3−CD19−CD14+), and NK cells (CD3−CD19− CD14−CD57+) cells. Tethered gating was used to gate the 98th percentile with a multiplier of 1 in the respective negative population for each marker. These gates were then applied to the respective positive populations of each marker and to the CD8+ T-cell population of the patient sample. Frequencies for each population were exported to Excel (Microsoft Office 2011) and GraphPad Prism 6 (La Jolla, CA) for subsequent analysis and data presentation. Statistical analysis of TNFα expression in PBMCs and BAL (Fig. 4B) was performed using a paired student’s t test.
Figure 4.
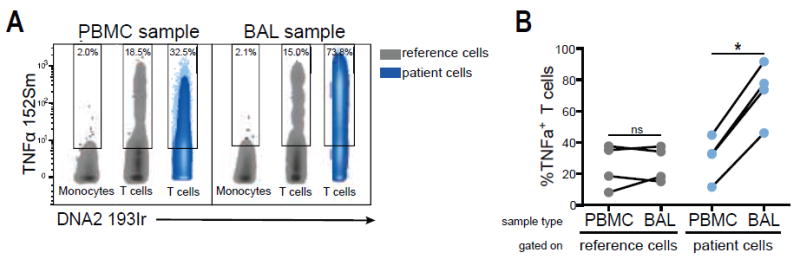
Comparison of TNFα expression between PBMCs and BAL from HIV-infected donors. A: TNFα expression in patient T cells derived from either PBMCs or BAL (blue) after 4 h PMA stimulation. Reference cells were spiked into both sample types (gray). Gates are based on the 98th percentile of reference monocytes using tethered gates. B: TNFα frequencies in T cells from PBMCs and BAL derived from four HIV-infected individuals (blue) and in reference T cells, which were spiked into the respective sample (gray). Significance testing was assessed using paired student’s t test.
Results
Reference Samples Reveal PBMC Subpopulations with Differential Expression Patterns of Markers Included in a CD8+ T-Cell-Specific Mass Cytometry Panel
For this study, we developed a mass cytometry panel designed to characterize expression of activation and inhibition markers on CD8+ T-cells from HIV-infected patients (Supporting Information Table S1). HIV, as a chronic infectious disease, induces exhaustion of CD8+ T cells during the course of infection, which is thought to impair the natural immune response against HIV (14-19). The panel was used here to demonstrate the feasibility of our standardization protocol. As a reference sample for the subsequent experiments we obtained a single, large blood donation (buffy coat) from one healthy donor (for details see Material and Methods). Given the high possible yield of PBMCs (>500M cells) from a single donor whole blood sample, the same reference sample can be used in as many single CyTOF experiments as aliquots are available (>50 aliquots with 10M cells each in our case) and thus serve as consistent control within all experiments. We chose primary PBMCs as reference cells over cell lines, because expression of the antigens of interest and specific cell subsets would be more comparable than cell lines to the patient PBMC samples.
In the first step, we evaluated staining properties of antibodies included in the CD8+ T-cell panel by analyzing expression patterns within different PBMC subsets of the reference sample from the healthy donor. Given the phenotypically distinct cell subsets that generally comprise PBMCs, we hypothesized that we would identify subsets with distinct expression patterns for each marker in the panel, thereby providing populations to serve as internal controls. We determined PBMC subsets by manual gating (Supporting Information Fig. S1A), as well as by viSNE analysis (11), thereby generating a 2-dimensional map of the PBMC subsets with the selected markers CD3, CD8a, CD19, CD14, and CD45RO (Fig. 1A). Both analyses revealed similar frequencies of the main PBMC lineages: CD4+ T cells (defined as CD3+ CD8−, 35% and 37%, respectively), CD8+ T cells (defined as CD3+ CD8+, 16% and 20%, respectively), monocytes (defined as CD3−CD14+, 10% and 6%, respectively), B cells (defined as CD3−CD19+, 19% and 22%, respectively), and NK cells (defined as CD3−CD14−CD19−, 12% and 14%, respectively) (Fig. 1A and Supporting Information Fig. S1A). These frequencies also reflect results determined with standard flow cytometry (Supporting Information Fig. S1B).
Figure 1.
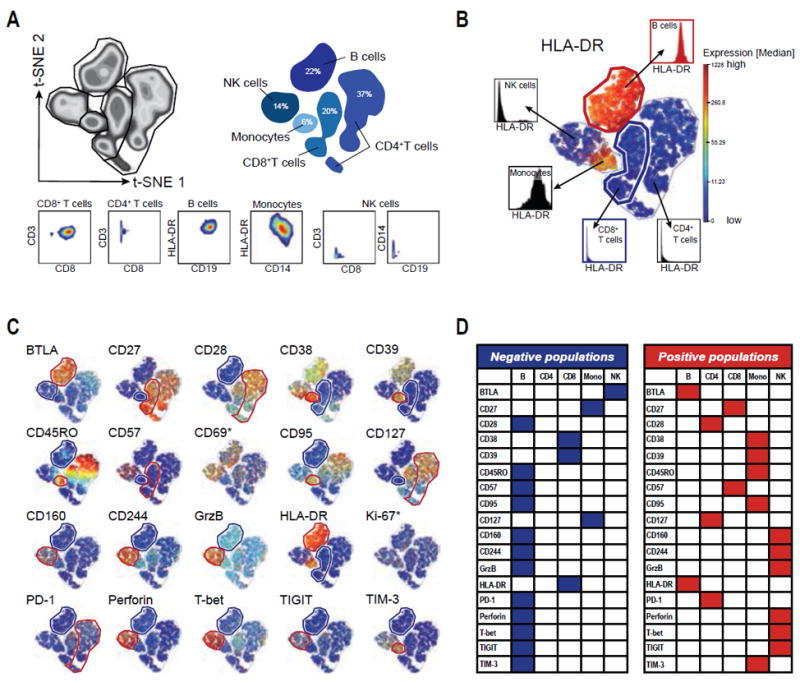
Expression patterns of mass cytometry CD8+ T-cell panel markers in PBMCs from the healthy reference blood donor. A: viSNE analysis of viable PBMCs as density plot (left) and shadow plot (right) indicating PBMC lineages. 2D plots below show lineage marker expression for each population. B: Example of identifying negative and positive reference populations for HLA-DR. viSNE plot colored by HLA-DR expression-levels and histograms showing HLA-DR expression for each PBMC population. The negative population (CD8+ T cells) is defined as the population with the lowest expression of HLA-DR and is highlighted by a blue gate and histogram. For CD57, CD8 T cells are the positive populations, which express low levels of this marker (see also Supporting Information Fig. S2). The positive population (B cells) is defined as the population with the highest expression of HLA-DR and is highlighted by a red gate and histogram. C: viSNE plots for all 20 markers in the panel (including Ki-67 and CD69) colored by the respective marker expression. Negative populations for each marker are indicated with a blue gate, positive populations for each marker are indicated with a red gate. D: Summary of positive and negative populations for each marker within the reference PBMCs excluding Ki-67 and CD69.
We next visualized expression of the 20 markers, which were not included in the previous identification of the cell-events and lineages (i.e., DNA, Viability, CD45, CD3, CD8, CD14, and CD19) in the panel for each of these PBMC subsets within the reference sample using the coloring dimension of the viSNE map (Figs. 1B and 1C). This analysis identified expression differences of each marker within the individual subsets resulting in the identification of populations that are negative (blue gates) for the respective marker, e.g., CD8+ T cells for HLA-DR (Fig. 1B). We additionally identified the subpopulation with the highest expression for the respective marker (e.g., B cells for HLA-DR, Fig. 1B) for later quality control, terming this subset the positive population (red gates). Figures 1C and 1D depict the negative and positive populations for each individual marker and the manually gated lineages confirmed these classifications (Supporting Information Fig. S2). Most markers revealed discrete negative and positive populations within PBMCs, with the exception of Ki-67 and CD69. None of the reference PBMC subsets expressed Ki-67, a marker for proliferation and cell activation, above background levels, (i.e., 2% using the 98th percentile for gating; Fig. 1C and Supporting Information Fig. S2), likely due to low ex vivo expression levels in PBMCs from healthy subjects without recent infections or vaccinations (20,21). The early activation marker CD69, in contrast, exhibited expression at various levels in all PBMC subsets (Fig. 1C and Supporting Information Fig. S2), which might indicate non-specific cell activation during blood processing, but did not reveal a clear negative population. These observations impeded a definitive interpretation of antibody staining for those two markers, since we based our subsequent data analysis on the identification of positive and negative populations serving as controls during the experiments. Due to this lack of validation for Ki-67 and CD69, we excluded these markers from subsequent analyses.
As expected for a panel focused on characterizing T-cell phenotypes, the majority of markers were not expressed on B cells, which therefore serve as a negative control population for two thirds of the antibodies in this panel (12 of 18). Hence, the positive population of cytotoxic and T-cell exhaustion markers (like Granzyme B, Perforin, and CD160) was identified as the NK subset, whereas the positive populations of activation markers, like CD38 and HLA-DR, were identified as Monocytes and B cells, respectively (Figs. 1C and 1D).
We concluded from these results that identification of negative and positive populations within the reference PBMCs indicated specific binding of the respective antibody and can therefore serve as validation strategy for CyTOF panels.
Spiking of Patient Samples with the Reference Sample Allows Standardization of Experiments and Identification of Substandard Antibody Staining
In the next step, we tested whether spiking of patient samples with reference PBMCs would allow for identification of staining differences and quality control for independent experiments. We selected two HIV-infected patients with multiple PBMC aliquots from the same blood draw to perform three independent experiments (Exemplary data are publicly available at https://flowrepository.org/id/FR-FCM-ZZTY). The experimental setup is outlined in Figure 2A. For each experiment, we thawed PBMCs from the patients, as well as from the reference donor, from whom we had initially frozen a large batch of PBMCs. We then barcoded the reference samples with an anti-CD45 antibody conjugated to 89Y and spiked 2 × 10⁶ CD8+ T cells from each HIV-infected patient, each labeled with anti-CD45 141Pr, with 4 × 10⁵ anti-CD45 89Y-labeled reference PBMCs each from the reference subject. CD45-barcoding allowed discrimination of the reference cells from the patient cells during data analysis (Fig. 2B). The combined samples were subsequently stained with the CD8+ T-cell panel (Supporting Information Table S1) and acquired using a CyTOF2 instrument collecting at least 100,000 events per sample. This number is important to ensure that enough reference cell events (>10,000) are retained for the subsequent data analysis.
Figure 2.
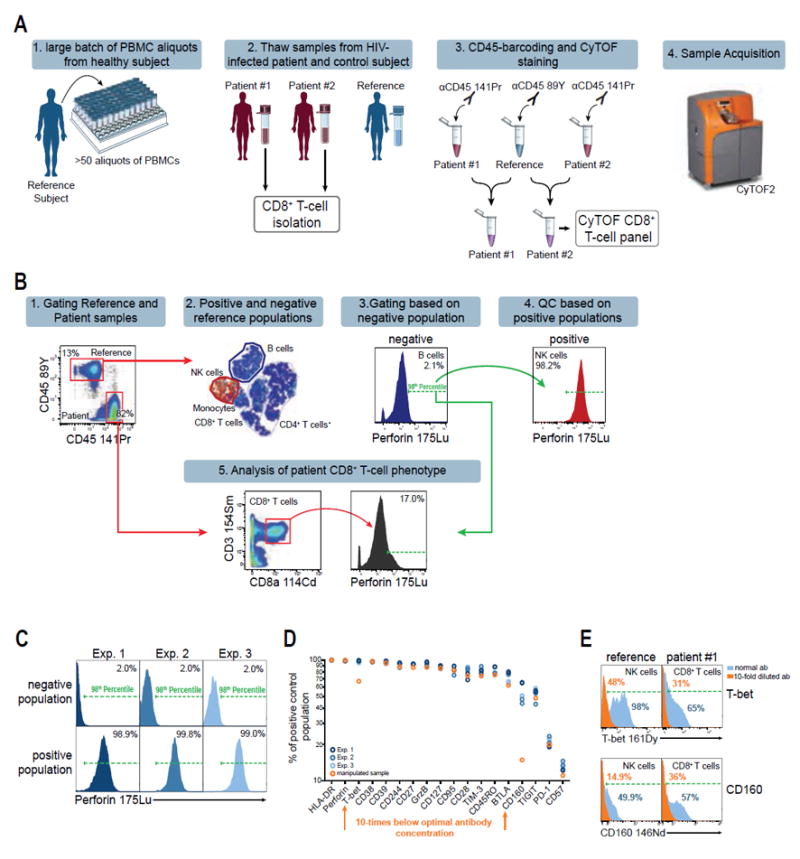
Reference sample approach increases reproducibility of mass cytometry experiments. A: Experimental setup for mass cytometry experiments including a reference sample from a single, healthy donor (blue). B: Data analysis strategy for gating and quality control based on a reference sample. Gates are determined by the 98th percentile of the reference negative population using tethered gating. C: Reproducibility of perforin staining in three replicate experiments of HIV patients spiked with the reference sample. Shown are viable reference cells. Negative reference population is B cells, positive reference population is NK cells. Tethered gates are set by the 98th percentile of the negative population and are subsequently applied to the positive population. D: Expression frequencies of the positive reference populations (as defined in Fig. 1) of each individual marker are shown for three independent experiments with a total of six reference sample repeats. A manipulated sample, which was stained with substandard antibody concentrations for T-bet and CD160 10-times below the optimal concentration, is indicated in orange. Experiments are color-coded and each circle represents reference cells derived from an individual sample. E: Comparison of T-bet and CD160 expression frequencies after staining with the optimal antibody concentrations (blue) and a 10-times lower concentration (orange). The populations shown are NK cells for the reference sample and CD8+ T cells from one HIV-patient, respectively.
The quality control for each experiment was based on the previously established negative and positive populations for each antibody within the reference PBMCs (Fig. 1). Given that this sample is consistent throughout different experiments, we hypothesized that the frequencies of the positive populations would remain stable throughout different samples and experiments. To further streamline data analysis, we substituted subjective manual gating with a semi-automated gating technique using “tethered gates” in FlowJo, which allows automatic adjustment of the gates based on percentiles. We gated the 98th percentile of the negative reference population for each marker (Fig. 2B), as this threshold was robust against outliers while maintaining a stringent gating strategy. Population shifts between samples and experiments due to technical variations are compensated by automatic adjustment of the gates to the 98th percentile of the negative reference populations within each sample. The subsequent transfer of the tethered gates from the negative reference population to the positive reference population as well as the patient CD8+ T-cell population then applies the gate-position as determined by the 98th percentile of the negative reference population (Figs. 2B and 2C).
For example, application of tethered gates for the cytotoxic molecule perforin to its negative population (B cells) within the reference sample resulted in highly comparable perforin frequencies in the respective positive population (NK cells) in all three independent experiments (Median 99%, %CV = 0.5%; Fig. 2C). We then performed the quality control for all 18 antibodies of the CD8+ T-cell panel for the three independent experiments for both HIV-infected patients resulting in six reproductions of expression data from the reference PBMCs, which resulted in highly reproducible frequencies for all markers (Fig. 2D, blue samples). This demonstrates that the reference sample can serve as a robust standard for gating thresholds and reveals consistent staining properties of all antibodies throughout experiment replicates.
To test whether this strategy would also identify experiments with substandard antibody staining, we split one of the patient samples and stained half of it with the regular antibody panel and the other half with 10-fold lower staining concentrations for two antibodies (T-bet and CD160). Quality control as described above revealed lower population frequencies in the positive populations of the reference sample for both markers as compared to the samples with regular staining concentration (Figs. 2D and 2E, orange population). Population frequencies for both markers also decreased within the CD8+ T-cell population of the patient sample, as compared to regular staining concentrations (Fig. 2E), showing that antibody staining errors can be readily identified using the proposed quality control strategy.
Taken together, spiking patient samples with PBMCs from a reference donor facilitates robust gating and quality control of mass cytometry experiments. Additionally, this method has the potential to reveal samples with substandard antibody staining and thereby distinguish between technical errors and true biological variation.
Reproducibility of Expression Frequencies Within Patient CD8+ T Cells Using Reference PBMCs
Next, we examined whether transferring the gates defined by the negative reference populations to the CD8+ T cell population of the patient samples would result in reproducible patient population frequencies. Some of the markers in the panel showed notable staining variations (i.e., CD45RO, Granzyme B, HLA-DR, Perforin, and CD244, respectively), however the majority of markers revealed robust staining intensities between the experiments (Supporting Information Fig. S3). CD45RO expression is shown as an example where the staining intensity varied between individual experiments (Fig. 3A), but application of the tethered gates from the negative reference populations within each sample revealed consistent expression frequencies of CD45RO (Fig. 3A, green gates). Using this analysis strategy to determine expression frequencies of all 18 markers in both patient samples revealed highly reproducible intrapatient frequencies, while emphasizing the differential expression pattern between the two patients (Fig. 3B). Notably, our approach was transferable to the patient samples, despite much higher expression levels of a number of markers, such as PD-1, CD160, and CD244, in the CD8+ T-cell population as compared to CD8+ T cells from the healthy reference donor (Supporting Information Fig. S4). This observation indicates that our reference-sample approach can be applied to pathological conditions, like chronic HIV-infection, which can lead to dramatic expression-changes in certain cell-subsets.
Figure 3.
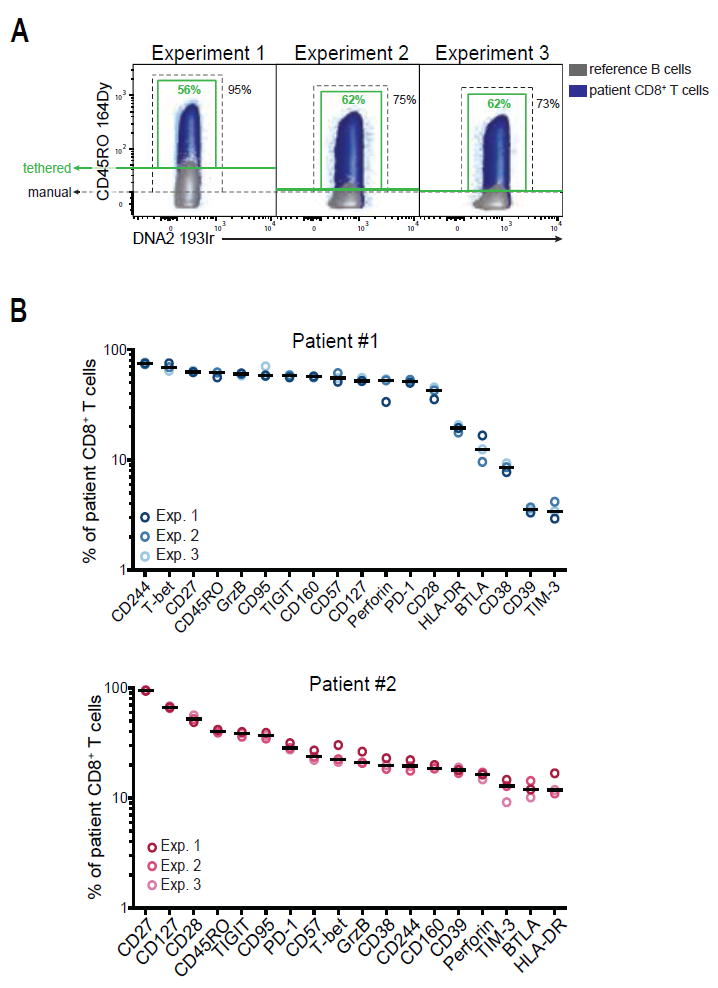
High reproducibility of patient population frequencies after quality control with reference PBMCs. A: Application of the analysis strategy to patient CD8+ T cells using the reference sample approach. CD45RO expression in CD8+ T cells from Patient #1 (blue) for three independent experiments is shown as an example. The negative populations of a spiked-in reference sample are shown for each individual experiment (B-cells, gray) as overlay density plots. The green gates are based on the 98th percentile of the negative reference population (tethered gates); the black gates indicate a manual gate with a constant threshold. B: Expression frequencies of 18 markers in CD8+ T cells from two HIV-patients. Shown are frequencies determined in three independent replicate experiments after gating based on the reference sample. Each circle represents one marker in a single experiment. Median expression is indicated.
These results demonstrate that quality control, as well as the determination of gating thresholds for each individual antibody using the reference sample, allows one to adjust for variations between experiments performed independently on different days. This strategy therefore not only reveals the experimental quality for each sample, e.g. by pointing toward suboptimal staining conditions, but also facilitates robust data analysis of patient samples by providing experiment-specific gating thresholds based on the negative populations of the reference sample. As a consequence, we improved the reproducibility of our CyTOF data by including the reference sample.
Reference Sample Confirms TNFα-Expression Differences Between BAL and Matched PBMCs from HIV-Patients
In order to show adaptability of this protocol to different experimental settings, we next extended the reference sample approach to characterize TNFα expression in donor-matched BAL and PBMC samples from four HIV-infected subjects. Both BAL and PBMC samples were stimulated with PMA in the presence of Monensin and Brefeldin A for 4 h. The reference PBMCs were stimulated in parallel prior to CD45-barcoding and spiking into the patient BAL and PBMCs as described above. Although samples derived from BAL had significantly more background and debris in general, gating revealed reproducible T-cell populations for the reference cells, regardless whether spiked into PBMCs or BAL (Supporting Information Fig. S5) showing that this method was also suitable for cells derived from compartments other than peripheral blood. We based the gating threshold for TNFα-positive cells on the monocyte population within the reference sample, which did not express TNFα under the experimental conditions, and transferred this gate subsequently to T cells of the reference sample and the patient sample, respectively (Fig. 4A). Using this analysis strategy, we identified significantly higher TNFα expression frequencies in BAL-derived samples than in donor-matched PBMCs after short-term in vitro stimulation (Fig. 4B). The reference cells, in contrast, exhibited similar TNFα expression after spiking into PBMCs and BAL, respectively, corroborating that the observed expression difference between BAL and peripheral T cells are true biological differences and not artifactual. We observed slightly diminished TNFα expression in the reference T cells as compared to the peripheral blood T cells of the patients, which could be a consequence of either inter-individual variation in response to PMA or of the prior freezing process of the reference cells. In our subsequent analysis, however, the reference sample is utilized to evaluate technical consistency and not as a healthy control sample within the study, rendering the differential TNFα expression between reference and patient a minor concern during data analysis.
These experiments demonstrated that the reference sample approach is adaptable to other experimental setups and can facilitate data analysis of not only ex vivo cells, but could also be applicable to functional assays characterizing cytokine expression. By using reference cells we were able to include negative and positive controls for TNFα expression at the same time into the patient samples, demonstrating that standardization of cells derived from compartments other than peripheral blood is possible. With this approach we determined that BAL and donor-matched PBMCs respond with differential TNFα expression to in vitro PMA stimulation, indicating inherent functional differences in T cells derived from peripheral blood or BAL.
Discussion
Mass cytometry has been successfully applied to an increasing number of basic research questions (5,11,22-24), and has the potential to become a valuable tool in translational and clinical research studies, especially in the field of bio-marker identification and cell phenotyping. Reproducibility of experiments is a major concern for such studies and controls of technical variations are critical. Current normalization protocols for CyTOF instruments reduce variations among different sets of samples, but do not fully abrogate them. Subsequent analysis of mass cytometry experiments is furthermore complicated by the high dimensionality of the data and lack of analysis strategies to control the performance of all antibody parameters.
In the present study we evaluated a standardization method for mass cytometry, which addresses both of these concerns related to CyTOF studies. We show that addition of a consistent reference sample derived from a single blood donation from a healthy subject provides stable population frequencies within experiments and allows identification of data variations and adjustment of the gating strategy, similar to housekeeping genes, which are integral parts of RNASeq and qPCR technologies (25). We showed that this strategy provides a basis for reproducible patient population frequencies and the identification of biological differences. Additionally, the CD45-barcoding used to spike the reference sample into the patient samples provides another doublet-removal opportunity during data analysis, as CD45 double-positive events indicate remaining doublets that have not been removed by prior steps (i.e., doublet removal via Pd-barcoding and gating of DNAlow events during data analysis). We were also able to readily identify the two markers that had been stained with 10-times lower concentrations, indicating that the proposed quality control could identify substandard performance of single antibodies, which could then be excluded from downstream analysis to prevent a bias of the results. This approach could ultimately facilitate data interpretation as demonstrated by identifying differences in TNFα expression in T cells from BAL samples and donor-matched peripheral blood. Here, the reference sample allowed us to confirm consistent staining and experimental conditions for both sample types. Thus, we can conclude that the observed TNFα-expression difference is a genuine biological observation, rather than a technical error, a conclusion that is corroborated by other studies (26). Thus the proposed reference sample protocol could be the basis for valuable controls in different experimental settings, especially when replicate samples are impossible due to limited sample availability.
Our approach is based on the assumption that background levels of different sample types and cell populations are comparable and not significantly affected by unspecific staining or contaminations. Unlike conventional flow cytometry, mass cytometry is not affected by autofluorescence, which is a major contributor to variable background levels in flow cytometry, thereby preventing the direct comparison of different cell types in many instances. Different cell types have very heterogeneous autofluorescent properties and especially myeloid cells reveal high levels of autofluorescence (27). Other sources of variable background levels are compensation of spillover between channels, which is a minor concern in mass cytometry compared to flow cytometry, and differential unspecific binding of antibodies to PBMC lineages. Although we did not address the latter issue in this study specifically, we did not observe significant variations in background levels of the 18 markers in this study, nor between cells derived from peripheral blood and BAL, respectively (data not shown). Given that the relative background differences between different populations should be consistent across experiments and given that the reference sample is spiked into the patient sample prior to staining, we expect both samples being affected comparably by background binding of antibodies within every individual sample. This point, however, should be given specific attention in future studies to ensure consistency, especially when extending CyTOF studies beyond peripheral blood samples.
The semi-automated “tethered” gating approach in FlowJo (or similar analysis methods) allows for fast and straightforward quality control of the data even with large antibody panels, before applying further downstream analysis with potentially more complex algorithms. In addition to ensuring data integrity, this approach could also be valuable in settings where it is not possible or not desired to apply automated analysis methods like the SPADE or viSNE algorithms (10,11). In particular, mass cytometry panels designed to characterize functional properties of cells (such as exhaustion or activation markers) rather than phenotyping of distinct cell lineages often include antibodies against markers that are expressed at low or variable levels (e.g., PD-1, CD160, CD38), leading to a low separation of the negative and positive populations and low resolution in SPADE or viSNE analyses. Reference PBMCs, however, allowed us to apply consistent gating for those populations. This method could ultimately lead to additional automatic algorithms based on reference samples, which would further increase applicability of mass cytometry technology in the future.
Given the potential number of antibodies in mass cytometry panels, antibody and panel validation are additional issues that could be addressed more easily with the proposed method. Typical flow cytometry panels with six- to eight colors usually include additional negative controls such as FMOs in every experiment, which is hardly applicable to mass cytometry panels with >35 markers on average. Flow cytometry studies also usually include only few antibodies against unknown or less well studied markers. For mass cytometry screening studies, especially for identification of potential new biomarkers, the number of less commonly used antibodies is likely to increase as CyTOF becomes more widely used. Additionally, expression patterns can vary significantly between different compartments, as demonstrated in the experiments comparing TNFα-expression in T cells from peripheral blood and BAL. Including a single reference sample could facilitate the validation process of newly identified targets or in less well studied body compartments, thereby increasing the interpretability of biomarker screens using mass cytometry. Furthermore, given that mass cytometry is still a comparably young technology, large panels still require (and probably will in the foreseeable future due to the countless possible antibody-metal combinations) some in-house conjugations of antibodies. Reference samples could be utilized as a straightforward method for titration and validation of these antibody batches.
In order to adapt the proposed reference sample approach to future mass cytometry studies, we suggest following workflow: 1) Selection of an appropriate reference sample, ideally from a cell type similar to the prospective patient samples in the study, but as shown in our BAL experiments, peripheral blood might also be used for other sample types, 2) validation of the CyTOF panel using the presumptive reference sample. At this point, positive and negative populations within this sample should be identified for future analysis and for validation of antibody staining. If there are markers included in the panel where no clear expression differences can be determined within this reference sample (like for Ki-67 and CD69 in this study), additional steps should be taken before starting with experiments using patient material (e.g., different donor, patient cells instead of cells from healthy donor, in vitro stimulation of cells, cells from a different compartment, if available), 3) running experiments with patient samples, spiked with the validated reference sample.
One caveat of our reference sample approach is the limited availability of any given biological sample. Although our reference samples, derived from buffy coats of healthy blood donors yielded a sufficient number of cells to last for about 50 individual experiments, larger studies might need additional approaches to obtain larger batches of a given reference sample. We have not experienced this issue in our own studies yet, but one strategy could be to initially combine cells from several reference donors to achieve a larger number of aliquots to be stored. In this context, a good estimate of the number of experiments needed to complete the study as well as the identification of an appropriate source for the reference sample will be crucial during the study planning phase. Another approach might be transferring experiments and gating strategies to another reference sample batch by running a comparison experiment with the old and new reference batch, comparably to using different lots of Rainbow Calibration Beads in flow cytometry.
Beyond human studies, this protocol could potentially also be adapted to murine (and other animal) studies. Given the lower blood volume of mice, an obstacle here would be to gain a large enough number of cells to serve as reference. One option could be to pool cells from several mice with identical genetic background (e.g., BALB/c or C57BL/6) to yield enough reference cells. It is yet to be determined if this approach would be transferable to murine experiments in this way, but it could be promising for standardization of future mouse experiments utilizing mass cytometry.
We conclude that the reference sample method we propose here could facilitate quality control and data analysis of future mass cytometry studies. Furthermore, we anticipate that this method could be adapted to a range of mass cytometry-based studies and could, in concert with previously described normalization approaches (4,12,28), support standardization of these complex single cell assays. This approach could significantly enhance applicability of mass cytometry technology as a discovery and screening tool, especially in the field of biomarker screening and cell phenotyping, where negative controls are often widely lacking.
Supplementary Material
Acknowledgments
The authors thank all the patients and donors for their contribution to this study; C. Palmer for critical reading of this manuscript and continuous discussion; I. Toth and the technicians of the Ragon Institute Processing Lab for processing patient specimens, M. Waring for technical support and the other members of the Ragon Institute for continuous discussion, support and input. NR is currently a full time employee of Fluidigm Corporation, the manufacturer of the mass cytometer used in this study.
Grant sponsor: U.S. National Institutes of Health (NIH) Scripps Center for HIV/AIDS Vaccine Immunology and Immunogen Discovery grant (CHAVI-ID), Grant number: 1UM1-AI100663
Grant sponsor: Harvard University Center for AIDS Research (CFAR), an NIH-funded program (P30 AI060354) which is supported by NIH co-funding and participating institutes and centers, including the NIAID, NCI, NICHD, NHLBI, NIDA, NIMH, NIA, FIC, and OAR
Grant sponsor: U.S. National Institute of Allergy and Infectious Diseases, Grant number: 5U01HL121827-03
Grant sponsor: European Research Council Marie Curie fellowship, Grant number: 628359
Footnotes
Author Contributions
KK, BC, NR, NN, AL, and JLC performed the experiments, KK, BC, and NR analyzed the data, KK and BDW designed the study and wrote the manuscript, JLC and BDM coordinated the lung study and obtained BAL from HIV-infected patients. BDW and DK supervised the research and provided critical support.
Additional Supporting Information may be found in the online version of this article.
Literature Cited
- 1.Bandura DR, Baranov VI, Ornatsky OI, Antonov A, Kinach R, Lou X, Pavlov S, Vorobiev S, Dick JE, Tanner SD. Mass cytometry: Technique for real time single cell multitarget immunoassay based on inductively coupled plasma time-of-flight mass spectrometry. Anal Chem. 2009;81:6813–6822. doi: 10.1021/ac901049w. [DOI] [PubMed] [Google Scholar]
- 2.Ornatsky O, Baranov VI, Bandura DR, Tanner SD, Dick J. Multiple cellular antigen detection by ICP-MS. J Immunol Methods. 2006;308:68–76. doi: 10.1016/j.jim.2005.09.020. [DOI] [PubMed] [Google Scholar]
- 3.Bendall SC, Nolan GP, Roederer M, Chattopadhyay PK. A deep profiler’s guide to cytometry. Trends Immunol. 2012;33:323–332. doi: 10.1016/j.it.2012.02.010. [DOI] [PMC free article] [PubMed] [Google Scholar]
- 4.Zunder ER, Finck R, Behbehani GK, Amir E-AD, Krishnaswamy S, Gonzalez VD, Lorang CG, Bjornson Z, Spitzer MH, Bodenmiller B, et al. Palladium-based mass tag cell barcoding witha doublet-filtering scheme and single-celldeconvolution algorithm. Nat Protoc. 2015;10:316–333. doi: 10.1038/nprot.2015.020. [DOI] [PMC free article] [PubMed] [Google Scholar]
- 5.Bendall SC, Simonds EF, Qiu P, Amir EAD, Krutzik PO, Finck R, Bruggner RV, Melamed R, Trejo A, Ornatsky OI, et al. Single-cell mass cytometry of differential immune and drug responses across a human hematopoietic continuum. Science. 2011;332:687–696. doi: 10.1126/science.1198704. [DOI] [PMC free article] [PubMed] [Google Scholar]
- 6.Chattopadhyay PK, Gierahn TM, Roederer M, Love JC. Single-cell technologies for monitoring immune systems. Nature Immunology. 2014;15:128–135. doi: 10.1038/ni.2796. [DOI] [PMC free article] [PubMed] [Google Scholar]
- 7.Catena R, Ozcan A, Zivanovic N, Bodenmiller B. Enhanced multiplexing in mass cytometry using osmium and ruthenium tetroxide species. Cytometry A. 2016;89A:491–497. doi: 10.1002/cyto.a.22848. [DOI] [PubMed] [Google Scholar]
- 8.Chattopadhyay PK, Roederer M. A mine is a terrible thing to waste: High content, single cell technologies for comprehensive immune analysis. Am J Transplant. 2015;15:1155–1161. doi: 10.1111/ajt.13193. [DOI] [PubMed] [Google Scholar]
- 9.Perfetto SP, Chattopadhyay PK, Roederer M. Seventeen-colour flow cytometry: Unravelling the immune system. Nat Rev Immunol. 2004;4:648–655. doi: 10.1038/nri1416. [DOI] [PubMed] [Google Scholar]
- 10.Simonds EF, Bendall SC, Gibbs KD, Bruggner RV, Linderman MD, Sachs K, Nolan GP, Plevritis SK, Qiu P. Extracting a cellular hierarchy from high-dimensional cytometry data with SPADE. Nat Biotechnol. 2011;29:886–891. doi: 10.1038/nbt.1991. [DOI] [PMC free article] [PubMed] [Google Scholar]
- 11.Amir E-AD, Davis KL, Tadmor MD, Simonds EF, Levine JH, Bendall SC, Shenfeld DK, Krishnaswamy S, Nolan GP, Pe’er D. viSNE enables visualization of high dimensional single-cell data and reveals phenotypic heterogeneity of leukemia. Nat Biotechnol. 2013;31:545–552. doi: 10.1038/nbt.2594. [DOI] [PMC free article] [PubMed] [Google Scholar]
- 12.Finck R, Simonds EF, Jager A, Krishnaswamy S, Sachs K, Fantl W, Pe’er D, Nolan GP, Bendall SC. Normalization of mass cytometry data with bead standards. Cytometry A. 2013;83A:483–494. doi: 10.1002/cyto.a.22271. [DOI] [PMC free article] [PubMed] [Google Scholar]
- 13.Mei HE, Leipold MD, Schulz AR, Chester C, Maecker HT. Barcoding of live human peripheral blood mononuclear cells for multiplexed mass cytometry. J Immunol. 2015;194:2022–2031. doi: 10.4049/jimmunol.1402661. [DOI] [PMC free article] [PubMed] [Google Scholar]
- 14.Day CL, Kaufmann DE, Kiepiela P, Brown JA, Moodley ES, Reddy S, Mackey EW, Miller JD, Leslie AJ, DePierres C, et al. PD-1 expression on HIV-specific T cells is associated with T-cell exhaustion and disease progression. Nature. 2006;443:350–354. doi: 10.1038/nature05115. [DOI] [PubMed] [Google Scholar]
- 15.Trautmann L, Janbazian L, Chomont N, Said EA, Gimmig S, Bessette B, Boulassel MR, Delwart E, Sepulveda H, Balderas RS, et al. Upregulation of PD-1 expression on HIV-specific CD8+ T cells leads to reversible immune dysfunction. Nat Med. 2006;12:1198–1202. doi: 10.1038/nm1482. [DOI] [PubMed] [Google Scholar]
- 16.Yamamoto T, Price DA, Casazza JP, Ferrari G, Nason M, Chattopadhyay PK, Roederer M, Gostick E, Katsikis PD, Douek DC, et al. Surface expression patterns of negative regulatory molecules identify determinants of virus-specific CD8+ T-cell exhaustion in HIV infection. Blood. 2011;117:4805–4815. doi: 10.1182/blood-2010-11-317297. [DOI] [PMC free article] [PubMed] [Google Scholar]
- 17.Peretz Y, He Z, Shi Y, Yassine-Diab B, Goulet J-P, Bordi R, Filali-Mouhim A, Loubert J-B, El-Far M, Dupuy FP, et al. CD160 and PD-1 Co-expression on HIV-specific CD8 T cells defines a subset with advanced dysfunction. PLoS Pathog. 2012;8:e1002840. doi: 10.1371/journal.ppat.1002840. [DOI] [PMC free article] [PubMed] [Google Scholar]
- 18.Viganò S, Bellutti Enders F, Miconnet I, Cellerai C, Savoye A-L, Rozot V, Perreau M, Faouzi M, Ohmiti K, Cavassini M, et al. Rapid perturbation in viremia levels drives increases in functional avidity of HIV-specific CD8 T cells. PLoS Pathog. 2013;9:e1003423. doi: 10.1371/journal.ppat.1003423. [DOI] [PMC free article] [PubMed] [Google Scholar]
- 19.Porichis F, Kwon DS, Zupkosky J, Tighe DP, McMullen A, Brockman MA, Pavlik DF, Rodriguez-Garcia M, Pereyra F, Freeman GJ, et al. Responsiveness of HIV-specific CD4 T cells to PD-1 blockade. Blood. 2011;118:965–974. doi: 10.1182/blood-2010-12-328070. [DOI] [PMC free article] [PubMed] [Google Scholar]
- 20.Cordone I, Matutes E, Catovsky D. Characterisation of normal peripheral blood cells in cycle identified by monoclonal antibody Ki-67. J Clin Pathol. 1992;45:201–205. doi: 10.1136/jcp.45.3.201. [DOI] [PMC free article] [PubMed] [Google Scholar]
- 21.Li X, Miao H, Henn A, Topham DJ, Wu H, Zand MS, Mosmann TR. Ki-67 expression reveals strong, transient influenza specific CD4 T cell responses after adult vaccination. Vaccine. 2012;30:4581–4584. doi: 10.1016/j.vaccine.2012.04.059. [DOI] [PMC free article] [PubMed] [Google Scholar]
- 22.Bendall SC, Davis KL, Amir E-AD, Tadmor MD, Simonds EF, Chen TJ, Shenfeld DK, Nolan GP, Pe’er D. Single-cell trajectory detectionuncovers progression and regulatory coordination in human B cell development. Cell. 2014;157:714–725. doi: 10.1016/j.cell.2014.04.005. [DOI] [PMC free article] [PubMed] [Google Scholar]
- 23.Newell EW, Sigal N, Bendall SC, Nolan GP, Davis MM. Cytometry by time-of-flight shows combinatorial cytokine expression and virus-specific cell niches within a continuum of CD8+ T cell phenotypes. Immunity. 2012;36:142–152. doi: 10.1016/j.immuni.2012.01.002. [DOI] [PMC free article] [PubMed] [Google Scholar]
- 24.Becher B, Schlitzer A, Chen J, Mair F, Sumatoh HR, Teng KWW, Low D, Ruedl C, Riccardi-Castagnoli P, Poidinger M, et al. High-dimensional analysis of the murine myeloid cell system. Nature Immunology. 2014;15:1181–1189. doi: 10.1038/ni.3006. [DOI] [PubMed] [Google Scholar]
- 25.Kozera B, Rapacz M. Reference genes in real-time PCR. J Appl Genet. 2013;54:391–406. doi: 10.1007/s13353-013-0173-x. [DOI] [PMC free article] [PubMed] [Google Scholar]
- 26.Neff CP, Chain JL, MaWhinney S, Martin AK, Linderman DJ, Flores SC, Campbell TB, Palmer BE, Fontenot AP. Lymphocytic alveolitis is associated with the accumulation of functionally impaired HIV-specific T cells in the lung of antiretroviral therapy—Naive subjects. Am J Respir Crit Care Med. 2015;191:464–473. doi: 10.1164/rccm.201408-1521OC. [DOI] [PMC free article] [PubMed] [Google Scholar]
- 27.Mitchell AJ, Pradel LC, Chasson L, Van Rooijen N, Grau GE, Hunt NH, Chimini G. Technical advance: Autofluorescence as a tool for myeloid cell analysis. J Leuk Biol. 2010;88:597–603. doi: 10.1189/jlb.0310184. [DOI] [PubMed] [Google Scholar]
- 28.Tricot S, Meyrand M, Sammicheli C, Elhmouzi-Younes J, Corneau A, Bertholet S, Malissen ML, Grand R, Nuti S, Luche H, et al. Evaluating the efficiency of isotope transmission for improved panel design and a comparison of the detection sensitivities of mass cytometer instruments. Cytometry A. 2015;87A:357–368. doi: 10.1002/cyto.a.22648. [DOI] [PubMed] [Google Scholar]
Associated Data
This section collects any data citations, data availability statements, or supplementary materials included in this article.