Abstract
Alzheimer’s disease (AD), a debilitating neurodegenerative illness, is characterized by neuronal cell loss, mental deficits, and abnormalities in several neurotransmitter and protein systems. AD is also associated with visual disturbances, but their causes remain unidentified. We hypothesize that the visual disturbances stem from retinal changes, particularly changes in the retinal cholinergic system, and that the etiology in the retina parallels the etiology in the rest of the brain. To test our hypothesis, quantitative polymerase chain reaction (qPCR) and immunohistochemistry (IHC) were employed to assess changes in acetylcholine receptor (AChR) gene expression, number of retinal cells, and astrocytic gliosis in the Tg-SwDI mouse model as compared to age-matched wild type (WT). We observed that Tg-SwDI mice showed an initial upregulation of AChR gene expression early on (young adults and middle age adults), but a downregulation later on (old adults). Furthermore, transgenic animals displayed significant cell loss in the photoreceptor layer and inner retina of the young adult animals, as well as specific cholinergic cell loss, and increased astrocytic gliosis in the middle age adult and old adult groups. Our results suggest that the changes observed in AD cerebrum are also present in the retina and may be, at least in part, responsible for the visual deficits associated with the disease.
Keywords: Alzheimer’s disease, qPCR, histology, retinal cholinergic system, vision, amyloid precursor protein mutation
Alzheimer’s disease (AD) is a debilitating neurodegenerative disorder that affects over 26 million people worldwide and the incidence is projected to quadruple by the year 2050 (Tsai et al., 2014). According to the Alzheimer’s Association, in 2015 there were 5.3 million Americans suffering from AD. It is characterized by circadian rhythm dysfunction and the development of multiple cognitive deficits, including memory loss, confusion, apraxia, aphasia and agnosia (American Psychiatric Association, 2013; La Morgia et al., 2015).
AD is marked by the accumulation of neurofibrillary tangles (aggregates of hyper-phosphorylated tau protein), deposition of amyloid beta (Aβ) plaques, gliosis, and substantial neuronal and synaptic loss (Fodero et al., 2004). The pathophysiology of AD is extremely intricate and involves several biochemical pathways. These include defective Aβ protein metabolism and abnormalities of several neurotransmitter systems, particularly the cholinergic and glutamatergic systems (Doraiswamy, 2002; Francis et al., 2012).
In addition to cognitive decline and cortical changes, AD is also characterized by visual dysfunction ranging from simple (e.g. color discrimination) to complex (e.g. object recognition), including deficits in motion perception, contrast sensitivity, stereopsis, temporal resolution, acuity, color, and lower critical flicker fusion threshold (Cronin-Golomb et al., 1995; Rizzo et al., 2000). In 1906, Alois Alzheimer was the first to report the occurrence of visual disturbances in one of his patients Auguste D (Maurer et al., 1997; Kusne et al., 2016).
Visual deficits have been reported in the early stages of the disease, even before AD diagnosis is clearly established (Cronin-Golomb et al., 1991; Uhlmann et al., 1991). The effects of AD on visual attention and other higher visual functions can negatively impact one’s quotidian activities such as reading, route finding, object localization and recognition (Rizzo et al., 2000). To date, the underlying causes of these visual dysfunctions and whether they stem from retinal or cortical abnormalities remain poorly understood (Tsai et al., 2014).
The excitatory neurotransmitter acetylcholine (ACh) plays a crucial role in myriad cognitive functions, including learning and memory; both of which are negatively impacted by AD. In the brain, ACh is released by cholinergic neurons and can bind to two different acetylcholine receptor (AChR) subtypes: nicotinics (nAChRs) and muscarinics (mAChRs), which are ionotropic and metabotropic receptors, respectively (Oddo and LaFerla, 2006). In early AD, there is impairment in hippocampus-based episodic memory that is improved through enhancement of cholinergic transmission (Hernandez et al., 2010).
In the retina, ACh is synthesized and released by starburst amacrine cells (Masland, 1980). Release of ACh is both tonic and light-evoked (Masland, 1980). AChRs are expressed by photoreceptor, bipolar, amacrine, displaced amacrine, horizontal and ganglion cells in several different species (Dmitrieva et al., 2007; Strang et al., 2007, 2010; Cimini et al., 2008; Smith et al., 2014). AChR activation has been shown to play a role in retinal development (Stacy et al., 2005; Sun et al., 2008; Ford and Feller, 2012) and affect ganglion cell responses (Schmidt et al., 1987; Kittila and Massey, 1997; Strang et al., 2005, 2007, 2010, 2015).
The main animal models of AD were designed to mimic the autosomal dominant mutations observed in hereditary early onset Alzheimer’s. These models express mutations in amyloid precursor protein (APP) and/or in the presenilin proteins (PSEN1 and PSEN2). All of the identified mutations that cause autosomal dominant AD directly alter the production of Aβ through APP processing. APP is a type I transmembrane protein with a large amino-terminal extracellular domain (Hall and Roberson, 2013). Aβ is a peptide that stems from the cleavage of APP by the enzymes β-secretase and Y-secretase, which is composed of presenilin and other components (De Strooper et al., 1998; Edbauer et al., 2003).
Male and female transgenic Swedish, Dutch and Iowa (Tg-SwDI) mice were used for this study. These mice express the human APP, isoform 770, with the Swedish APP K670N/M671L, Dutch E693Q, and Iowa D694N mutations driven by the mouse Thy1 promoter (Murrell et al., 1991). The Dutch and Iowa are missense mutations that occur on exon 17. In the Dutch APP E693Q mutation, glutamic acid (GAA) is replaced by glutamine (CAA) (Levy et al., 1990).
The Dutch mutation leads to cell death and loss of vessel wall integrity (Wisniewski et al., 1991), and is associated with severe Aβ deposition in cerebral vessels, hemorrhages, and diffuse plaques in brain parenchyma (Timmers et al., 1990). The Iowa APP D694N mutation is characterized by the substitution of aspartic acid (GAT) by asparagine (AAT) (Grabowski et al., 2001). The Dutch and Iowa mutations occur within Aβ and result in increased resistance to proteolysis (Hall and Roberson, 2013). The Swedish APP K670N/M671L is a double mutation at the β-secretase cleavage site (Hall and Roberson, 2013), on exon 16, in which lysine (AAG) and methionine (AAT) are replaced by asparagine (AAT) and leucine (CTG) (Mullan et al., 1992). This mutation results in increased Aβ40 and Aβ42 (the more toxic form) production (Hall and Roberson, 2013).
In the Tg-SwDI mice, Aβ accumulation in the cerebrum is extensive by 12 months (Van Vickle et al., 2008). These mice show impaired learning and memory in the Barnes maze task as early as 3 months of age (Xu et al., 2007). At 6 months of age, these mice start developing gliosis with a prominent increase in the number of glial fibrillary acidic protein (GFAP) positive astrocytes in several brain regions (Miao et al., 2005).
Little is known about the retinal cholinergic system in many of the AD animal models and whether they display retinal abnormalities. Because these retinal changes may parallel AD etiology in the brain and precede severe cognitive impairment, they may be instrumental in the early diagnosis of AD. Thus, in the current study we assessed whether the AD-related changes in the retina are analogous to the alterations reported in the rest of the brain and identified possible causes for visual dysfunction by quantifying AChR gene expression, cholinergic cell count, total retinal cell count and astrocytic gliosis in Tg-SwDI mice as compared to wild-type (WT). The Tg-SwDI mice showed a decrease in the number of retinal cells, gliosis and alterations in AChRs expression.
Experimental Procedures
All animals were maintained in accordance with the National Institute of Health Guide for the Care and Use of Laboratory Animals (NIH Publications No. 80-23, revised 1996), the Global Statement on the Use of Animals in Research (Federation of European Neuroscience Societies, Japan Neuroscience Society, International Brain Research Organization and Society for Neuroscience) and protocols approved by the University of Alabama at Birmingham Institutional Animal Care and Use Committee. The eyes of male and female transgenic animals, and age-matched male and female WT animals were harvested immediately following euthanasia. All graphs were generated with GraphPad Prism 6 (Graph Pad Prism, La Jolla CA) and histological representations (figures 3 and 8) were created with Adobe Photoshop CS2 (Adobe Systems, Mountain View, CA). Cartoon figures 1 and 9 were made with Microsoft PowerPoint (Microsoft Corporation, Redmont, WA) and Servier Medical Art PowerPoint Image Bank with modifications (Creative Common Attributions 3.0 Unported license; www.creativecommons.org/licenses/by/3.0/legalcode).
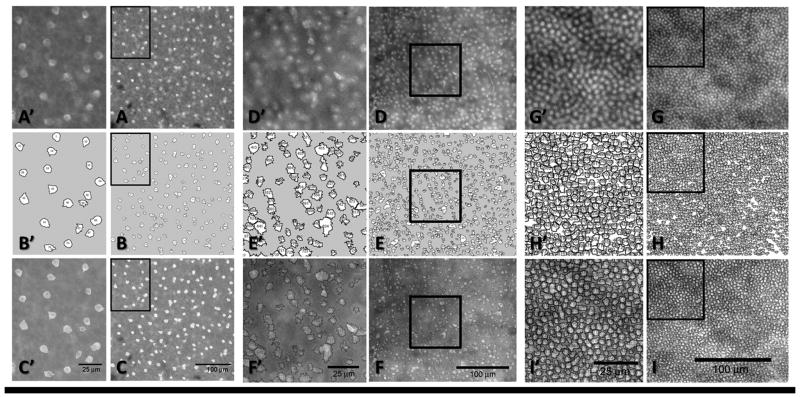
Figure 3.
Histological representation of semi-automated cell counts performed in Image J in a Tg-SwDI mouse in the INL (ChAT) (A–C), GCL (Hoescht) (D–F) & ONL (Hoescht) (G–I). Panels A’–I’ are the increased magnification of the black rectangles in panels A–I.
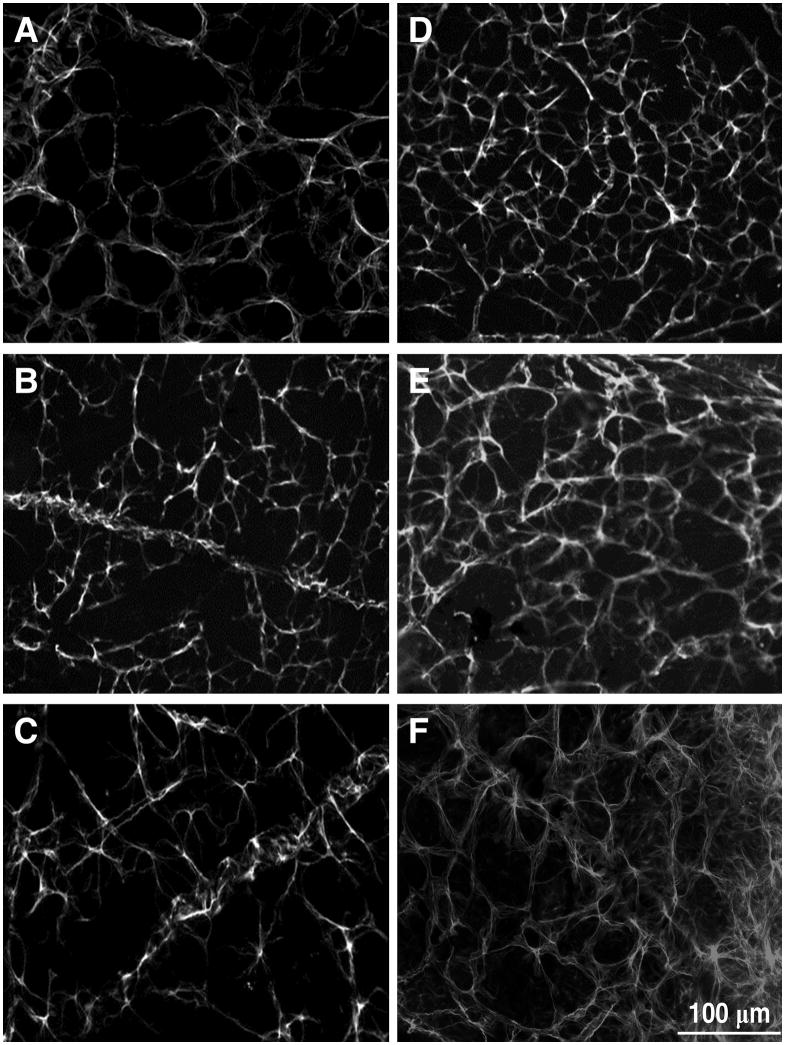
Figure 8.
Tg-SwDI (D–F) showed significantly more gliosis than WT (A–C) in the middle age adult and the old adult groups. Panels A and D (young adults), B and E (middle age adults), C and F (old adults). Scale bar 100 μm.
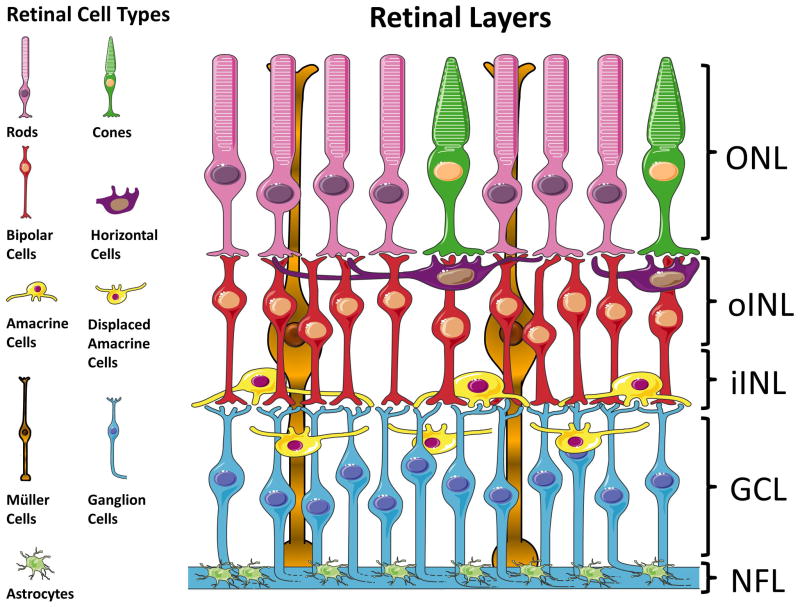
Figure 1.
Retinal layers and cell types. This cartoon shows the cells types contained in each retinal nuclear layer. The labels on the right correspond to the layers imaged for cell count and astrocytic gliosis. ONL= photoreceptor cell bodies. oINL= horizontal and bipolar cell bodies. iINL= amacrine cells, including the population of cholinergic amacrine cells. GCL= ganglion cells and displaced amacrine cells, including the population of displaced cholinergic amacrine cells. NFL= astrocytes
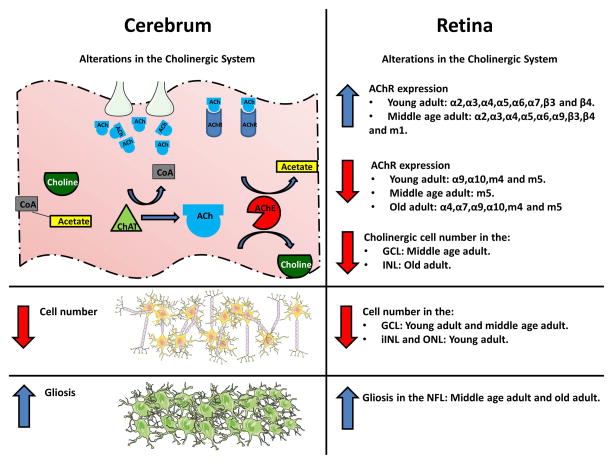
Figure 9.
The current study demonstrated that known, previously published (Doraiswamy, 2002; Francis et al., 2012, Fodero et al., 2004), AD-associated changes in the cerebrum (left) were also present in the retina (right). Transgenic animals showed dysregulation in the cholinergic system, cell loss and gliosis.
We characterized the retinal changes of male and female Tg-SwDI mice as compared to age-matched C57Bl6J WT in three age groups: young adult, 6.5 to 8 months old adult (mo) (WT mean age: 7.2 mo; Tg-SwDI mean age: 7.1 mo), middle age adult, 9 to 10 mo (WT mean age: 9.3 mo; Tg-SwDI mean age: 9 mo), and old adult, 14–15 mo (WT mean age: 14.6 mo; Tg-SwDI mean age: 14.2 mo). These ages are roughly comparable to human age groups and were chosen in order to ascertain age-related differences in AD pathology.
The following experiments were intended to answer this question: does the retina display the same AD-related changes observed in the rest of the brain: cholinergic system disturbances, cell loss and gliosis?
Quantitative polymerase chain reaction (qPCR)
qPCR was employed to identify alterations in the retinal cholinergic system by quantifying AChR expression. AChR RNA transcripts were measured using qPCR of RNA extracted from whole retina. Retinas for qPCR were dissected from the eyecup of mice immediately following euthanasia, flash frozen, and stored at -80°C. The RNAqueous -4PCR Kit (Ambion; Austin, TX) was used for RNA extraction and DNAse treatment per manufacturer’s protocol. RNA underwent reverse transcription using the iScript cDNA synthesis kit (BioRad; Hercules, CA). The resulting cDNA and previously designed and optimized primers (Smith et al., 2014) were then added to a SYBR® green supermix (100 mM KCl, 40 mM Tris-HCl, pH 8.4, 0.4 mM each dNTP, 50 U/ml iTaq™ DNA polymerase, 6 mM MgCl2, SYBR® Green I, 20 nM fluorescein) (BioRad; Hercules, CA) and amplified using a BioRad iQ5 real-time PCR detection system (BioRad; Hercules, CA). Matched cDNA concentrations and optimal primer conditions (concentration and annealing temperature) were used for all experiments. Gene expression was normalized to the ryanodine receptor as the housekeeping gene and quantified using the ΔΔCT method. Two-tailed independent t-tests were used to test the statistical significance (p<0.05) of fold changes. Non-template reactions were used as negative controls.
Immunohistochemistry (IHC)
IHC and fluorescence microscopy were used to determine whether AD-related changes, gliosis and cell loss, reported in the cerebrum are also evident in the retina. Retinas were obtained from WT and Tg-SwDI mice after euthanasia and fixed in 4% paraformaldehyde and processed as whole mounts as previously described (Smith et al., 2014). Images were collected with a Zeiss AxioPlan 2 fluorescent microscope equipped with an AxioCam HRm camera and filters: DAPI, FITC/GFP, TRITC/Cy3 and Cy5 (Carl Zeiss Microscopy LLC, Thornwood, NY). Each channel was scanned separately and saved as digital graphics files. Antibodies against choline acetyltransferase (ChAT) (EMD Millipore Cat# AB144P, RRID: AB_11214092) (cholinergic amacrine cells) and Hoechst nuclear dye (Thermo Fischer Scientific Cat# 33342) (total cell number) were used to identify cell populations in different retinal layers within eight demarcated regions of interest for statistical analysis. The layers in each of the regions of interest included the ganglion cell layer (GCL; ganglion cells and displaced amacrine cells), the inner and outer portions of the inner nuclear layer (iINL; amacrine cells and oINL; bipolar cells and horizontal cells) and in the outer nuclear layer (ONL; photoreceptors) (Fig. 1). Gliosis was assessed in the nerve fiber layer (NFL) with an antibody against GFAP (Dako Cat# Z0334, RRID: AB_10013382). In mammalian retinas, astrocytes are present solely in the vascular regions (Schnitzer, 1988) and mostly in the retinal NFL (Ramírez et al., 1996). Image J software was used for semi-automated cell counts and gliosis assessment (Kimbrough et al., 2015). Statistical significance (p<0.05) was assessed using two-tailed independent t-tests.
Results
qPCR: Tg-SwDI retinas had significant alterations in AChR gene expression in all age groups
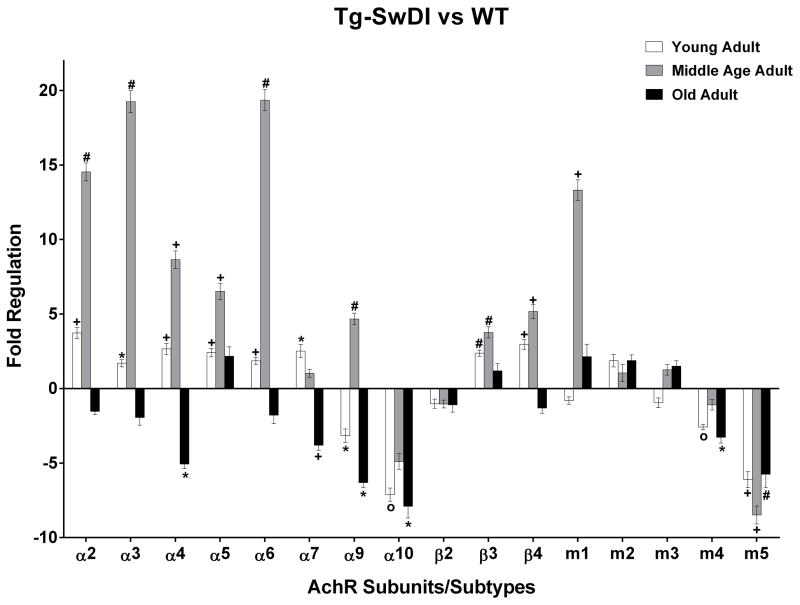
There were statistically significant differences in the expression of AChR transcripts in the Tg-SwDI mice retinas, as compared to WT, in all age groups. Table 1 shows the mean fold regulation ± standard error of mean (SEM) and exact p values for all AChR subunits/subtypes. Downregulation is shown in parentheses. The bars in figure 2 enable the graphic comparison of AChR regulation changes across all three age groups.
Table 1.
qPCR: Tg-SwDI as compared to WT.
| Young Adult | Middle Age Adult | Old Adult | ||||
|---|---|---|---|---|---|---|
| Mean± SEM | p Value | Mean± SEM | p Value | Mean± SEM | p Value | |
| α2 | 3.74±0.38 | 0.0018 | 14.54±0.60 | 0.0002 | (1.53)±0.22 | 0.5111 |
| α3 | 1.70±0.24 | 0.0327 | 19.26±0.74 | 0.0008 | (1.95)±0.51 | 0.2903 |
| α4 | 2.66±0.37 | 0.0130 | 8.65±0.59 | 0.0027 | (5.07)±0.32 | 0.0283 |
| α5 | 2.42±0.28 | 0.0043 | 6.53±0.55 | 0.0028 | 2.17±0.63 | 0.3395 |
| α6 | 1.87±0.23 | 0.0122 | 19.35±0.71 | 0.0003 | (1.79)±0.55 | 0.3960 |
| α7 | 2.52±0.43 | 0.0447 | 1.02±0.27 | 0.9341 | (3.81)±0.33 | 0.0082 |
| α9 | (3.16)±0.45 | 0.0215 | 4.67±0.38 | 0.0005 | (6.30)±0.36 | 0.0266 |
| α10 | (7.12)±0.44 | <0.0001 | (4.90)±0.54 | 0.0073 | (7.90)±0.79 | 0.0278 |
| β2 | (1.02)±0.30 | 0.9516 | (1.04)±0.26 | 0.8908 | (1.09)±0.49 | 0.9037 |
| β3 | 2.38±0.21 | 0.0003 | 3.77±0.37 | 0.0012 | 1.19±0.48 | 0.6641 |
| β4 | 2.96±0.33 | 0.0024 | 5.17±0.47 | 0.0045 | (1.31)±0.35 | 0.7307 |
| m1 | 1.24±0.26 | 0.4139 | 13.32±0.69 | 0.0023 | 2.14±0.83 | 0.2053 |
| m2 | 1.87±0.42 | 0.1451 | 1.05±0.58 | 0.9305 | 1.88±0.38 | 0.4115 |
| m3 | 1.05±0.33 | 0.8854 | 1.26±0.35 | 0.5177 | 1.51±0.36 | 0.5142 |
| m4 | (2.58)±0.18 | <0.0001 | (1.09)±0.35 | 0.7957 | (3.26)±0.40 | 0.0416 |
| m5 | (6.11)±0.54 | 0.0029 | (8.48)±0.60 | 0.0024 | (5.75)±0.91 | 0.0007 |
Figure 2.
AChR gene expression. Young adults: Tg-SwDI (n=17) when compared to age-matched WT (n=18), displayed upregulation in several AChR genes and downregulation in α9 and α 10 nAchR and m4 and m5 mAChR. Middle age adults: Tg-SwDI (n=11) exhibited substantial upregulation in several AChR genes and downregulation in α10 nAchR and m5 mAChR, as compared to age-matched WT (n=9). Old adults: Tg-SwDI (n=15) revealed downregulation in several AChR genes, as compared to age-matched WT (n=12). (*) p<0.05; (+) p<0.01; (#) p<0.001; (o) p<0.0001. Error bars represent SEM.
In the young adult Tg-SwDI (Fig. 2; Table 1), there was upregulation of several nAChR subunit transcripts: α2, α3, α4, α5, α6, α7, β3 and β4. There was also downregulation in nAChR subunit transcripts α9 and α10, as well as m4 and m5 mAChR transcripts. In the middle age adult Tg-SwDI (Fig. 2; Table 1) there was greater upregulation in many of the same nAChR subunit transcripts including α2, α3, α4, α5, α6, β3 and β4. However, α7 was no longer significantly upregulated while α9 nAChR and m1 mAChR transcripts were strongly upregulated. Transcripts for α10 nAChR subunits and m5 mAChRs remained downregulated. In the old adult Tg-SwDI (Fig. 2; Table 1), no significant upregulation of any cholinergic receptor was evident. Instead, there was downregulation of α4, α7, α9, and α10 nAChR subunit transcripts, as well as in m4 and m5 mAChR transcripts.
IHC: Tg-SwDI retinas had fewer cells in several layers and significantly increased gliosis in the NFL
ImageJ was used in defined regions of interest for cell counts in each retinal layer and to measure GFAP area (percentage). The drawings were mapped back onto the original digital images to confirm accuracy (Fig. 3). The transgenic retinas displayed significant cell loss that differed across age groups. All of the IHC data are shown in parentheses as the mean number of cells per mm2 for cell count, or as the mean GFAP percentage area, ± SEM and exact p-value for Tg-SwDI vs WT.
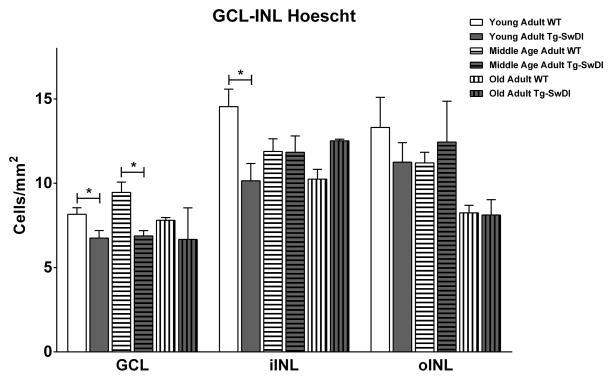
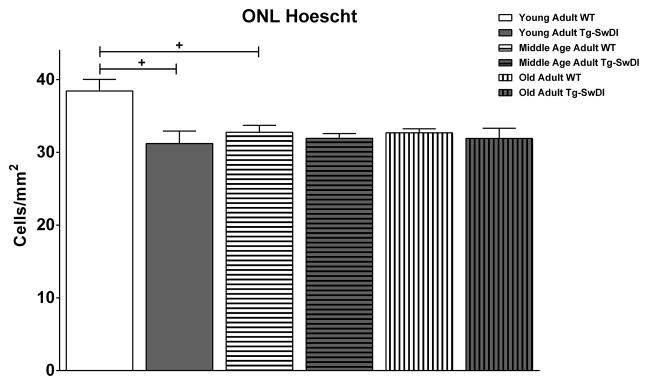
Tg-SwDI mice displayed reduced number of total cells in the GCL in young adults (6.75 ± 0.45 vs 8.16 ± 0.39, p= 0.0318) and middle age adults (6.88 ± 0.31 vs 9.46 ± 0.6, p= 0.0169), that was no longer evident in the old adults (Fig. 4). There were no differences in the number of cells in the oINL in any age group. Additionally, Tg-SwDI mice displayed reduced cell count in the iINL (10.15± 1.02 vs 14.55 ± 1.03, p= 0.0118) (Fig. 4) and ONL (31.21 ± 1.71 vs 38.44 ± 1.59, p= 0.0079) (Fig. 5) that was evident only in the young adult group.
Figure 4.
Tg-SwDI showed a reduced total number of cells per mm2 in the GCL in the young adult [Tg-SwDI (n=72); WT (n=56)] and middle age adult [Tg-SwDI (n=56); WT (n=48)] groups and iINL in the young adult group [Tg-SwDI (n=72); WT (n=56)]. (*) p<0.05. Error bars represent SEM.
Figure 5.
Tg-SwDI showed a reduced total number of cells per mm2 in the ONL in the young adult group [Tg-SwDI (n=72); WT (n=56)]; (+) p<0.01. Error bars represent SEM.
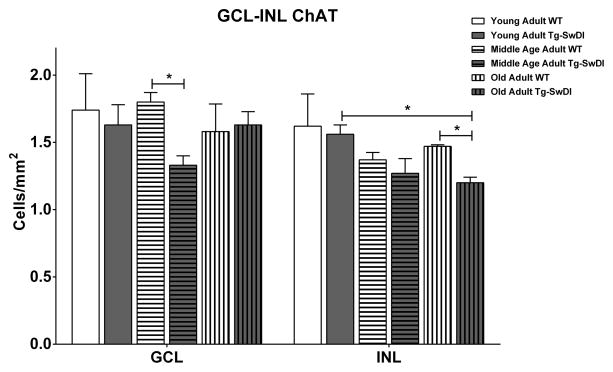
In the Tg-SwDI mice, the specific loss of retinal cholinergic cells occurred after loss of non-cholinergic cells. Significant cholinergic cell loss occurred in the GCL in the middle age adult group (1.33 ± 0.07 vs 1.80 ± 0.07, p= 0.0133) but was not apparent in the INL until after 14 months of age (1.20 ± 0.04 vs 1.47 ± 0.01, p= 0.0244) (Fig. 6).
Figure 6.
Tg-SwDI, as compared to age-matched WT, had fewer cholinergic cells per mm2 in the GCL in the middle age adult group [Tg-SwDI (n=42); WT (n=42)] and INL in the old adult group [Tg-SwDI (n=24); WT (n=24)]. (*) p<0.05. Error bars represent SEM.
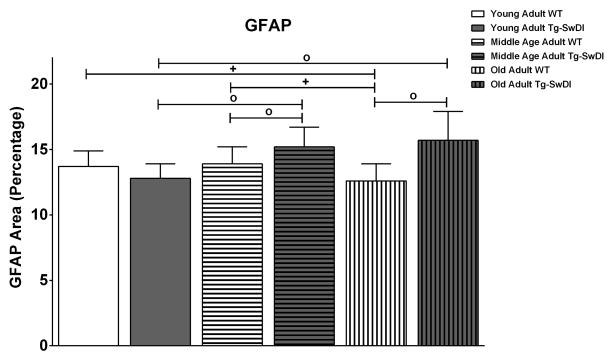
Except for young adults, Tg-SwDI mice displayed astrocytic gliosis in the NFL, demonstrated by a larger GFAP area than WT animals (Fig. 7): middle age adults (15.20 ± 1.50 vs 13.90 ± 1.30, p< 0.0001) and old adults (15.70 ± 2.20 vs 12.60 ± 1.30, p< 0.0001). Conversely, WT mice exhibited age-dependent reduction in the retina’s percentage area exhibiting GFAP- immunoreactivity between the young adult and old adult groups (13.70 ± 1.20 vs 12.60 ± 1.30, p= 0.0197) and between the middle age adult and old adult groups (13.90 ± 1.30 vs 12.60 ± 1.30, p= 0.0020). Figure 8 shows representative regions of GFAP immunoreactivity from WT (left column) and Tg-SwDI (right column) mice for each group: young adults (A and D), middle age adults (B and E) and old adults (C and F).
Figure 7.
Tg-SwDI had more gliosis, larger GFAP area (percentage), than WT in the middle age adult [Tg-SwDI (n=58); WT (n=60)] and old adult [Tg-SwDI (n=16); WT (n=24)] groups. (*) p<0.05; (+) p<0.01; (o) p<0.0001. Error bars represent SEM.
Discussion
The present study revealed for the first time that the retinal alterations in this mouse model of AD are similar to the AD-associated changes previously reported in the rest of the brain (Fig. 9): cell loss, gliosis, and disturbances in the cholinergic system (Doraiswamy, 2002; Fodero et al., 2004; Francis et al., 2012). There was an initial upregulation in the expression of several AChRs genes in young adult Tg-SwDI that considerably increased in the middle age adults. These genes were downregulated in the old adult animals. These data are consistent with reports of compensatory regulation of AChRs in mouse retina (Smith et al., 2014) and with initial cholinergic neuroprotection in AD (Teaktong et al., 2003, 2004; Chu et al., 2005; D’Andrea and Nagele, 2006).
The activation of α7 nAChR attenuates Aβ toxicity, promotes cholinergic integrity, and can improve synaptic plasticity, cognition and neuronal survival by activating phosphoinositide-3 kinase (Hernandez et al., 2010; Echeverria and Zeitlin, 2012). Thus, in early AD, α7 activation may provide neuroprotection. However, the activation of nAChRs results in a significant increase in tau phosphorylation, while mAChR activation may prevent it (Schliebs and Arendt, 2006). m1 activation is involved in the regulation of APP (Cowburn et al., 1996), while m2 mAChR activation may influence the modulation of tau and other proteins involved in AD (Hérnandez-Hérnandez et al., 1995). Thus, the upregulation of AChR subunits/subtypes in the retinas of younger animals, as a result of AD, may be part of a compensatory mechanism that attempts to mitigate the detrimental effects from the loss of non-cholinergic cells in the GCL and INL of the young adult animals. The upregulation of AChRs prior to loss of cholinergic cells suggests disruption of cholinergic function, although there is no loss of cholinergic cells in the young adult animals. Nonetheless, with increasing age and disease severity, this compensation can no longer attenuate the detrimental effects, especially the loss of cholinergic cells, produced by AD.
Cholinergic cell loss occurred in the GCL in the middle age adult group, but was no longer evident in old adults; however, these old adults displayed decreased numbers of cholinergic cells in the INL. The loss of cholinergic cells in the middle age adults and old adults is consistent with the course of AD in the cerebrum which also includes reduction in synaptic markers, such as ChAT and [3H] hemicholinium-3 binding, levels of ChAT activity, ACh synthesis, AChR binding, and high-affinity choline uptake (Slotkin et al., 2001; Schliebs and Arendt, 2006; Francis et al., 2012).
GFAP-immunoreactivity in the NFL of transgenic mice increased not only relative to WT retinas, but was also higher in the old adults relative to the young adults and middle age adults, which suggests that the AD-dependent gliosis is an age-related phenomenon. WT animals also exhibited age-related differences between the young adult and old adult groups, but for WT animals there was a reduction in astrocytic gliosis with increasing age. Taken together, AD plays a pivotal role in exacerbating gliosis in an age-dependent manner.
Our results indicate that the retinal cholinergic system alterations, gliosis and the reduction in retinal cell number may be, in part, responsible for the visual deficits that occur in AD. These data highlight the crucial role of the cholinergic system in AD pathology. Because of ACh’s essential involvement in visual processing in healthy retinas (Schmidt et al., 1987; Kittila and Massey, 1997; Strang et al., 2005, 2007, 2010, 2015; Varghese et al., 2011), characterizing the AD-related changes in the retinal cholinergic system may provide a better understanding of the causes for visual dysfunction. Early diagnosis and support of the cholinergic system may help AD patients retain a higher level of functioning for an extended period of time.
The eye is the only part of the CNS that can be visualized noninvasively (Hill et al., 2014; MacGillivray et al., 2014) and it shares many features with the rest of the brain (MacCormick et al., 2015), making it an ideal candidate for the development of biomarkers to diagnose CNS disorders. Visual assessments, such as optical coherence tomography and electroretinography, have been widely used, for over a decade, to detect several diseases, such as cerebral malaria (MacCormick et al., 2015), stroke (Baker et al., 2008), diabetes mellitus (Cheung et al., 2010), hypertension (Wong and Mitchell, 2007), cardiovascular disease (Liew et al., 2011), schizophrenia (Chu et al., 2012; Silverstein et al., 2015) and Parkinson’s disease (Tian et al., 2011; Lee et al., 2014).
Due to the tremendous necessity to quickly diagnose AD and the high cost of other diagnostic techniques, such as positron emission tomography (Franzco et al., 2017) and magnetic resonance imaging (Kusne et al., 2016), researchers have begun employing numerous visual tests to detect differences in the eyes of individuals suffering from AD, as compared to healthy controls (Berisha et al., 2007; Moschos et al., 2012; Frost et al., 2013; Coppola et al., 2015; Snyder et al., 2016). All these data combined have yielded very important findings. AD is linked to thicker retinal inner plexiform layer (IPL) (Snyder et al., 2016), thinner retinal NFL (Danesh-Meyer et al., 2006; Iseri et al., 2006; Paquet et al., 2007; Kesler et al., 2011; Gao et al., 2015; Thomson et al., 2015), a reduced number in ganglion cell axons (Blanks et al., 1996b; Danesh-Meyer et al., 2006), narrowing of retinal veins with decreased blood flow (Berisha et al., 2007), higher number of astrocytes in the NFL (Blanks et al., 1996a, 1996b), Aβ accumulation in GCL, NFL, IPL, outer retina (Alexandrov et al., 2011; Koronyo-Hamaoui et al., 2011) and lens (Goldstein et al., 2003), reduced amplitude and increased implicit times in ganglion cell responses (Katz et al., 1989; Trick et al., 1989; Krasodomska et al., 2010; Moschos et al., 2012), increased levels of inflammatory marker complement factor H in the retina (Alexandrov et al., 2011), and abnormalities in eye fixation, saccadic and pursuit movements (Chang et al., 2014; Shakespeare et al., 2015).
Proponents in AD research suggest that the integration of non-invasive retinal examination techniques, at different time points, may be a valuable diagnostic tool for detecting the disease and tracking its progression, as the retinal alterations may reflect the anatomical and pathological changes that are occurring in the deeper brain regions (Kesler et al., 2011; Chang et al., 2014; Hill et al., 2014). If AD is detected in its early stages, treatment can commence promptly and therefore be more effective in prolonging the patient’s quality of life by delaying cognitive impairment. The current studies support the idea that characterization of the retinal cholinergic system provides a tremendous opportunity to develop non-invasive biomarkers for dementia and AD (Ikram et al., 2012; Chang et al., 2014; Hill et al., 2014; Kusne et al., 2016; Lim et al., 2016).
Highlights.
Data from a transgenic Alzheimer’s disease (AD) model indicate that retinal changes parallel AD pathology in the brain.
Tg-SwDI mouse model of AD exhibited differential gene regulation of acetylcholine receptor subunits in the retina.
Tg-SwDI AD mice had age-dependent loss of retinal cholinergic cells as compared to non-transgenic (wild type) mice.
Transgenic AD mice displayed significantly more gliosis than wild type mice in the retinal nerve fiber layer.
Acknowledgments
We are grateful to Dr. Bindiya Patel for reviewing the manuscript and to Ashish Kumar for maintaining the animal colony, for genotyping, and for assisting with tissue collection.
Funding: This work was supported by the National Institutes of Health [grant numbers P30 EY003039, P30 NS47466]
Abbreviations
- Aβ
Amyloid beta
- ACh
Acetylcholine
- AChR
Acetylcholine receptor
- AD
Alzheimer’s Disease
- APP
Amyloid precursor protein
- ChAT
Choline acetyltransferase
- CNS
Central nervous system
- GCL
Ganglion cell layer
- GFAP
Glial fibrillary acidic protein
- IHC
Immunohistochemistry
- iINL
Inner inner nuclear layer
- INL
Inner nuclear layer
- IPL
Inner plexiform layer
- mAChR
Muscarinic acetylcholine receptor
- mo
Months old
- nAChR
Nicotinic acetylcholine receptor
- NFL
Nerve fiber layer
- oINL
Outer inner nuclear layer
- ONL
Outer nuclear layer
- qPCR
Quantitative polymerase chain reaction
- Tg-SwDI
Transgenic Swedish, Dutch and Iowa
- SEM
Standard error of mean
- WT
Wild type
Footnotes
Authors’ contributions: Fred G. Oliveira-Souza performed the vast majority of data collection, analysis, experimental design and manuscript preparation. Marci L. DeRamus assisted in editing this manuscript and was responsible for the designing, optimization and validation of most of the AChR primers. Thomas van Groen provided all the animals used in these experiments and assisted in editing this manuscript. Alexis E. Lambert participated in data analysis. The senior authors Mark S. Bolding and Christianne E. Strang assisted in the writing and editing of this manuscript. Christianne E. Strang was also involved in experimental design, data collection and data analysis.
Publisher's Disclaimer: This is a PDF file of an unedited manuscript that has been accepted for publication. As a service to our customers we are providing this early version of the manuscript. The manuscript will undergo copyediting, typesetting, and review of the resulting proof before it is published in its final citable form. Please note that during the production process errors may be discovered which could affect the content, and all legal disclaimers that apply to the journal pertain.
References
- Alexandrov PN, Pogue A, Bhattacharjee S, Lukiw WJ. Retinal amyloid peptides and complement factor H in transgenic models of Alzheimer’s disease. Neuroreport. 2011;22:623–627. doi: 10.1097/WNR.0b013e3283497334. Available at: http://www.pubmedcentral.nih.gov/articlerender.fcgi?artid=3719862&tool=pmcentrez&rendertype=abstract. [DOI] [PMC free article] [PubMed] [Google Scholar]
- American Psychiatric Association. DSM-V. 2013. [Google Scholar]
- Baker ML, Hand PJ, Wang JJ, Wong TY. Retinal signs and stroke: Revisiting the link between the eye and brain. Stroke. 2008;39:1371–1379. doi: 10.1161/STROKEAHA.107.496091. [DOI] [PubMed] [Google Scholar]
- Berisha F, Feke GT, Trempe CL, McMeel JW, Schepens CL. Retinal abnormalities in early Alzheimer’s disease. Investig Ophthalmol Vis Sci. 2007;48:2285–2289. doi: 10.1167/iovs.06-1029. [DOI] [PubMed] [Google Scholar]
- Blanks JC, Schmidt SY, Torigoe Y, Porrello KV, Hinton DR, Blanks RHI. Retinal pathology in Alzheimer’s disease. II. Regional neuron loss and glial changes in GCL. Neurobiol Aging. 1996a;17:385–395. doi: 10.1016/0197-4580(96)00009-7. [DOI] [PubMed] [Google Scholar]
- Blanks JC, Torigoe Y, Hinton DR, Blanks RHI. Retinal pathology in Alzheimer’s disease. I. Ganglion cell loss in foveal/parafoveal retina. Neurobiol Aging. 1996b;17:377–384. doi: 10.1016/0197-4580(96)00010-3. [DOI] [PubMed] [Google Scholar]
- Chang LYL, Lowe J, Ardiles A, Lim J, Grey AC, Robertson K, Danesh-Meyer H, Palacios AG, Acosta ML. Alzheimer’s disease in the human eye. Clinical tests that identify ocular and visual information processing deficit as biomarkers. Alzheimer’s Dement. 2014;10:251–261. doi: 10.1016/j.jalz.2013.06.004. Available at: http://dx.doi.org/10.1016/j.jalz.2013.06.004. [DOI] [PubMed] [Google Scholar]
- Cheung N, Mitchell P, Wong TY. The Lancet. 2010. Diabetic retinopathy; pp. 124–136. [DOI] [PubMed] [Google Scholar]
- Chu EM-Y, Kolappan M, Barnes TRE, Joyce EM, Ron MA. A window into the brain: an in vivo study of the retina in schizophrenia using optical coherence tomography. Psychiatry Res. 2012;203:89–94. doi: 10.1016/j.pscychresns.2011.08.011. Available at: http://www.pubmedcentral.nih.gov/articlerender.fcgi?artid=4024658&tool=pmcentrez&rendertype=abstract. [DOI] [PMC free article] [PubMed] [Google Scholar]
- Chu LW, Ma ESK, Lam KKY, Chan MF, Lee DHS. Increased alpha 7 nicotinic acetylcholine receptor protein levels in Alzheimer’s disease patients. Dement Geriatr Cogn Disord. 2005;19:106–112. doi: 10.1159/000082661. [DOI] [PubMed] [Google Scholar]
- Cimini BA, Strang CE, Wotring VE, Keyser KT, Eldred WD. Role of acetylcholine in nitric oxide production in the salamander retina. J Comp Neurol. 2008;507:1952–1963. doi: 10.1002/cne.21655. [DOI] [PubMed] [Google Scholar]
- Coppola G, Di Renzo A, Ziccardi L, Martelli F, Fadda A, Manni G, Barboni P, Pierelli F, Sadun AA, Parisi V. Optical coherence tomography in Alzheimer’s disease: A meta-analysis. PLoS One. 2015:10. doi: 10.1371/journal.pone.0134750. [DOI] [PMC free article] [PubMed] [Google Scholar]
- Cowburn RF, Wiehager B, Ravid R, Winblad B. Acetylcholine muscarinic M2 receptor stimulated [35S]GTP gamma S binding shows regional selective changes in Alzheimer’s disease postmortem brain. Neurodegeneration. 1996;5:19–26. doi: 10.1006/neur.1996.0003. [DOI] [PubMed] [Google Scholar]
- Cronin-Golomb A, Corkin S, Growdon JH. Visual dysfunction predicts cognitive deficits in Alzheimer’s disease. Optom Vis Sci. 1995;72:168–176. doi: 10.1097/00006324-199503000-00004. [DOI] [PubMed] [Google Scholar]
- Cronin-Golomb A, Corkin S, Rizzo JF, Cohen J, Growdon JH, Banks KS. Visual dysfunction in Alzheimer’s disease: relation to normal aging. Ann Neurol. 1991;29:41–52. doi: 10.1002/ana.410290110. [DOI] [PubMed] [Google Scholar]
- D’Andrea MR, Nagele RG. Targeting the alpha 7 nicotinic acetylcholine receptor to reduce amyloid accumulation in Alzheimer’s disease pyramidal neurons. Curr Pharm Des. 2006;12:677–684. doi: 10.2174/138161206775474224. Available at: http://eutils.ncbi.nlm.nih.gov/entrez/eutils/elink.fcgi?dbfrom=pubmed&id=16472157&retmode=ref&cmd=prlinks%5Cnpapers2://publication/uuid/B1F53795-C205-48B6-8A5E-9493B3BFBDCD. [DOI] [PubMed] [Google Scholar]
- Danesh-Meyer HV, Birch H, Ku JY-F, Carroll S, Gamble G. Reduction of optic nerve fibers in patients with Alzheimer disease identified by laser imaging. Neurology. 2006;67:1852–1854. doi: 10.1212/01.wnl.0000244490.07925.8b. Available at: http://www.ncbi.nlm.nih.gov/pubmed/17130422. [DOI] [PubMed] [Google Scholar]
- De Strooper B, Saftig P, Craessaerts K, Vanderstichele H, Guhde G, Annaert W, Von Figura K, Van Leuven F. Deficiency of presenilin-1 inhibits the normal cleavage of amyloid precursor protein. Nature. 1998;391:387–390. doi: 10.1038/34910. [DOI] [PubMed] [Google Scholar]
- Dmitrieva Na, Strang CE, Keyser KT. Expression of Alpha 7 Nicotinic Acetylcholine Receptors by Bipolar, Amacrine, and Ganglion Cells of the Rabbit Retina. J Histochem Cytochem. 2007;55:461–476. doi: 10.1369/jhc.6A7116.2006. Available at: http://www.ncbi.nlm.nih.gov/pubmed/17189521. [DOI] [PubMed] [Google Scholar]
- Doraiswamy PM. Non-cholinergic strategies for treating and preventing Alzheimer’s disease. CNS Drugs. 2002;16:811–824. doi: 10.2165/00023210-200216120-00003. [DOI] [PubMed] [Google Scholar]
- Echeverria V, Zeitlin R. Cotinine: a potential new therapeutic agent against Alzheimer’s disease. CNS Neurosci Ther. 2012;18:517–523. doi: 10.1111/j.1755-5949.2012.00317.x. Available at: http://www.ncbi.nlm.nih.gov/pubmed/22530628. [DOI] [PMC free article] [PubMed] [Google Scholar]
- Edbauer D, Winkler E, Regula JT, Pesold B, Steiner H, Haass C. Reconstitution of gamma-secretase activity. Nat Cell Biol. 2003;5:486–488. doi: 10.1038/ncb960. [DOI] [PubMed] [Google Scholar]
- Fodero LR, Mok SS, Losic D, Martin LL, Aguilar MI, Barrow CJ, Livett BG, Small DH. Alpha7-nicotinic acetylcholine receptors mediate an Abeta(1–42)-induced increase in the level of acetylcholinesterase in primary cortical neurones. J Neurochem. 2004;88:1186–1193. doi: 10.1046/j.1471-4159.2003.02296.x. [DOI] [PubMed] [Google Scholar]
- Ford KJ, Feller MB. Assembly and disassembly of a retinal cholinergic network. Vis Neurosci. 2012;29:61–71. doi: 10.1017/S0952523811000216. Available at: http://journals.cambridge.org/abstract_S0952523811000216. [DOI] [PMC free article] [PubMed] [Google Scholar]
- Francis PT, Parsons CG, Jones RW. Rationale for combining glutamatergic and cholinergic approaches in the symptomatic treatment of Alzheimer’s disease. Expert Rev Neurother. 2012a;12:1351–1365. doi: 10.1586/ern.12.124. [DOI] [PubMed] [Google Scholar]
- Francis PT, Parsons CG, Jones RW. Rationale for combining glutamatergic and cholinergic approaches in the symptomatic treatment of Alzheimer’s disease. Expert Rev Neurother. 2012b;12:1351–1365. doi: 10.1586/ern.12.124. Available at: http://www.ncbi.nlm.nih.gov/pubmed/23234396. [DOI] [PubMed] [Google Scholar]
- Franzco PVW, Hadoux X, Alwan M, Hons M, Keel S, Dirani M. Review Emerging ocular biomarkers of Alzheimer disease. 2017:54–61. doi: 10.1111/ceo.12872. [DOI] [PubMed] [Google Scholar]
- Frost S, Kanagasingam Y, Sohrabi H, Vignarajan J, Bourgeat P, Salvado O, Villemagne V, Rowe CC, Macaulay SL, Szoeke C, Ellis Ka, Ames D, Masters CL, Rainey-Smith S, Martins RN AIBL Research Group. Retinal vascular biomarkers for early detection and monitoring of Alzheimer’s disease. Transl Psychiatry. 2013;3:e233. doi: 10.1038/tp.2012.150. Available at: http://www.pubmedcentral.nih.gov/articlerender.fcgi?artid=3591002%7B&%7Dtool=pmcentrez%7B&%7Drendertype=abstract. [DOI] [PMC free article] [PubMed] [Google Scholar]
- Gao L, Liu Y, Li X, Bai Q, Liu P. Abnormal retinal nerve fiber layer thickness and macula lutea in patients with mild cognitive impairment and Alzheimer’s disease. Arch Gerontol Geriatr. 2015;60:162–167. doi: 10.1016/j.archger.2014.10.011. [DOI] [PubMed] [Google Scholar]
- Goldstein LE, Muffat JA, Cherny RA, Moir RD, Ericsson MH, Huang X, Mavros C, Coccia JA, Faget KY, Fitch KA, Masters CL, Tanzi RE, Chylack LT, Bush AI. Cytosolic ??-amyloid deposition and supranuclear cataracts in lenses from people with Alzheimer’s disease. Lancet. 2003;361:1258–1265. doi: 10.1016/S0140-6736(03)12981-9. [DOI] [PubMed] [Google Scholar]
- Grabowski TJ, Cho HS, Vonsattel JPG, William Rebeck G, Greenberg SM. Novel amyloid precursor protein mutation in an Iowa family with dementia and severe cerebral amyloid angiopathy. Ann Neurol. 2001;49:697–705. doi: 10.1002/ana.1009. [DOI] [PubMed] [Google Scholar]
- Hall AM, Roberson ED. Mouse Models of Alzheimer’s Disease. 2013;88:3–12. doi: 10.1016/j.brainresbull.2011.11.017. [DOI] [PMC free article] [PubMed] [Google Scholar]
- Hérnandez-Hérnandez A, Adem A, Ravid R, Cowburn RF. Preservation of acetylcholine muscarinic M2 receptor G-protein interactions in the neocortex of patients with Alzheimer’s disease. Neurosci Lett. 1995;186:57–60. doi: 10.1016/0304-3940(95)11281-z. [DOI] [PubMed] [Google Scholar]
- Hernandez CM, Kayed R, Zheng H, Sweatt JD, Dineley KT. Loss of alpha7 nicotinic receptors enhances beta-amyloid oligomer accumulation, exacerbating early-stage cognitive decline and septohippocampal pathology in a mouse model of Alzheimer’s disease. J Neurosci. 2010;30:2442–2453. doi: 10.1523/JNEUROSCI.5038-09.2010. [DOI] [PMC free article] [PubMed] [Google Scholar]
- Hill JM, Dua P, Clement C, Lukiw WJ. An evaluation of progressive amyloidogenic and pro-inflammatory change in the primary visual cortex and retina in Alzheimer’s disease ( AD ) DEGENERATION. 2014;8:8–11. doi: 10.3389/fnins.2014.00347. [DOI] [PMC free article] [PubMed] [Google Scholar]
- Ikram MK, Cheung CY, Wong TY, Chen CPLH. Retinal pathology as biomarker for cognitive impairment and Alzheimer’s disease. J Neurol Neurosurg Psychiatry. 2012;83:917–922. doi: 10.1136/jnnp-2011-301628. [DOI] [PubMed] [Google Scholar]
- Iseri PK, Altinas Z, Tokay T, Xen Yüksel N. Relationship between Cognitive Impairment and Retinal Morphological and Visual Functional Abnormalities in Alzheimer Disease. J Neuro-Ophthalmol. 2006;26:18–24. doi: 10.1097/01.wno.0000204645.56873.26. [DOI] [PubMed] [Google Scholar]
- Katz B, Rimmer S, Iragui V, Katzman R. Abnormal pattern electroretinogram in Alzheimer’s disease: evidence for retinal ganglion cell degeneration? Ann Neurol. 1989;26:221–225. doi: 10.1002/ana.410260207. [DOI] [PubMed] [Google Scholar]
- Kesler A, Vakhapova V, Korczyn AD, Naftaliev E, Neudorfer M. Retinal thickness in patients with mild cognitive impairment and Alzheimer’s disease. Clin Neurol Neurosurg. 2011;113:523–526. doi: 10.1016/j.clineuro.2011.02.014. [DOI] [PubMed] [Google Scholar]
- Kimbrough IF, Robel S, Roberson ED, Sontheimer H. Vascular amyloidosis impairs the gliovascular unit in a mouse model of Alzheimer’s disease. Brain. 2015;138:3716–3733. doi: 10.1093/brain/awv327. [DOI] [PMC free article] [PubMed] [Google Scholar]
- Kittila CA, Massey SC. Pharmacology of directionally selective ganglion cells in the rabbit retina. J Neurophysiol. 1997;77:675–689. doi: 10.1152/jn.1997.77.2.675. Available at: http://www.ncbi.nlm.nih.gov/pubmed/9065840. [DOI] [PubMed] [Google Scholar]
- Koronyo-Hamaoui M, Koronyo Y, Ljubimov AV, Miller CA, Ko MHK, Black KL, Schwartz M, Farkas DL. Identification of amyloid plaques in retinas from Alzheimer’s patients and noninvasive in vivo optical imaging of retinal plaques in a mouse model. Neuroimage. 2011:54. doi: 10.1016/j.neuroimage.2010.06.020. [DOI] [PMC free article] [PubMed] [Google Scholar]
- Krasodomska K, Lubiński W, Potemkowski A, Honczarenko K. Pattern electroretinogram (PERG) and pattern visual evoked potential (PVEP) in the early stages of Alzheimer’s disease. Doc Ophthalmol. 2010;121:111–121. doi: 10.1007/s10633-010-9238-x. [DOI] [PMC free article] [PubMed] [Google Scholar]
- Kusne Y, Wolf AB, Townley K, Conway M, Peyman GA. Visual system manifestations of Alzheimer’s disease. 2016:1–9. doi: 10.1111/aos.13319. [DOI] [PubMed] [Google Scholar]
- La Morgia C, et al. Melanopsin retinal ganglion cell loss in Alzheimer disease. Ann Neurol. 2015 doi: 10.1002/ana.24548. n/a-n/a Available at: http://dx.doi.org/10.1002/ana.24548. [DOI] [PMC free article] [PubMed]
- Lee JY, Ahn J, Kim TW, Jeon BS. Optical coherence tomography in Parkinson’s disease: Is the retina a biomarker? J Parkinsons Dis. 2014;4:197–204. doi: 10.3233/JPD-130306. [DOI] [PubMed] [Google Scholar]
- Levy E, Carman MD, Fernandez-Madrid IJ, Power MD, Lieberburg I, van Duinen SG, Bots GT, Luyendijk W, Frangione B. Mutation of the Alzheimer’s disease amyloid gene in hereditary cerebral hemorrhage, Dutch type. Science. 1990;248:1124–1126. doi: 10.1126/science.2111584. [DOI] [PubMed] [Google Scholar]
- Liew G, Wang JJ, Jin J. Retinal vascular signs: a window to the heart? Rev Esp Cardiol. 2011;64:515–521. doi: 10.1016/j.recesp.2011.02.014. [DOI] [PubMed] [Google Scholar]
- Lim JKH, Li Q-X, zheng He, Vingrys AJP, Wong VHY, Currier N, Mullen J, Bui BV, Nguyen CTO. The Eye as a Biomarker for Alzheimer’s Disease. Front Neurosci. 2016;10:536. doi: 10.3389/fnins.2016.00536. [DOI] [PMC free article] [PubMed] [Google Scholar]
- MacCormick IJC, Czanner G, Faragher B. Developing retinal biomarkers of neurological disease: an analytical perspective. Biomark Med. 2015;9:691–701. doi: 10.2217/bmm.15.17. Available at: http://www.ncbi.nlm.nih.gov/pubmed/26174843. [DOI] [PMC free article] [PubMed] [Google Scholar]
- MacGillivray TJ, Trucco E, Cameron JR, Dhillon B, Houston JG, Van Beek EJR. Retinal imaging as a source of biomarkers for diagnosis, characterization and prognosis of chronic illness or long-term conditions. Br J Radiol. 2014:87. doi: 10.1259/bjr.20130832. [DOI] [PMC free article] [PubMed] [Google Scholar]
- Masland RH. Acetylcholine in the retina. Neurochem Int. 1980;1C:501–518. doi: 10.1016/0197-0186(80)90083-2. [DOI] [PubMed] [Google Scholar]
- Maurer K, Volk S, Gerbaldo H. Auguste D and Alzheimer’s disease. Lancet. 1997;349:1546–1549. doi: 10.1016/S0140-6736(96)10203-8. [DOI] [PubMed] [Google Scholar]
- Miao J, Xu F, Davis J, Otte-Höller I, Verbeek MM, Van Nostrand WE. Cerebral microvascular amyloid beta protein deposition induces vascular degeneration and neuroinflammation in transgenic mice expressing human vasculotropic mutant amyloid beta precursor protein. Am J Pathol. 2005;167:505–515. doi: 10.1016/s0002-9440(10)62993-8. [DOI] [PMC free article] [PubMed] [Google Scholar]
- Moschos MM, Markopoulos I, Chatziralli I, Rouvas A, Papageorgiou SG, Ladas I, Vassilopoulos D. Structural and functional impairment of the retina and optic nerve in Alzheimer’s disease. Curr Alzheimer Res. 2012;9:782–788. doi: 10.2174/156720512802455340. [DOI] [PubMed] [Google Scholar]
- Mullan M, Crawford F, Axelman K, Houlden H, Lilius L, Winblad B, Lannfelt L. A pathogenic mutation for probable Alzheimer’s disease in the APP gene at the N-terminus of beta-amyloid. 1992 doi: 10.1038/ng0892-345. [DOI] [PubMed] [Google Scholar]
- Murrell J, Farlow M, Ghetti B, Benson MD. A mutation in the amyloid precursor protein associated with hereditary Alzheimer’s disease. Science (80-) 1991;254:97–99. doi: 10.1126/science.1925564. Available at: http://www.ncbi.nlm.nih.gov/entrez/query.fcgi?cmd=Retrieve&db=PubMed&dopt=Citation&list_uids=1925564. [DOI] [PubMed] [Google Scholar]
- Oddo S, LaFerla FM. The role of nicotinic acetylcholine receptors in Alzheimer’s disease. J Physiol Paris. 2006;99:172–179. doi: 10.1016/j.jphysparis.2005.12.080. Available at: http://www.ncbi.nlm.nih.gov/pubmed/16448808. [DOI] [PubMed] [Google Scholar]
- Paquet C, Boissonnot M, Roger F, Dighiero P, Gil R, Hugon J. Abnormal retinal thickness in patients with mild cognitive impairment and Alzheimer’s disease. Neurosci Lett. 2007;420:97–99. doi: 10.1016/j.neulet.2007.02.090. Available at: http://easyaccess.lib.cuhk.edu.hk/login?url=http://ovidsp.ovid.com/ovidweb.cgi?T=JS&CSC=Y&NEWS=N&PAGE=fulltext&D=emed8&AN=2007259893%5Cnhttp://findit.lib.cuhk.edu.hk/852cuhk/?sid=OVID:embase&id=pmid:&id=doi:10.1016%2Fj.neulet.2007.02.090&issn=0304-3940&is. [DOI] [PubMed] [Google Scholar]
- Ramírez JM, Triviño A, Ramírez AI, Salazar JJ, García-Sanchez J. Structural specializations of human retinal glial cells. Vision Res. 1996;36:2029–2036. doi: 10.1016/0042-6989(95)00322-3. [DOI] [PubMed] [Google Scholar]
- Rizzo M, Anderson SW, Dawson J, Nawrot M. Vision and cognition in Alzheimer’s disease. Neuropsychologia. 2000;38:1157–1169. doi: 10.1016/s0028-3932(00)00023-3. [DOI] [PubMed] [Google Scholar]
- Schliebs R, Arendt T. The significance of the cholinergic system in the brain during aging and in Alzheimer’s disease. J Neural Transm. 2006;113:1625–1644. doi: 10.1007/s00702-006-0579-2. [DOI] [PubMed] [Google Scholar]
- Schmidt M, Humphrey MF, Wassle H. Action and localization of acetylcholine in the cat retina. J Neurophysiol. 1987;58:997–1015. doi: 10.1152/jn.1987.58.5.997. Available at: http://www.ncbi.nlm.nih.gov/pubmed/3694255%5Cnhttp://jn.physiology.org/content/58/5/997.long. [DOI] [PubMed] [Google Scholar]
- Schnitzer J. Astrocytes in the guinea pig, horse, and monkey retina: Their occurrence coincides with the presence of blood vessels. Glia. 1988;1:74–89. doi: 10.1002/glia.440010109. [DOI] [PubMed] [Google Scholar]
- Shakespeare TJ, Kaski D, Yong KXX, Paterson RW, Slattery CF, Ryan NS, Schott JM, Crutch SJ. Abnormalities of fixation, saccade and pursuit in posterior cortical atrophy. Brain. 2015;138:1976–1991. doi: 10.1093/brain/awv103. [DOI] [PMC free article] [PubMed] [Google Scholar]
- Silverstein SM, Rosen R, Sciences H, Eye Y. HHS Public Access. 2015;2:46–55. [Google Scholar]
- Slotkin TA, Cousins MM, Tate CA, Seidler FJ. Persistent cholinergic presynaptic deficits after neonatal chlorpyrifos exposure. Brain Res. 2001;902:229–243. doi: 10.1016/s0006-8993(01)02387-3. [DOI] [PubMed] [Google Scholar]
- Smith ML, Souza FGO, Bruce KS, Strang CE, Morley BJ. Acetylcholine receptors in the retinas of the α7 nicotinic acetylcholine receptor knockout mouse. 2014:1328–1356. [PMC free article] [PubMed] [Google Scholar]
- Snyder PJ, Johnson LN, Ying Y, Maruff P, Fern B. Nonvascular retinal imaging markers of preclinical Alzheimer’s disease. 2016;4:169–178. doi: 10.1016/j.dadm.2016.09.001. [DOI] [PMC free article] [PubMed] [Google Scholar]
- Stacy RC, Demas J, Burgess RW, Sanes JR, Wong RO. Disruption and recovery of patterned retinal activity in the absence of acetylcholine. J Neurosci. 2005;25:9347–9357. doi: 10.1523/JNEUROSCI.1800-05.2005. Available at: http://www.ncbi.nlm.nih.gov/pubmed/16221843. [DOI] [PMC free article] [PubMed] [Google Scholar]
- Strang CE, Andison ME, Amthor FR, Keyser KT. Rabbit retinal ganglion cells express functional alpha7 nicotinic acetylcholine receptors. Am J Physiol Cell Physiol. 2005;289:C644–55. doi: 10.1152/ajpcell.00633.2004. Available at: http://www.ncbi.nlm.nih.gov/entrez/query.fcgi?cmd=Retrieve&db=PubMed&dopt=Citation&list_uids=15872006. [DOI] [PubMed] [Google Scholar]
- Strang CE, Long Y, Gavrikov KE, Amthor FR, Keyser KT. Nicotinic and muscarinic acetylcholine receptors shape ganglion cell response properties. J Neurophysiol. 2015;113:203–217. doi: 10.1152/jn.00405.2014. Available at: http://jn.physiology.org/lookup/doi/10.1152/jn.00405.2014. [DOI] [PMC free article] [PubMed] [Google Scholar]
- Strang CE, Renna JM, Amthor FR, Keyser KT. Nicotinic acetylcholine receptor expression by directionally selective ganglion cells. Vis Neurosci. 2007;24:523–533. doi: 10.1017/S0952523807070435. Available at: http://www.ncbi.nlm.nih.gov/entrez/query.fcgi?cmd=Retrieve&db=PubMed&dopt=Citation&list_uids=17686198. [DOI] [PubMed] [Google Scholar]
- Strang CE, Renna JM, Amthor FR, Keyser KT. Muscarinic acetylcholine receptor localization and activation effects on ganglion response properties. Investig Ophthalmol Vis Sci. 2010;51:2778–2789. doi: 10.1167/iovs.09-4771. [DOI] [PMC free article] [PubMed] [Google Scholar]
- Sun C, Warland DK, Ballesteros JM, Van Der List D, Chalupa LM. Retinal waves in mice lacking the β2 subunit of the nicotinic acetylcholine receptor. Proc Natl Acad Sci U S A. 2008;105:13638–13643. doi: 10.1073/pnas.0807178105. Available at: http://www.pubmedcentral.nih.gov/articlerender.fcgi?artid=2527347&tool=pmcentrez&rendertype=abstract. [DOI] [PMC free article] [PubMed] [Google Scholar]
- Teaktong T, Graham A, Court J, Perry R, Jaros E, Johnson M, Hall R, Perry E. Alzheimer’s disease is associated with a selective increase in alpha7 nicotinic acetylcholine receptor immunoreactivity in astrocytes. Glia. 2003;41:207–211. doi: 10.1002/glia.10132. Available at: http://www.ncbi.nlm.nih.gov/pubmed/12509811. [DOI] [PubMed] [Google Scholar]
- Teaktong T, Graham AJ, Court JA, Perry RH, Jaros E, Johnson M, Hall R, Perry EK. Nicotinic acetylcholine receptor immunohistochemistry in Alzheimer’s disease and dementia with Lewy bodies: Differential neuronal and astroglial pathology. J Neurol Sci. 2004;225:39–49. doi: 10.1016/j.jns.2004.06.015. [DOI] [PubMed] [Google Scholar]
- Thomson KL, Yeo JM, Waddell B, Cameron JR, Pal S. A systematic review and meta-analysis of retinal nerve fiber layer change in dementia, using optical coherence tomography. Alzheimer’s Dement Diagnosis, Assess Dis Monit. 2015;1:136–143. doi: 10.1016/j.dadm.2015.03.001. Available at: http://www.sciencedirect.com/science/article/pii/S2352872915000366. [DOI] [PMC free article] [PubMed] [Google Scholar]
- Tian T, Zhu X-H, Liu Y-H. Potential role of retina as a biomarker for progression of Parkinson’s disease. Int J Ophthalmol. 2011;4:433–438. doi: 10.3980/j.issn.2222-3959.2011.04.21. Available at: http://www.pubmedcentral.nih.gov/articlerender.fcgi?artid=3340867&tool=pmcentrez&rendertype=abstract. [DOI] [PMC free article] [PubMed] [Google Scholar]
- Timmers WF, Tagliavini F, Haan J, Frangione B. Parenchymal preamyloid and amyloid deposits in the brains of patients with hereditary cerebral hemorrhage with amyloidosis-Dutch type. Neurosci Lett. 1990;118:223–226. doi: 10.1016/0304-3940(90)90632-j. [DOI] [PubMed] [Google Scholar]
- Trick GL, Barris MC, Bickler???Bluth M. Abnormal pattern electroretinograms in patients with senile dementia of the alzheimer type. Ann Neurol. 1989;26:226–231. doi: 10.1002/ana.410260208. [DOI] [PubMed] [Google Scholar]
- Tsai Y, Lu B, Ljubimov AV, Girman S, Ross-Cisneros FN, Sadun AA, Svendsen CN, Cohen RM, Wang S. Ocular changes in TGF344-AD rat model of Alzheimer’s disease. Investig Ophthalmol Vis Sci. 2014;55:523–534. doi: 10.1167/iovs.13-12888. [DOI] [PMC free article] [PubMed] [Google Scholar]
- Uhlmann RF, Larson EB, Koepsell TD, Rees TS, Duckert LG. Visual impairment and cognitive dysfunction in Alzheimer’s disease. J Gen Intern Med. 1991;6:126–132. doi: 10.1007/BF02598307. Available at: http://www.ncbi.nlm.nih.gov/pubmed/2023019. [DOI] [PubMed] [Google Scholar]
- Van Vickle GD, Esh CL, Daugs ID, Kokjohn TA, Kalback WM, Patton RL, Luehrs DC, Walker DG, Lue L-F, Beach TG, Davis J, Van Nostrand WE, Castaño EM, Roher AE. Tg-SwDI transgenic mice exhibit novel alterations in AbetaPP processing, Abeta degradation, and resilient amyloid angiopathy. Am J Pathol. 2008;173:483–493. doi: 10.2353/ajpath.2008.071191. [DOI] [PMC free article] [PubMed] [Google Scholar]
- Varghese SB, Reid JC, Eugenie Hartmann E, Keyser KT. The effects of nicotine on the human electroretinogram. Investig Ophthalmol Vis Sci. 2011;52:9445–9451. doi: 10.1167/iovs.11-7874. [DOI] [PMC free article] [PubMed] [Google Scholar]
- Wisniewski T, Ghiso J, Frangione B. Peptides homologous to the amyloid protein of Alzheimer’s disease containing a glutamine for glutamic acid substitution have accelerated amyloid fibril formation. Biochem Biophys Res Commun. 1991;179:1247–1254. doi: 10.1016/0006-291x(91)91706-i. [DOI] [PubMed] [Google Scholar]
- Wong T, Mitchell P. The eye in hypertension. Lancet. 2007;369:425–435. doi: 10.1016/S0140-6736(07)60198-6. [DOI] [PubMed] [Google Scholar]
- Xu F, Grande AM, Robinson JK, Previti ML, Vasek M, Davis J, Van Nostrand WE. Early-onset subicular microvascular amyloid and neuroinflammation correlate with behavioral deficits in vasculotropic mutant amyloid ??-protein precursor transgenic mice. Neuroscience. 2007;146:98–107. doi: 10.1016/j.neuroscience.2007.01.043. [DOI] [PMC free article] [PubMed] [Google Scholar]


