Abstract
Purpose
Human pluripotent stem cell (hPSC)-derived retinal organoids are a platform for investigating retinal development, pathophysiology, and cellular therapies. In contrast to histologic analysis in which multiple specimens fixed at different times are used to reconstruct developmental processes, repeated analysis of the same living organoids provides a more direct means to characterize changes. New live imaging modalities can provide insights into retinal organoid structure and metabolic function during in vitro growth. This study employed live tissue imaging to characterize retinal organoid development, including metabolic changes accompanying photoreceptor differentiation.
Methods
Live hPSC-derived retinal organoids at different developmental stages were examined for microanatomic organization and metabolic function by phase contrast microscopy, optical coherence tomography (OCT), fluorescence lifetime imaging microscopy (FLIM), and hyperspectral imaging (HSpec). Features were compared to those revealed by histologic staining, immunostaining, and microcomputed tomography (micro-CT) of fixed organoid tissue.
Results
We used FLIM and HSpec to detect changes in metabolic activity as organoids differentiated into organized lamellae. FLIM detected increased glycolytic activity and HSpec detected retinol and retinoic acid accumulation in the organoid outer layer, coinciding with photoreceptor genesis. OCT enabled imaging of lamellae formed during organoid maturation. Micro-CT revealed three-dimensional structure, but failed to detect lamellae.
Conclusions
Live imaging modalities facilitate real-time and nondestructive imaging of retinal organoids as they organize into lamellar structures. FLIM and HSpec enable rapid detection of lamellar structure and photoreceptor metabolism. Live imaging techniques may aid in the continuous evaluation of retinal organoid development in diverse experimental and cell therapy settings.
Keywords: fluorescence lifetime, hyperspectral imaging, retinal organoid, photoreceptor metabolism
Organoids representing a variety of tissues and produced from human stem cells are envisioned to serve as models of human development and disease, as platforms for drug screening, and as sources of human cells or tissues for transplantation.1–4 These three-dimensional (3D) self-organizing structures develop cellular composition and architecture similar to in vivo tissues, thereby replicating biologically relevant intercellular signaling in vitro.1,2
Human pluripotent stem cell (hPSC)–derived retinal organoids reproduce many aspects of embryonic retinal development, including the formation of a bilayered optic cup and light-detecting photoreceptors.5–7 They begin as an aggregate of hPSCs and, over the course of several weeks, self-organize into a stratified structure that develops in a spatiotemporal sequence similar to that which occurs in vivo.5,6,8,9 While retinal organoid neurons can migrate to their appropriate relative positions, produce neurites, and colocalize synaptic proteins with appropriate cellular targets, distinct plexiform layers are not routinely formed, and the photoreceptors do not efficiently elaborate fully formed light detecting outer segments.6–9
Methods that enable monitoring of retinal organoid development in vitro may facilitate the improvement of retinal organoid culture conditions in order to better replicate in vivo development.1,3 However, the ability to monitor spatial and temporal changes in structure and function has been limited by the fact that common histologic, immunostaining, and in situ hybridization analyses require the destruction of the tissue specimen. Thus, live imaging methods that enable nondestructive observation of organoid structure and function based on naturally occurring fluorophores will benefit this rapidly developing field. Live imaging methods can discriminate well-organized tissue from deteriorated or maldeveloped tissue and permit evaluation of organoid cellular functions in real time. In addition, live imaging using endogenous fluorophores such as nicotinamide adenine dinucleotide, reduced (NADH); flavin adenine dinucleotide (FAD); and retinol is less disruptive than methods involving genetic modification of cells to express common fluorophores such as green fluorescent protein. More generally, live imaging may enhance the utility of retinal organoids as development and disease models, as drug screening tools, or as sources for retinal cell replacement therapies.
This study explores the use of live functional imaging using naturally occurring fluorophores to investigate retinal organoid growth and metabolism. We examine organoids using two powerful 2-photon microscopy approaches: fluorescence lifetime imaging microscopy (FLIM) and hyperspectral imaging (HSpec). FLIM correlates the decay profile of endogenous autofluorescent light to a specific biomolecular source10 and can localize and quantify specific molecular components such as NADH and FAD without the use of exogenous tropic labels.10,11 HSpec quantifies specific autofluorescent emission wavelengths for every pixel in a sample.12,13 Both FLIM and HSpec have the capacity to distinguish the proportions of biochemicals such as NADH, FAD, and retinol, features that can be used to describe developmental and metabolic states.10–13 For instance, by observing the amount of FAD and/or the ratio of free/bound NADH, one can observe a shift from a highly glycolytic state in proliferating germ cells to a state characterized by increased oxidative phosphorylation in differentiated germ cells.11 We also explore organoid development with high-resolution optical coherence tomography (OCT), a modality that is widely used for noninvasive clinical imaging of ophthalmic structures,14 and with microcomputed tomography (micro-CT) as a means to gain insight into the 3D structure of fixed samples. The studies show that live imaging modalities can reveal structural and metabolic changes that are coordinated with retinal cell differentiation in hPSC-derived retinal organoids.
Methods
Stem Cell Derived Organoids
Human embryonic stem cell (hESC) and induced pluripotent stem cell (iPSC) culture and differentiation into retinal organoids are described in detail in Supplementary Methods. Samples of differing ages were derived from different differentiation runs. Phase contrast photomicrographs of differentiated organoids were taken on an inverted microscope (TS100; Nikon Corp., Tokyo, Japan).
Immunofluorescent Staining
Immunostaining and fluorescence microscopy of retinal organoids is described in detail in Supplementary Methods and in Aparicio et al.15
Optical Coherence Tomography
We performed OCT using commercial equipment (Spectralis, software version: 1.8.6.0; Heidelberg Engineering, Inc., Carlsbad, CA, USA) anterior segment mode. Organoids were imaged while suspended in 0.1 mL of culture media in 0.2 mL polypropylene tubes suspended in the device's imaging plane. High-definition horizontal raster scans were acquired of each sample, using parameters in Supplementary Figure S6.
Hyperspectral Imaging
Spectral Images were acquired with an inverted microscope (LSM-780; Carl Zeiss MicroImaging GmbH, Jena, Germany), while organoids were excited at 740 nm and signal detected over 32 channels 420 nm to 690 nm as described in detail in Supplementary Methods. The time to acquire each image was about 15 to 20 seconds with each voxel in the image only stimulated for a small fraction of that time.
Every pixel of the spectral image was transformed to one pixel in the phasor plot and analyzed with hyperspectral software developed at the Translational Imaging Center, University of Southern California (Supplementary Fig. S1).16,17 Intensity images for specific biomolecules (free NADH, retinol, retinoic acid) were obtained by selecting “fingerprint” regions in the phasor plot corresponding to each component.16 In each of these images, we selected two squared regions, corresponding to two different anatomical regions, specifically on the surface and around 70 μm radially into the organoid. Intensities in the two regions were quantified using ImageJ software (http://imagej.nih.gov/ij/; provided in the public domain by the National Institutes of Health, Bethesda, MD, USA) and normalized by the total intensity of the whole region.
Fluorescence Lifetime Imaging Microscopy
Fluorescence lifetime images were acquired with an inverted microscope (Carl Zeiss MicroImaging GmbH) using apparatuses described previously and described in detail in Supplementary Methods.18,19
We collected FLIM data until 100 counts in the brightest pixel of the image were acquired. Typically, acquisition time was less than 1 minute. Autofluorescence of organoid culture media was confirmed to not interfere with the FLIM and spectral signature of cellular autofluorescence.
Each pixel of the FLIM image was transformed to generate the phasor plot as previously described (Supplementary Fig. S2).10,11,16,20–22 Data were generated from sensor settings optimized for NADH autofluorescence signal.10,11,20 The coordinates g and s in the phasor plot represent the sine and cosine Fourier transformation, respectively,11,23 and relative proportions of free and bound NADH determined as described previously.11 Clusters of pixels were analyzed in specific regions of the phasor plot, and correlated with pixels in the imaged sample bearing the same fluorescence intensity decay signature. We performed image segmentation on the FLIM data by selecting and calculating the average phasor value within regions of interest (“region phasor”). When calculating the region phasor, all pixels in that region (varying between 1000 and 2000) were taken into account, and as a result the signal-to-noise ratio of the FLIM signal was substantially improved.24 Phasor lifetime analysis was performed using the same parameters for all hESC and iPSC organoids.
MicroCT
Specimens were fixed in 10% (vol/vol) formalin (Sigma-Aldrich Corp., St. Louis, MO, USA) in PBS at room temperature (RT) for 24 hours, stained in 0.3% (vol/vol) Lugol iodine (1% Lugol solution [Sigma-Aldrich Corp.] mixed with PBS at a 3:7 ratio) for 24 hours at RT,24,25 and imaged immediately after staining using a microCT (Skyscan 1172; Bruker, Inc., Billerica, MA, USA) at 40 kVP at 161 uA, with two averages at each step. Theoretical resolutions of 1 and 2 μm were pursued using 360° scans with 0.5° and 0.25° steps, respectively. Commercial software (Bruker, Inc.) was used for reconstruction using a Feldkamp type algorithm running on processors supplied by Bruker, Inc. Postprocessing and 3D rendering was performed on reconstructed axial images using scientific analytical software (Imaris; Andor Technology plc, Belfast, UK, and Amira; FEI, Inc., Hillsboro, OR, USA) software.
Statistical Analysis
For quantified 2-photon light data, samples were repeated in quadruplicate for each organoid age. Mean, median, range, and standard deviations were computed using commercial spreadsheet (Excel; Microsoft Corp., Redmond, WA, USA) functions. We calculated P values using the χ2 function.
Results
Retinal organoids self-organize into layered retinal structures. Here, we examined this developmental progression over 5 months using traditional histologic and immunofluorescence analyses and novel imaging modalities not previously applied to this system. The same groups of organoids were imaged with each modality, in order to correlate structural and functional features of individual specimens. Imaging was performed primarily for hESCs (main figures in paper) and repeated for iPSCs (Supplementary Fig. S5). Unless indicated, results and discussion relate primarily to hESC-derived organoids.
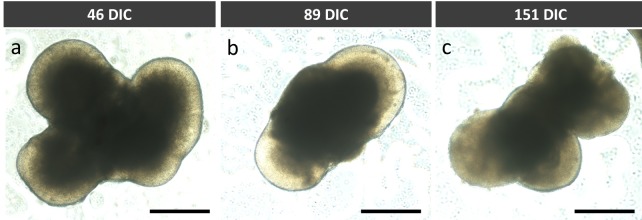
Phase contrast images of representative organoids at 46, 89, and 151 days in culture (DIC) demonstrated organoid morphology with limited microstructural detail (Fig. 1), as previously described.5
Figure 1.
Phase contrast microscopy of hESC-derived retinal organoids at (A) 46 DIC, (B) 89 DIC, and (C) 151 DIC. Scale bars: 0.5 mm.
Histologic and Immunofluorescent Staining Identify Layers Comprised of Specific Cell Types
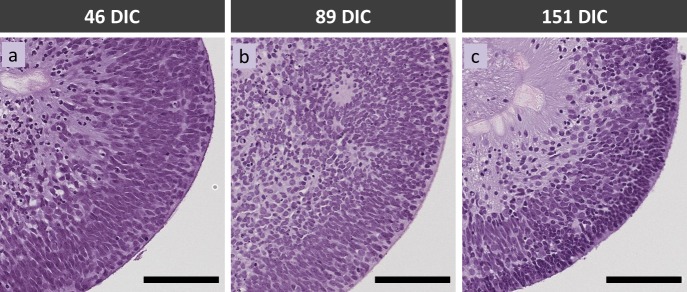
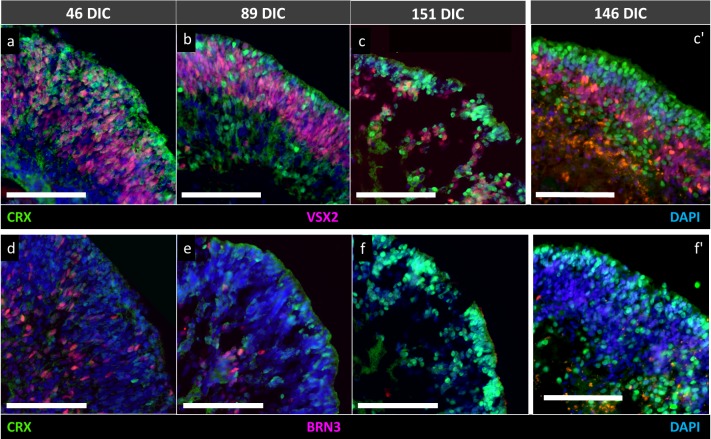
Histologic and immunofluorescent staining of retinal cell type–specific markers confirmed developmental progression from 46 to 151 DIC. Hematoxylin and eosin–stained organoids consisted of a continuous cell layer of varying density at 46 and 89 DIC, whereas a discrete apical layer was evident at 151 DIC (Fig. 2). Immunostaining of cell type–specific markers revealed that the continuous layer of cells at 46 and 89 DIC was comprised of several spatially segregated cell populations. Retinal progenitor cells characterized by elongated, VSX2+ (CHX10+) nuclei comprised a well-defined band of cells reminiscent of the neuroblastic layer of retinas developing in vivo (Figs. 3A, 3B). Cells expressing the CRX marker of photoreceptors or photoreceptor precursors were scattered throughout the epithelium at 46 and 89 DIC (Figs. 3A–E), consistent with their genesis and subsequent migration from the basal to apical layer.26 Similarly, cells expressing the BRN3 marker of retinal ganglion cells were interspersed within the VSX2+ cells at 46 DIC, and largely segregated to their characteristic basal positions by 89 DIC (Figs. 3D, 3E). At 151 DIC, BRN3+ cells were not detected, likely reflecting apoptosis upon failure to form productive synapses.27,28 In contrast, CRX+ cells formed a tightly packed apical layer corresponding to the dense apical layer seen with hematoxylin and eosin staining, and were interspersed at basal positions (Figs. 3C, 3F) as described.26 Despite a histologic sectioning artifact affecting a 151 DIC organoid following OCT, FLIM, and HSpec imaging, this organoid had VSX2, BRN3, and CRX immunostaining very similar to that of another organoid of similar age (Figs. 3C, 3C', 3F, 3F'). Induced pluripotent stem cell–derived retinal organoids previously subjected to FLIM and HSpec imaging also developed a CRX+ outer layer at similar DIC (Supplementary Fig. S5).
Figure 2.
Hematoxylin and eosin staining of hESC-derived retinal organoids at (A) 46 DIC, (B) 89 DIC, and (C) 151 DIC. Scale bars: 100 μm.
Figure 3.
hESC-derived retinal organoids at (A, D) 46 DIC, (B, E) 89 DIC, and (C, F) 151 DIC coimmunostained for retinal progenitor cell marker VSX2 (CHX10), photoreceptor marker CRX, and ganglion cell marker BRN3. (C', F') Immunostaining of 146 DIC organoids, an age similar to organoids in (C, F), respectively, that did not undergo prior live imaging. Scale bars: 100 μm.
OCT and MicroCT Detect Different Organoid Interfaces
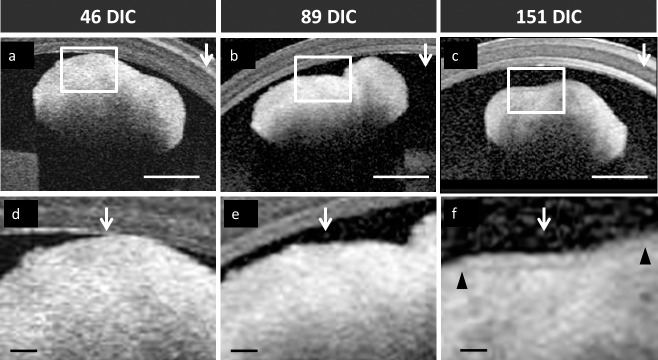
OCT is commonly used for structural imaging of the retina in the clinical ophthalmology setting. When used to image the retina, nuclear layers appear hyporeflective and plexiform layers appear hyperreflective (Supplementary Fig. S3A).29 OCT imaging of live retinal organoids revealed that maturation from 46 to 151 DIC was associated with the appearance of a superficial hyporeflective band bordered by hyperreflective signals perpendicular to the OCTs scanning laser at later ages (Fig. 4). Among three clinical OCT platforms tested, the Heidelberg Spectralis best detected this band at 151 DIC (data not shown). This hyporeflective band was present in images of all organoids examined at 151 DIC (n = 4, Supplementary Figs. S3C–F), but in none of four examined at 89 DIC (P = 0.029, two-tailed Fisher's exact test). A hyporeflective band was detected in one of four organoids at 46 DIC but differed from those at 151 DIC in that it was flanked by a hyperreflective signal only on its superficial side, and may have represented a spurious signal. Overall, a hypo-reflective band was detected once among the eight organoids at ≤89 DIC and in each of the four organoids at 151 DIC (P = 0.010, two-tailed Fisher's exact test). The hyporeflective band was estimated to be ∼25 μm wide, and coincided temporally with the appearance of a lamellar structure in the same organoids (Fig. 2). The hyporeflective band was also detected in the one hESC-derived organoid imaged at 118 DIC (Supplementary Fig. S3B) and in iPSC-derived organoids at 169 DIC and 92 DIC (Supplementary Fig. S4), possibly representing early lamellization.
Figure 4.
OCT analysis of hESC-derived retinal organoids at 46 DIC (A, D), (B, E) 89 DIC, and (C, F) 151 DIC. Boxed regions in (A–C) are enlarged in (D–F) and indicate surfaces perpendicular to the direction of the scanning laser head (vertical arrows). Hyporeflective bands on the outer perimeter of the 151 DIC retinal organoid are indicated by matching arrowheads. Scale bars: (A–C) 0.5 mm and (D–F) 0.1 mm. Polypropylene tube wall is visible in the upper half of each figure.
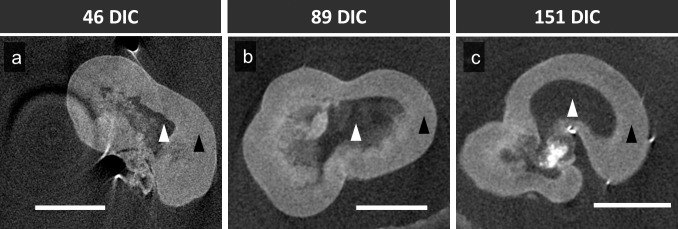
Similar to OCT, microCT can provide high resolution, 3D information for complex structures, but only in fixed tissue. MicroCT produced high-resolution images of retinal organoid structures deeper than detected by OCT (Fig. 5). MicroCT detected an interface distinguishing the retinal neuroepithelium and the hollow acellular region in the organoid center that enabled quantitative assessment of neuroepithelium thickness. However, microCT did not detect lamellar features in any of the DIC 151 organoids revealing insufficient contrast.
Figure 5.
MicroCT analysis of hESC-derived retinal organoids at (A) 46 DIC, (B) 89 DIC, (C) and 151 DIC. Scale bars: 500 μm. Black arrowheads: retinal organoid neuroepithelium. White arrowheads: acellular region.
HSpec Shows Concentration of Retinol and Retinoic Acid in the Superficial Photoreceptor Layer
HSpec measures the autofluorescent spectrum from each pixel of a sample. The spectral signature is correlated to species with known spectral signatures using phasor analysis, and each pixel is color coded to species with correlating phasor regions.16,30 Here, we examined the distribution of free NADH, retinol, and retinoic acid in retinal organoids of different culture ages and correlated cellular organizational changes with distribution of the molecules based on predefined phasor descriptions.16
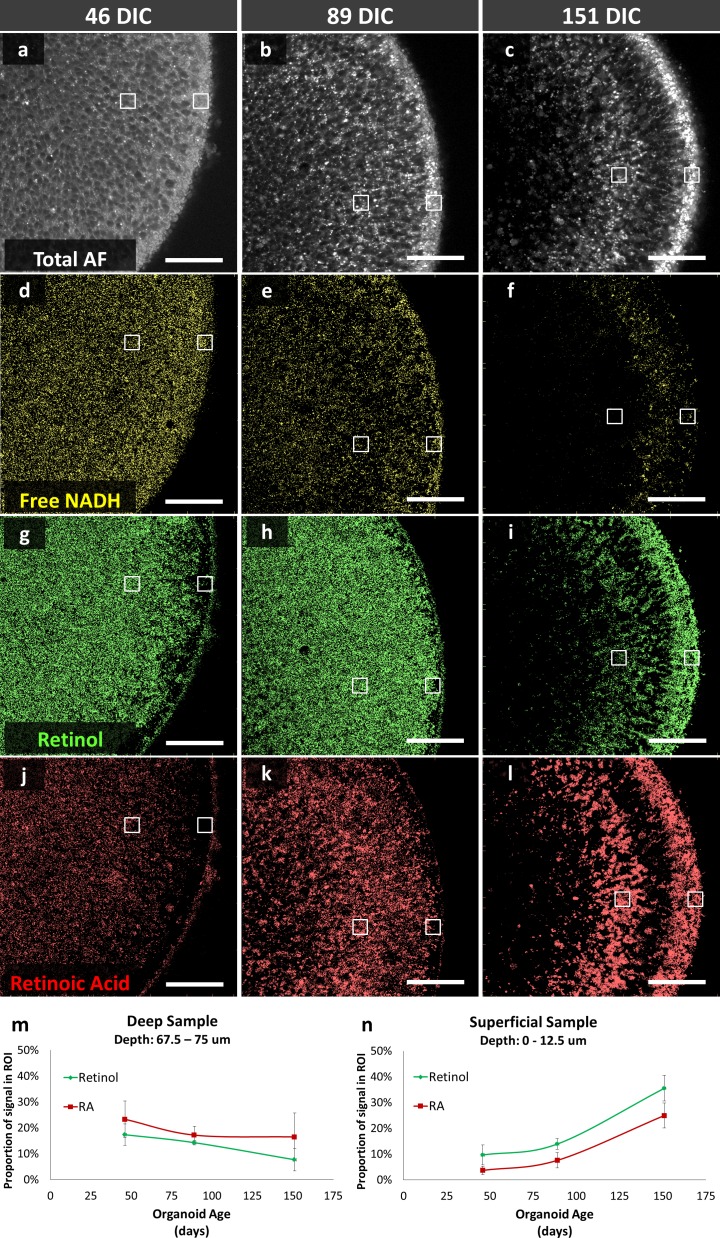
Total autofluorescence (420–690 nm) demonstrated the gross structure of the organoid cross-sections imaged (Figs. 6A–C). Phasor analysis revealed distinct developmental changes in the localization of free NADH, retinol, and retinoic acid (Figs. 6D–L). Free NADH was homogeneously distributed throughout the organoids at 46 and 89 DIC and declined in the deep and superficial positions, but was retained in a layer of intermediate depth at 151 DIC; comparison to immunostaining suggests that this layer may correspond to remaining VSX2+ cells. However, retinol and retinoic acid levels changed in a different manner. Retinol and retinoic acid phasor signals were quantitated for 12.5 μm × 12.5 μm regions of interest (ROIs) at the organoid surface and at 75 μm from the organoid's surface using ImageJ and repeated in quadruplicate on different organoids in order to define relative concentrations of retinol and retinoic acid at different organoid depths. Retinol and retinoic acid signals gradually decreased in the deep ROI and increased in the superficial ROI during organoid maturation (Figs. 6M, 6N). Increasing superficial retinol and retinoic acid signal intensity shares the same maturation trend as expression of the CRX photoreceptor marker (Fig. 3), suggesting that photoreceptors have higher retinol and retinoic acid levels. Induced pluripotent stem cell–derived retinal organoids also developed lamellar structures with enhanced retinoic acid and retinol spectral signatures (Supplementary Fig. S5).
Figure 6.
HSpec of hESC-derived retinal organoids at (A, D, G, J) 46 DIC, (B, E, H, K) 89 DIC, and (C, F, I, L) 151 DIC. (A–C) Autofluorescence of organoid cross section. (D–L) Calculated distributions of spectral signatures of free NADH (yellow, D–F), retinol (dark green, G–I) and retinoic acid (red, J–L). White boxes, regions sampled for retinol and retinoic acid signal. (M, N) retinol and retinoic acid signals at deep and superficial positions in four organoids imaged at each age. Data points and error bars indicate mean and standard deviation. Scale bars: 50 μm.
FLIM Glycolytic Signature Correlates With Photoreceptor Layer
FLIM is a powerful approach to noninvasively characterize the metabolic state of cells and tissue based on the simple fact that different intrinsic biomolecules have different fluorescence decay times. Ubiquity of NADH inside cells and its key roles in cell metabolic activities make this coenzyme one of the most useful and informative intrinsic biomarkers for metabolism, mitochondrial function, oxidative stress, aging, and apoptosis in live cells and tissues.31 Therefore, we targeted this biomolecule to monitor metabolic changes during retinal organoid differentiation.
FLIM intensity images (Figs. 7A–C) of NADH show periodically distributed regions with high, medium, or low intensity, whose pattern varies with organoid age. Prior studies indicated that the majority of intracellular NADH is localized in the mitochondria.23,32 Therefore, the darkest foci in Figures 7A through 7C most likely represent nuclei and the brightest regions might represent accumulations of mitochondria, as are known to coalesce in photoreceptor cytoplasm.22
Figure 7.
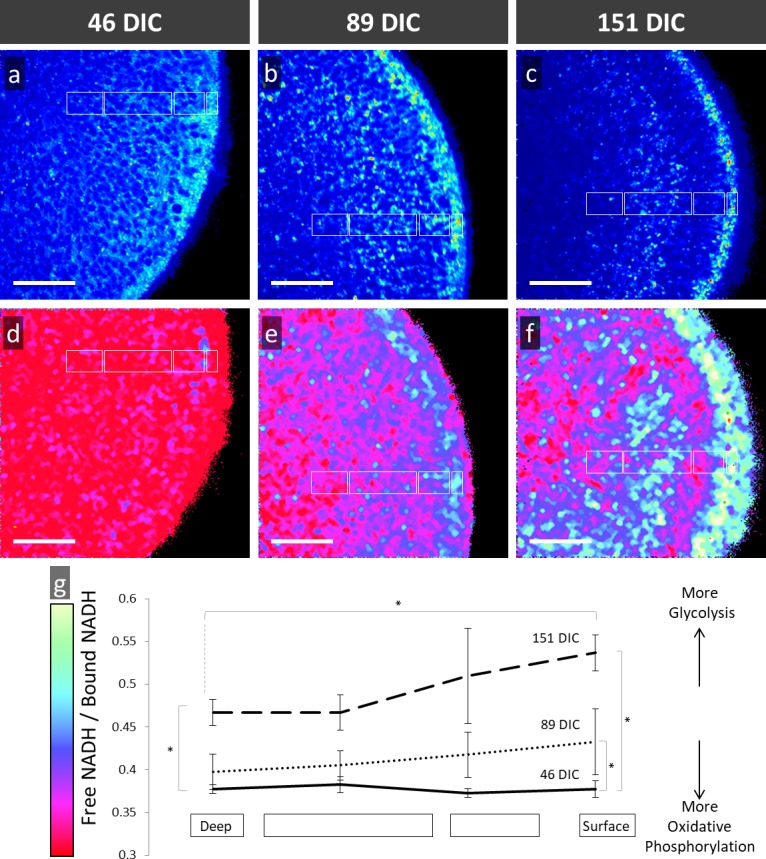
FLIM analysis of hESC-derived retinal organoids at (A, D) 46 DIC, (B, E) 89 DIC, and (C, F) 151 DIC imaged by 2-photon autofluorescence microscopy and then assessed using phasor analysis of fluorescent lifetimes for NADH. (A–C) Autofluorescent images and (D–F) pseudocolor-rendered images based on color coding from the phasor histograms demonstrates metabolic progression from a uniform lifetime signature to a lamellar structure. (G) Quantitative analysis of free/bound NADH at different surface levels and ages with error bars representing standard deviation. Asterisks, time points and relative depth of regions sampled with statistically significant difference in free/bound NADH. Scale bars: 50 μm.
Phasor analysis of the FLIM images showed regions with higher free/bound NADH ratios (Figs. 7D–F, shown in yellow and green), which correlates with greater glycolytic activity, and regions with lower free/bound NADH ratios (Figs. 7D–F), shown in red and maroon), which correlates with greater oxidative phosphorylation.20,23,33–35 FLIM phasor analysis of 46-, 89-, and 151-DIC organoids revealed a temporal change in the free/bound NADH ratio during maturation. 46-DIC organoids exhibited a homogenous pattern with low free/bound NADH ratios which correlates with higher oxidative phosphorylation activity (Fig. 7D). We found that 151-DIC organoids exhibited a core with low free/bound NADH ratios, but a surface with high free/bound NADH ratios, which correlates with greater glycolytic metabolism (Figs. 7F, 7G). In the more mature (151 DIC) organoids, the glycolytic region correlates with the outer organoid staining for photoreceptor markers (Figs. 3C, 3F) and concentrated retinol (Fig. 6F).
In order to quantitate metabolic differences during retinal organoid development, FLIM was performed at four different depths of four organoids of each age. The mean ratio of free/bound NADH was determined in four ROIs (white boxes in Figs. 7D–F) defined by the anatomic structure of mature organoids and compared to ROIs of equal size, shape, and orientation in younger organoids. Reproducible and statistically significant age- and position-dependent changes in the free/bound NADH ratio were observed (Fig. 7G). There was a progression of the organoid surface to higher free/bound NADH ratios while the core of the organoid continued to display lower free/bound NADH ratios. These data indicate that maturing organoids develop an outer surface composed of cells that have increased glycolytic metabolism, which colocalizes with photoreceptors containing retinol and retinoic acid. Retinal organoids that are iPSC-derived also develop lamellae with an outer layer signals correlating with increased glycolytic metabolism (Supplementary Fig. S5).
Discussion
The goal of this work was to evaluate live imaging methods for structural and functional assessment of stem cell–derived retinal organoid growth. To this end, we imaged live retinal organoids using several modalities and correlated our findings with established microscopy techniques. Multimodal live imaging revealed a dynamically changing retinal organoid structure, retinal differentiation, and metabolic state, all discerned without disrupting retinal organoid growth.
After live imaging, histologic staining and immunostaining of retinal markers were performed to provide information about organoid cellular and biochemical organization to which live imaging findings were compared. Hematoxylin and eosin staining revealed the formation of cellular lamella as retinal organoids matured. Immunostaining revealed a decline in VSX2 retinal progenitor cells and a transition to postmitotic retinal cell types as previously described.8 Contrast-enhanced microCT was performed but did not reveal cellular organization such as retinal lamellae.
We compared retinal organoid live imaging using phase contrast microscopy, OCT, autofluorescence microscopy, HSpec, and FLIM. Phase contrast microscopy is easily accessible and useful for detection of developing retinal organoid neuroepithelium, but failed to reveal microstructural and functional features. OCT benefits clinical ophthalmology through its ability to define retinal lamellar structure.36–38 We observed a hypointense band in 151 DIC organoids, albeit at limited contrast and only in areas perpendicular to the scanning laser beam. Based on its position ∼25 μm from the apparent surface, this band could plausibly represent the compacted nuclear layer evident in hematoxylin and eosin staining or the interface of that layer with the one below. Limitations of OCT included distal shadowing as the OCT laser signal penetrates the specimen and image variability with orientation of the scanning laser, as described for OCT analysis of retinal layers in vivo.39,40 However, this study utilized clinical OCT devices not optimized for in vitro studies, and future OCT microscopes may yield more informative images. Autofluorescence microscopy was utilized as an adjunct to HSpec and enabled detection of retinal organoid lamella, but did not provide cellular function information.
We found that HSpec and FLIM add information about cellular function to high-resolution structural imaging. Photodamage and phototoxicity using multiphoton microscopy has been shown to be negligible using similar imaging parameters.20,23 The phasor approach to analyzing autofluorescence enables localization of specific biomolecules to specific subcellular locations. Phasor analyses with HSpec and FLIM rely on decomposition of fundamentally different autofluorescent signal information, which provide complementary subcellular information.10,11,16,21–23,30 In addition, HSpec and FLIM can be performed rapidly to assess organoid development within minutes as compared with conventional histology techniques that require hours to days. While this study used different batches of stem cell derived organoids, rather than following the same batch of organoids over months, the similar results obtained with different hESC and iPSC preparations suggest that batch effects do not significantly influence the findings.
Using these approaches, we observed that maturing retinal organoids develop lamellar structures with specific nuclear layers reminiscent of the fully developed retina. The more mature organoids have a lamellar structure on FLIM and HSpec that show a retinol-dense outer layer with a higher free/bound NADH ratio indicative of greater glycolytic metabolism (Figs. 6, 7). This outer layer corresponds to the developing photoreceptors based upon CRX expression (Fig. 3), which indicates that retinal organoid photoreceptors have increased glycolytic activity and high retinol and retinoic acid levels. The increased glycolytic activity of retinal organoid photoreceptor layer is consistent with the glycolytic enzyme localization previously demonstrated in photoreceptors by high resolution proteomic analysis41 and rod outer segment anaerobic enzyme activity.42 FLIM of 151 DIC retinal organoids (Fig. 7F) shows a dense layer of glycolytic activity near the outer surface; however, higher resolution imaging is needed to determine whether this corresponds to developing photoreceptor inner segments where glycolytic enzymes are most highly concentrated in vivo.41 Given the high level of some glycolytic enzymes in photoreceptors compared to other areas of the retina41 it seems that the glycolytic-like signature is likely a specialization of differentiated photoreceptors, not something limited to undifferentiated cells11,20,23,43 or cells with features of cancer.34,35 Subcellular resolution in HSpec and FLIM might also distinguish between rods and cones based on their differences in retinal metabolism.44
In summary, we characterized stem cell–derived retinal organoids using FLIM, HSpec, OCT, microCT and histologic and immunostaining. With the exception of microCT, each method detected the development of lamellar anatomy as organoids mature, whereas FLIM and HSpec revealed changes in retinol production and metabolic state. Correlation of cell type–specific protein marker expression with metabolic features detected with FLIM and HSpec support the notion that photoreceptors with developmentally appropriate metabolic features can develop from retinal organoids. These live imaging techniques enhance our understanding of metabolic changes during retinal organoid genesis, and provide a noninvasive approach to interrogate engineered tissue systems in basic research and cell therapy settings.
Supplementary Material
Acknowledgments
The authors thank Dominic Shayler and Hannah Hopp of the Vision Center, Children's Hospital Los Angeles for providing retinal organoids, Cullen Barnett and Daniel Garcia of the USC Roski Eye Institute for assistance in OCT, and Maxwell Roth of USC Molecular and Computational Biology for assistance with tissue culture.
Supported in part by NIH Grants R01EY026661 (DC); R21EY025419 (DC, JA); the AB Reins Foundation; the Neonatal Blindness Research Fund (DC, JA); the Larry & Celia Moh Foundation; the Saban Research Institute Small Animal Imaging Core and Stem Cell Analytics Core facilities; the Translational Biomedical Imaging Lab at Children's Hospital Los Angeles; Translational Imaging Center; and an unrestricted departmental grant from Research to Prevent Blindness.
Disclosure: A.W. Browne, None; C. Arnesano, None; N. Harutyunyan, None; T. Khuu, None; J.C. Martinez, None; H.A. Pollack, None; D.S. Koos, None; T.C. Lee, None; S.E. Fraser, None; R.A. Moats, None; J.G. Aparicio, None; D. Cobrinik, None
References
- 1. Hynds RE,, Giangreco A. Concise review: the relevance of human stem cell-derived organoid models for epithelial translational medicine. Stem Cells. 2013; 31: 417–422. [DOI] [PMC free article] [PubMed] [Google Scholar]
- 2. Lancaster MA,, Knoblich JA. Organogenesis in a dish: modeling development and disease using organoid technologies. Science. 2014; 345: 1247125. [DOI] [PubMed] [Google Scholar]
- 3. Fatehullah A,, Tan SH,, Barker N. Organoids as an in vitro model of human development and disease. Nat Cell Biol. 2016; 18: 246–254. [DOI] [PubMed] [Google Scholar]
- 4. Den Hartogh SC,, Passier R. Concise review: fluorescent reporters in human pluripotent stem cells: contributions to cardiac differentiation and their applications in cardiac disease and toxicity. Stem Cells. 2016; 34: 13–26. [DOI] [PubMed] [Google Scholar]
- 5. Nakano T,, Ando S,, Takata N,, et al. Self-formation of optic cups and storable stratified neural retina from human ESCs. Cell Stem Cell. 2012; 10: 771–785. [DOI] [PubMed] [Google Scholar]
- 6. Zhong X,, Gutierrez C,, Xue T,, et al. Generation of three-dimensional retinal tissue with functional photoreceptors from human iPSCs. Nat Commun. 2014; 5: 4047. [DOI] [PMC free article] [PubMed] [Google Scholar]
- 7. Aparicio J,, Shayler D,, Cobrinik D. An emerging technology for retinal disease research and therapy. : Schwartz S,, Nagiel A,, Lanza R, Cellular Therapies for Retinal Disease: A Strategic Approach. New York, New York City: Springer; In Press. [Google Scholar]
- 8. Phillips MJ,, Wallace KA,, Dickerson SJ,, et al. Blood-derived human iPS cells generate optic vesicle-like structures with the capacity to form retinal laminae and develop synapses. Invest Ophthalmol Vis Sci. 2012; 53: 2007–2019. [DOI] [PMC free article] [PubMed] [Google Scholar]
- 9. Meyer JS,, Shearer RL,, Capowski EE,, et al. Modeling early retinal development with human embryonic and induced pluripotent stem cells. Proc Natl Acad Sci U S A. 2009; 106: 16698–16703. [DOI] [PMC free article] [PubMed] [Google Scholar]
- 10. Digman MA,, Caiolfa VR,, Zamai M,, Gratton E. The phasor approach to fluorescence lifetime imaging analysis. Biophys J. 2008; 94: L14–L16. [DOI] [PMC free article] [PubMed] [Google Scholar]
- 11. Stringari C,, Cinquin A,, Cinquin O,, Digman MA,, Donovan PJ,, Gratton E. Phasor approach to fluorescence lifetime microscopy distinguishes different metabolic states of germ cells in a live tissue. Proc Natl Acad Sci U S A. 2011; 108: 13582–13587. [DOI] [PMC free article] [PubMed] [Google Scholar]
- 12. Smith RT,, Post R,, Johri A,, et al. Simultaneous decomposition of multiple hyperspectral data sets: signal recovery of unknown fluorophores in the retinal pigment epithelium. Biomed Opt Exp. 2014; 5: 4171–4185. [DOI] [PMC free article] [PubMed] [Google Scholar]
- 13. Lu G,, Fei B. Medical hyperspectral imaging: a review. J Biomed Opt. 2014; 19: 10901. [DOI] [PMC free article] [PubMed] [Google Scholar]
- 14. Huang D,, Swanson EA,, Lin CP,, et al. Optical coherence tomography. Science. 1991; 254: 1178–1181. [DOI] [PMC free article] [PubMed] [Google Scholar]
- 15. Aparicio J,, Hopp H,, Choi A,, et al. Temporal expression of CD184(CXCR4) and CD171(L1CAM) identifies distinct early developmental stages of human retinal ganglion cells in embryonic stem cell derived retina. Exp Eye Res. 2017; 154: 177–189. [DOI] [PMC free article] [PubMed] [Google Scholar]
- 16. Cutrale F,, Salih A,, Gratton E. Spectral Phasor approach for fingerprinting of photo-activatable fluorescent proteins Dronpa, Kaede and KikGR. Methods Appl Fluoresc. 2013; 1: 35001. [DOI] [PMC free article] [PubMed] [Google Scholar]
- 17. Cutrale F,, Trivedi V,, Trinh L,, Artiga M,, Choi J,, Fraser S. A robust method for multiplexing hyper-spectral fluorescent signals in vivo. Nat Meth. In Press. [Google Scholar]
- 18. Arnesano C,, Santoro Y,, Gratton E. Digital parallel frequency-domain spectroscopy for tissue imaging. J Biomed Opt. 2012; 17: 96014. [DOI] [PMC free article] [PubMed] [Google Scholar]
- 19. Sun Y,, Day RN,, Periasamy A. Investigating protein-protein interactions in living cells using fluorescence lifetime imaging microscopy. Nat Protoc. 2011; 6: 1324–1340. [DOI] [PMC free article] [PubMed] [Google Scholar]
- 20. Stringari C,, Nourse JL,, Flanagan LA,, Gratton E. Phasor fluorescence lifetime microscopy of free and protein-bound NADH reveals neural stem cell differentiation potential. PLoS One. 2012; 7: e48014. [DOI] [PMC free article] [PubMed] [Google Scholar]
- 21. Wright BK,, Andrews LM,, Jones MR,, Stringari C,, Digman MA,, Gratton E. Phasor-FLIM analysis of NADH distribution and localization in the nucleus of live progenitor myoblast cells. Microsc Res Tech. 2012; 75: 1717–1722. [DOI] [PMC free article] [PubMed] [Google Scholar]
- 22. Wright BK,, Andrews LM,, Markham J,, et al. NADH distribution in live progenitor stem cells by phasor-fluorescence lifetime image microscopy. Biophys J. 2012; 103: L7–L9. [DOI] [PMC free article] [PubMed] [Google Scholar]
- 23. Stringari C,, Edwards RA,, Pate KT,, Waterman ML,, Donovan PJ,, Gratton E. Metabolic trajectory of cellular differentiation in small intestine by phasor fluorescence lifetime microscopy of NADH. Sci Rep. 2012; 2: 568. [DOI] [PMC free article] [PubMed] [Google Scholar]
- 24. Degenhardt K,, Wright AC,, Horng D,, Padmanabhan A,, Epstein JA. Rapid 3D phenotyping of cardiovascular development in mouse embryos by micro-CT with iodine staining. Circ Cardiovasc Imaging. 2010; 3: 314–322. [DOI] [PMC free article] [PubMed] [Google Scholar]
- 25. Metscher BD. MicroCT for comparative morphology: simple staining methods allow high-contrast 3D imaging of diverse non-mineralized animal tissues. BMC Physiol. 2009; 9: 11. [DOI] [PMC free article] [PubMed] [Google Scholar]
- 26. Kaewkhaw R,, Kaya KD,, Brooks M,, et al. Transcriptome dynamics of developing photoreceptors in three-dimensional retina cultures recapitulates temporal sequence of human cone and rod differentiation revealing cell surface markers and gene networks. Stem Cells. 2015; 33: 3504–3518. [DOI] [PMC free article] [PubMed] [Google Scholar]
- 27. Provis JM,, Penfold PL. Cell death and the elimination of retinal axons during development. Prog Neurobiol 1988; 31: 331–347. [DOI] [PubMed] [Google Scholar]
- 28. Bahr M. Live or let die - retinal ganglion cell death and survival during development and in the lesioned adult CNS. Trends Neurosci. 2000; 23: 483–490. [DOI] [PubMed] [Google Scholar]
- 29. Filho CAdAG, Yehoshua Z, Gregori G, Puliafito CA, Rosenfeld PJ. Optical coherence tomography. : Ryan SJ,, Schachat A,, Wilkinson C,, Hinton D,, Sadda S,, Wiedemann P, Retina. Oxford: Saunders Elsevier; 2013: 85–87. [Google Scholar]
- 30. Cutrale F,, Trivedi V,, Trinh LA,, et al. Hyperspectral phasor analysis enables multiplexed 5D in vivo imaging. Nat Methods. 2017; 14: 149–152. [DOI] [PubMed] [Google Scholar]
- 31. Heikal AA. Intracellular coenzymes as natural biomarkers for metabolic activities and mitochondrial anomalies. Biomark Med. 2010; 4: 241–263. [DOI] [PMC free article] [PubMed] [Google Scholar]
- 32. Muller J,, Yan C,, Enrico G. Biophotonics, Part B. San Diego, CA: Elsevier; 2003. [Google Scholar]
- 33. Ghukasyan VV,, Heikal AA. Natural Biomarkers for Cellular Metabolism: Biology, Techniques, and Applications. Boca Raton, FL: CRC Press; 2015. [Google Scholar]
- 34. Skala MC,, Riching KM,, Gendron-Fitzpatrick A,, et al. In vivo multiphoton microscopy of NADH and FAD redox states, fluorescence lifetimes, and cellular morphology in precancerous epithelia. Proc Natl Acad Sci U S A. 2007; 104: 19494–19499. [DOI] [PMC free article] [PubMed] [Google Scholar]
- 35. Skala MC,, Riching KM,, Bird DK,, et al. In vivo multiphoton fluorescence lifetime imaging of protein-bound and free nicotinamide adenine dinucleotide in normal and precancerous epithelia. J Biomed Opt. 2007; 12: 024014. [DOI] [PMC free article] [PubMed] [Google Scholar]
- 36. Avila C,, Santorelli J,, Mathai J,, et al. Anatomy of the fetal membranes using optical coherence tomography: part 1. Placenta. 2014; 35: 1065–1069. [DOI] [PubMed] [Google Scholar]
- 37. Gurjarpadhye AA,, DeWitt MR,, Xu Y,, Wang G,, Rylander MN,, Rylander CG. Dynamic assessment of the endothelialization of tissue-engineered blood vessels using an optical coherence tomography catheter-based fluorescence imaging system. Tissue Eng Part C Methods. 2014; 21: 758–766. [DOI] [PMC free article] [PubMed] [Google Scholar]
- 38. Woonggyu J,, Bunsho K,, Kelly KM,, Liaw LHL,, Nelson JS,, Zhongping C. Optical coherence tomography for in vitro monitoring of wound healing after laser irradiation. IEEE J Sel Top Quantum Electron. 2003; 9: 222–226. [Google Scholar]
- 39. Otani T,, Yamaguchi Y,, Kishi S. Improved visualization of Henle fiber layer by changing the measurement beam angle on optical coherence tomography. Retina. 2011; 31: 497–501. [DOI] [PubMed] [Google Scholar]
- 40. Ouyang Y,, Walsh AC,, Keane PA,, Heussen FM,, Pappuru RK,, Sadda SR. Different phenotypes of the appearance of the outer plexiform layer on optical coherence tomography. Graefes Arch Clin Exp Ophthalmol. 2013; 251: 2311–2317. [DOI] [PubMed] [Google Scholar]
- 41. Reidel B,, Thompson JW,, Farsiu S,, Moseley MA,, Skiba NP,, Arshavsky VY. Proteomic profiling of a layered tissue reveals unique glycolytic specializations of photoreceptor cells. Mol Cell Proteomics. 2011; 10:M110 002469. [DOI] [PMC free article] [PubMed] [Google Scholar]
- 42. Hsu SC,, Molday RS. Glucose metabolism in photoreceptor outer segments. Its role in phototransduction and in NADPH-requiring reactions. J Biol Chem. 1994; 269: 17954–17959. [PubMed] [Google Scholar]
- 43. Stringari C,, Sierra R,, Donovan PJ,, Gratton E. Label-free separation of human embryonic stem cells and their differentiating progenies by phasor fluorescence lifetime microscopy. J Biomed Opt. 2012; 17: 046012. [DOI] [PMC free article] [PubMed] [Google Scholar]
- 44. Miyazono S,, Shimauchi-Matsukawa Y,, Tachibanaki S,, Kawamura S. Highly efficient retinal metabolism in cones. Proc Natl Acad Sci U S A. 2008; 105: 16051–16056. [DOI] [PMC free article] [PubMed] [Google Scholar]
Associated Data
This section collects any data citations, data availability statements, or supplementary materials included in this article.


