Significance
Mitochondrial functions depend on the steep H+ electrochemical gradient (ΔμH+) across their inner membrane. The available tools for controlling this gradient are essentially limited to inhibitors of the respiratory chain or of the H+ ATPase or to uncouplers, poisons plagued by important side effects and that lack both cell and spatial specificity. We show here that, by transfecting cells with the cDNA encoding channelrhodopsins specifically targeted to the inner mitochondrial membrane, we can obtain an accurate and spatially confined, light-dependent control of mitochondrial membrane potential and, as a consequence, of a series of mitochondrial activities ranging from electron transport to ATP synthesis and Ca2+ signaling.
Keywords: mitochondria, optogenetic, mitochondrial membrane potential, Ca2+ signaling
Abstract
Key mitochondrial functions such as ATP production, Ca2+ uptake and release, and substrate accumulation depend on the proton electrochemical gradient (ΔμH+) across the inner membrane. Although several drugs can modulate ΔμH+, their effects are hardly reversible, and lack cellular specificity and spatial resolution. Although channelrhodopsins are widely used to modulate the plasma membrane potential of excitable cells, mitochondria have thus far eluded optogenetic control. Here we describe a toolkit of optometabolic constructs based on selective targeting of channelrhodopsins with distinct functional properties to the inner mitochondrial membrane of intact cells. We show that our strategy enables a light-dependent control of the mitochondrial membrane potential (Δψm) and coupled mitochondrial functions such as ATP synthesis by oxidative phosphorylation, Ca2+ dynamics, and respiratory metabolism. By directly modulating Δψm, the mitochondria-targeted opsins were used to control complex physiological processes such as spontaneous beats in cardiac myocytes and glucose-dependent ATP increase in pancreatic β-cells. Furthermore, our optometabolic tools allow modulation of mitochondrial functions in single cells and defined cell regions.
Mitochondria play a critical role in all nucleated eukaryotic cells by producing ATP, actively participating in intracellular Ca2+ signaling, and modulating cell viability (1–3). All these functions are driven by the H+ electrochemical gradient (ΔμH+) across the inner mitochondrial membrane (IMM), which is generated by the extrusion of protons from the mitochondrial matrix through respiratory chain complexes (4).
Currently, tools for modulating mitochondrial metabolism and functions in whole cells and tissues are limited to metabolic poisons and protonophores, which in general act slowly and often irreversibly. In addition, they are devoid of cellular specificity (5–10) and cannot be used for fine-tuning of mitochondrial membrane potential within a single cell.
Heterologous expression of light-gated, cation-selective microbial ion channels (channelrhodopsins) on the plasma membrane (PM) of mammalian cells is widely used as a reversible optogenetic strategy to control membrane potential with high spatiotemporal precision (11, 12). Because metabolic activity and signaling by mitochondria are powered by the potential across their IMM, optogenetic channels may provide selective tools for interrogating diverse mitochondrial functions. However, rerouting these channels to the mitochondria can be challenging. Moreover, the functional incorporation of channelrhodopsins into the IMM and their biophysical properties may be altered by the unique phospholipid composition and by the large (∼−180 mV) electrical potential across this membrane. Seeking a strategy to control mitochondrial functions, we sought to determine whether channelrhodopsins can be targeted to the IMM and thereby provide a light-dependent control of mitochondrial membrane potential and coupled physiological functions.
Results
Targeting of Channelrhodopsins to the IMM.
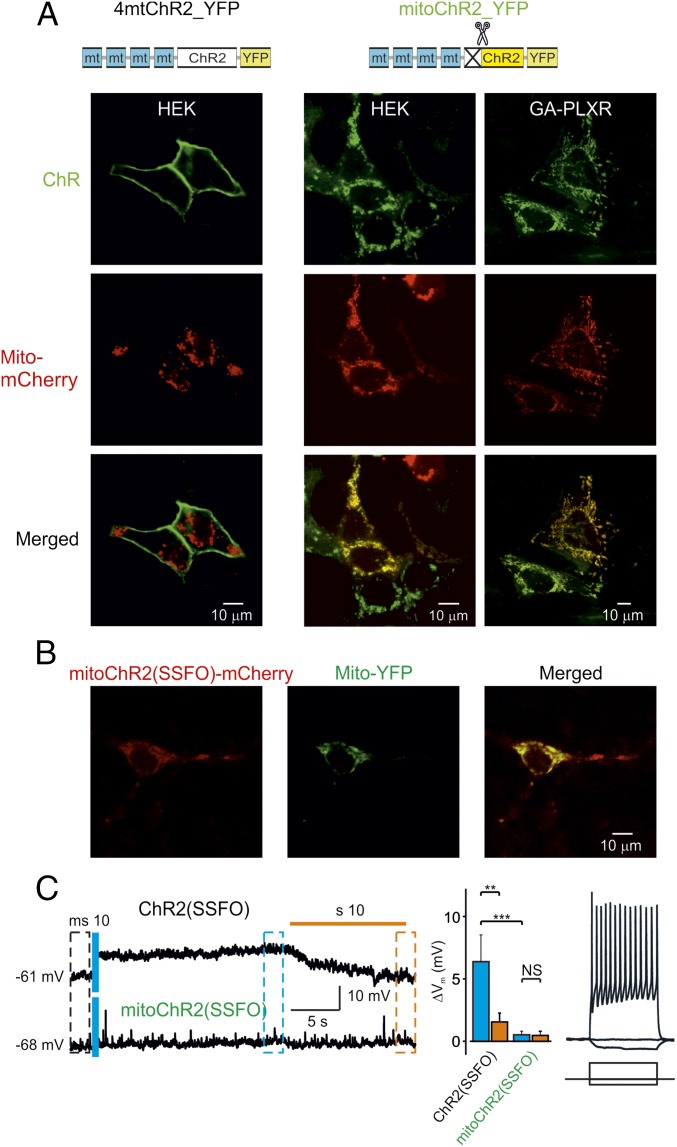
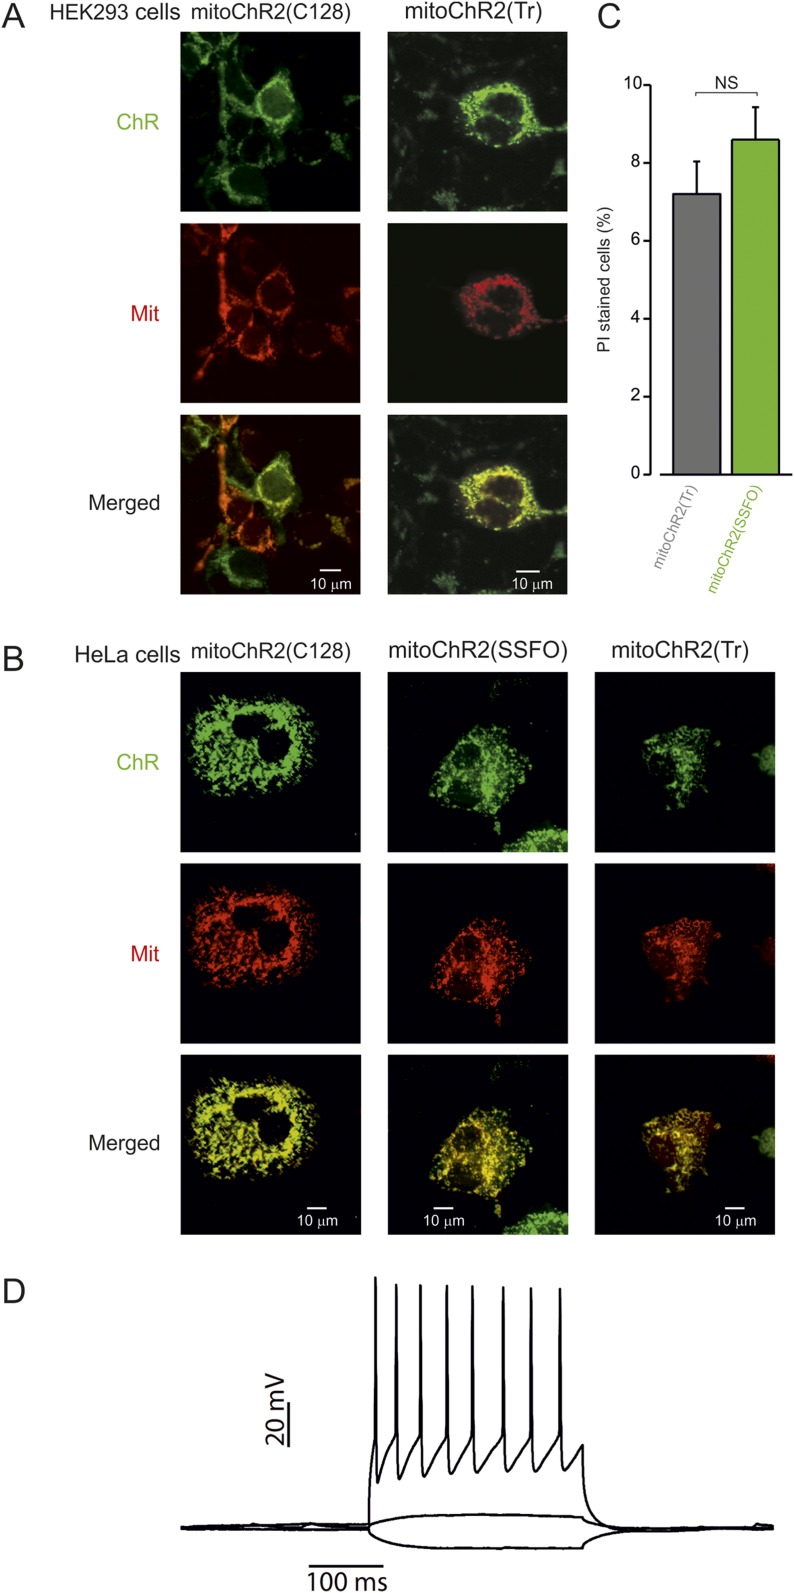
First, we tested the mitochondrial localization of YFP-tagged channelrhodopsin 2 (ChR2-YFP) (13) containing, at the N terminus, four repeats of the mitochondria-targeting sequence of subunit VIII of human cytochrome c oxidase (Cox-8) (4mt; Fig. 1A). Although this sequence was successfully used to target several proteins to mitochondria (14, 15), when applied to ChR2 the chimeric constructs failed to reach the mitochondria and were predominantly localized to the PM of HEK293T cells (Fig. 1A, Left). However, we found that a ChR2 sequence that is devoid of the first 24 residues and fused at the N terminus to a tandem of four repeats of the Cox-8 mitochondria-targeting peptide (4mt) efficiently localized to mitochondria in both HEK293T cells (Fig. 1A, Middle) and human melanoma GA cells (Fig. 1A, Right). This modified ChR2 (hereafter called mitoChR2) exclusively labeled rod-type discrete intracellular structures and colocalized with a mitochondria-targeted red fluorescent protein from Discosoma (Mito-mCherry; Fig. 1A). We found that also other ChR2 variants, including the slowly inactivating ChR2 [C128A/H134R, termed mitoChR2(C128) (16); Fig. S1 A and B], truncated version [mitoChR2(Tr); see below for details; Fig. S1 A and B], and stabilized step-function opsin [ChR2(C128S/D156A), termed mitoChR2(SSFO) (17); Fig. 1B and Fig. S1B] were similarly targeted to the mitochondria in various cell types when engineered in the same way, as described in Fig. 1A. Cell viability was not affected by the expression of mitoChR2(SSFO)-expressing HEK293T cells (Fig. S1C). Similar to other cell types, colocalization was observed in neurons cotransfected with an mCherry-tagged form of mitoChR2(SSFO) and with a YFP targeted to the mitochondria (Mito-YFP) (Fig. 1B). To determine whether residual mitoChR2(SSFO) channels were still present at the PM, we performed whole-cell current-clamp recordings in neurons (Fig. 1C). Illumination with blue light elicited membrane depolarization in neurons expressing the PM-targeted ChR2(SSFO). In contrast, neurons transfected with mitoChR2(SSFO) did not show any significant change in membrane voltage upon illumination (Fig. 1C, Left) as compared with control cells (Fig. S1D), similar to what was observed previously (16, 17) in nontransfected neurons subjected to blue light illumination. Delivery of hyperpolarizing and depolarizing current pulses to the mitoChR2(SSFO)-expressing cells via the whole-cell patch pipette indicated that their firing pattern and passive cell characteristics are unchanged compared with control cells (16, 17) (Fig. 1C, Right).
Fig. 1.
Rerouting ChR2 from the plasma membrane to the mitochondria. (A) Confocal images of cells coexpressing a fusion construct of four mitochondria-targeting peptides (Cox-8 4mt) with either the full-length (4mtChR2; Left) or 24-residue N-terminal truncated sequence of ChR2-YFP (mitoChR2; Middle Right) and a mitochondria-targeted Mito-mCherry. A schematic structure of the constructs is shown (Top). Yellow color indicates colocalization of the mitochondrial marker and mitoChR2. (B) Confocal images of neurons coexpressing mitoChR2(SSFO)-mCherry and Mito-YFP. (C) In hippocampal neurons, mitoChR2(SSFO) does not interfere with PM electrical properties. (C, Left) Representative current-clamp recordings from cells expressing mitoChR2(SSFO) or the plasma membrane-targeted ChR2(SSFO). The difference in membrane potential between neurons transfected with ChR2(SSFO) and mitoChR2(SSFO), −61 and −68 mV, respectively, is within the variability observed in different control neurons. As indicated, a short blue light pulse was applied for excitation (470 nm, 10 ms) and an orange light pulse (590 nm, 10 s) was applied for deactivation of the microbial rhodopsins. (C, Middle) Average voltage changes due to rhodopsin activation (blue bars) and inactivation (orange bars), calculated between times indicated by black, blue, and orange dashed boxes (Left) (n = 8). (C, Right) In mitoChR2(SSFO)-expressing neurons, current pulses delivered via the somatic patch pipette elicited either hyperpolarization or repetitive firing, indicating that the passive and active neuronal properties are intact. Data are presented as mean ± SEM. **P < 0.01, ***P < 0.001; NS, not significant.
Fig. S1.
Mitochondrial localization of mitoChR2 variants in different cell lines. Confocal images of HEK293T (A) and HeLa (B) cells expressing mitoChR2(SSFO; C128 and truncated) YFP-tagged constructs (green) and Mito-mCherry (red), as indicated. Yellow color indicates colocalization of the mitochondrial marker and the channel. Viability of cells expressing mitoChR2(SSFO) or controls (vector only) that were illuminated for 10 s with blue light (2 mW/mm2) and stained with PI 30 min after photoactivation. Data are presented as mean ± SEM (C). No difference in the number of dead cells was observed (n > 70) in cells expressing mitoChR2(SSFO) compared with mitoChR2(Tr). NS, not significant. In control vector transfected cells (D), current pulses delivered via the somatic patch pipette elicited either hyperpolarization or repetitive firing, which is similar to those in mitoChR2(SSFO)-expressing neurons (Fig. 1C).
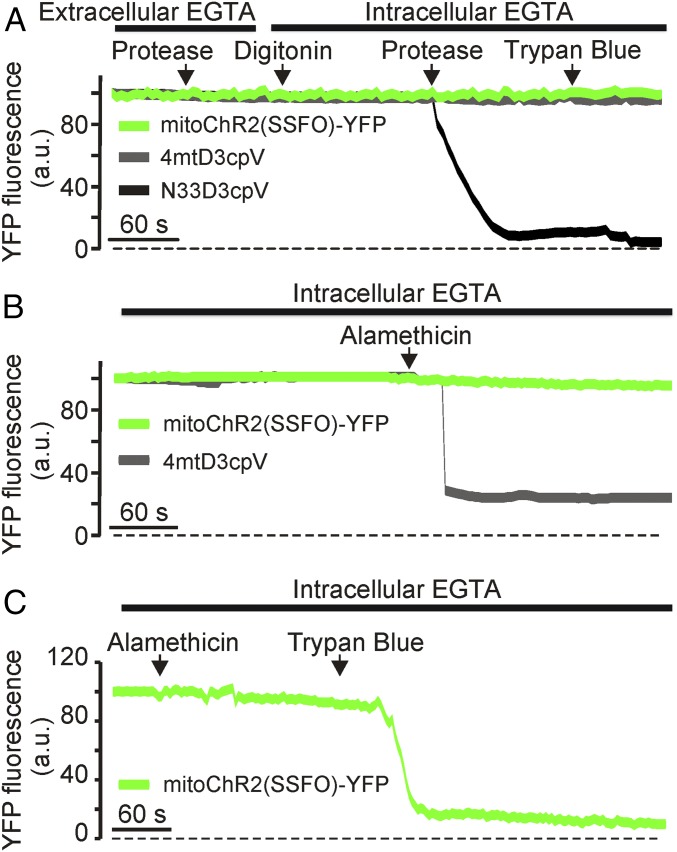
To confirm the mitochondrial localization of mitoChR2(SSFO)-YFP and determine whether it reaches the IMM maintaining its correct topology, we performed fluorescence quenching experiments in digitonin-permeabilized HeLa cells before and after treatment with proteinase K and/or trypan blue. This protocol, previously developed to localize Ca2+-sensitive GFP-based indicators targeted to different mitochondrial compartments (18), is based on the use, in digitonin-permeabilized cells, of the enzyme proteinase K (which can cleave GFP when it is exposed to the cytosolic surface of mitochondria) and the dye trypan blue, which quenches the GFP fluorescent signal if the protein is exposed to the cytosol or is located in the intermembrane space but not when localized in the matrix. Proteinase K had no effect on cells expressing either mitoChR2(SSFO)-YFP or the mitochondrial matrix marker 4mtD3cpv (14), but triggered a drop in the fluorescence of the outer mitochondrial membrane (OMM) marker N33D3cpv (18) (Fig. 2A). Trypan blue had no effect on mitoChR2(SSFO)-YFP, as expected, whereas it has been shown to quench the fluorescence of N33D3cpv, a GFP-based probe localized on the cytosolic surface of the OMM (18). Perfusion of digitonin-treated cells with alamethicin, which permeabilizes both the OMM and the IMM to high molecular weight solutes (19, 20), resulted in a complete loss of 4mtD3cpv-associated fluorescence (Fig. 2B) without affecting mitoChR2(SSFO)-YFP fluorescent signal. However, the YFP signal was quenched by perfusing trypan blue after alamethicin treatment, indicating the presence of the YFP-tagged C terminus of mitoChR2(SSFO) within the mitochondrial matrix (Fig. 2C; see also SI Materials and Methods). Altogether, our data confirm the localization of mitoChR2(SSFO)-YFP to the IMM and its topology as an integral membrane protein with the C terminus facing the matrix side.
Fig. 2.
Targeting of mitoChR2(SSFO)-YFP to the inner mitochondrial membrane. Representative YFP fluorescence traces of the indicated constructs and experimental procedures. (A) YFP fluorescence monitored in HeLa cells expressing mitoChR2(SSFO)-YFP, the outer mitochondrial membrane marker N33D3cpv, or the matrix-localized 4mtD3cpv. Where indicated, cells were treated with protease (proteinase K; 20 μg/μL), digitonin (100 μM), and trypan blue (0.5 mg/mL). (B) Cells expressing mitoChR2(SSFO)-YFP or 4mtD3cpv were permeabilized with digitonin. Where indicated, alamethicin (20 μg/μL) was added. (C) To verify that mitoChR2(SSFO)-YFP was correctly folded and the YFP faced the matrix, after permeabilization and alamethicin treatment trypan blue was used to quench YFP fluorescence. a.u., arbitrary units.
Light-Dependent Control of Mitochondrial Membrane Potential.
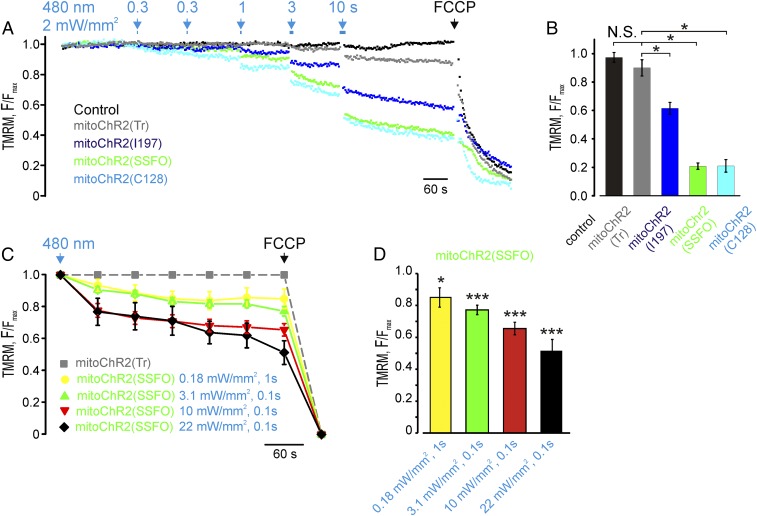
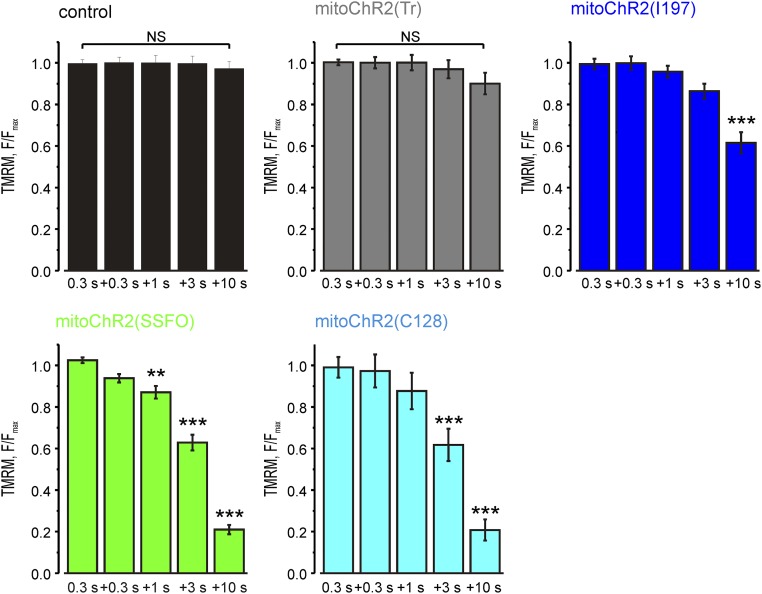
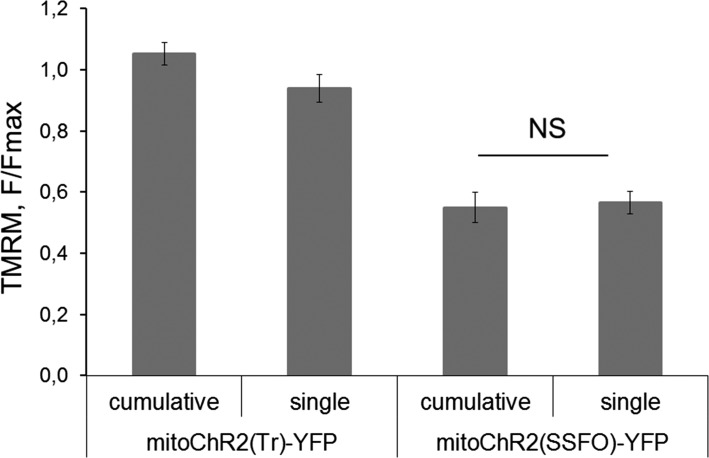
Next, we asked whether the mitochondrial membrane potential (Δψm) in mitoChR2-expressing cells could be controlled by light. We predicted that a prolonged opening and high conductance of heterologously expressed mitoChR2 would be required to counteract the large mitochondrial membrane potential that is maintained by the pumping of H+ through the electron transport chain. We therefore initially used two different step-function channelrhodopsins, mitoChR2(SSFO) (17) and mitoChR2(C128) (16), in HEK293T cells. As controls, we used cells transfected with empty vector or with a mitochondria-targeted nonfunctional variant of the channel, truncated of transmembrane domains 6 and 7, which is essential for the retinal-binding region, termed mitoChR2(Tr) (21). As an additional control, we used a mitochondria-targeted I197S point mutant with lower ion conductance [mitoChR2(I197) (22)]. We show that blue light pulses (2 mW/mm2) of various duration elicited a time-dependent decrease in Δψm in both mitoChR2(SSFO)- and mitoChR2(C128)-expressing cells, as measured by tetramethylrhodamine methyl ester (TMRM) (23) (Fig. 3 A and B and Fig. S2). Notably, sequential photoactivation stimuli induced a depolarization of up to ∼80% of the fluorescence drop caused by the mitochondrial uncoupler FCCP. Consistent with its lower activity, a much smaller change in Δψm was monitored in cells expressing the partially inactive mitoChR2(I197). No light-dependent depolarization was observed in cells expressing the nonfunctional mitoChR2(Tr) or in cells transfected with an empty vector, indicating that the conductance of light-activated mitoChR2 channels is able to elicit changes in Δψm. To test whether a single light pulse of 10 s or multiple light pulses can exert a different effect on mitochondrial Δψ, HeLa cells expressing mitoChR2(SSFO)-YFP or mitoChR2(Tr)-YFP, as control, were photoactivated with a single pulse of blue light for 10 s or in a cumulative way with multiple pulses (1, 3, and 6 s). No significant difference was found in the extent of depolarization with the two different photoactivation protocols (Fig. S3).
Fig. 3.
Light-dependent changes of Δψm in cells expressing the optometabolic constructs. (A) Representative traces of Δψm changes in single HEK293T cells expressing different mitoChR2 constructs and loaded with TMRM. Changes in Δψm are elicited by blue light exposures (2 mW/mm2; arrows) of the indicated duration. TMRM-based kinetics are expressed as F/Fmax, where F is the fluorescence signal at each time point and Fmax is the fluorescence at time 0. Both F and Fmax are subtracted of the fluorescence after FCCP application. (B) Mean F/Fmax (±SEM; n = 17 cells) changes elicited by the series of blue light pulses (see analysis for all intervals in Fig. S2). (C) Mean traces (±SEM; n = 16, 54, 37, and 23, respectively) of Δψm changes in single HeLa cells expressing mitoChR2(SSFO) (green) or mitoChR2(Tr) (gray) exposed to blue light pulses of the indicated irradiance and duration. The photoactivation was performed with the FRAP module (for details, see Materials and Methods). TMRM-based kinetics are expressed as F/Fmax. To exclude bleaching contribution caused by the focalized blue laser, TMRM fluorescence of HeLa cells expressing mitoChR2(SSFO)-YFP was normalized to the fluorescence of mitoChR2(Tr)-YFP–expressing cells for each time point. Both F and Fmax are subtracted of the fluorescence after FCCP application. (D) The bar graph reports the mean change of F/Fmax (±SEM; n = 16, 54, 37, and 23, respectively) values for mitoChR2(SSFO) cells normalized to corresponding values for mitoChR2(Tr)-expressing cells, 5 min after photoactivation. *P < 0.05, ***P < 0.001. NS, not significant.
Fig. S2.
Quantification of the membrane potential signal changes elicited by light illumination (as marked) in cells expressing the indicated constructs (see representative traces in Fig. 3A); n > 17 cells for each condition. Data are presented as mean ± SEM. **P < 0.01, ***P < 0.001. NS, not significant.
Fig. S3.
Effect of a single light pulse or cumulative photoactivation on Δψm in HeLa cells. Mean ± SEM F/Fmax of Δψm in HeLa cells expressing mitoChR2(SSFO)-YFP or mitoChR2(Tr)-YFP after 8 min from the first light pulse. Changes in Δψm are elicited by blue light exposures (2 mW/mm2; bar) for 10-s (single) or by multiple light pulses for 1, 3, and 6 s (cumulative); n ≥ 9 cells for each condition. NS, not significant.
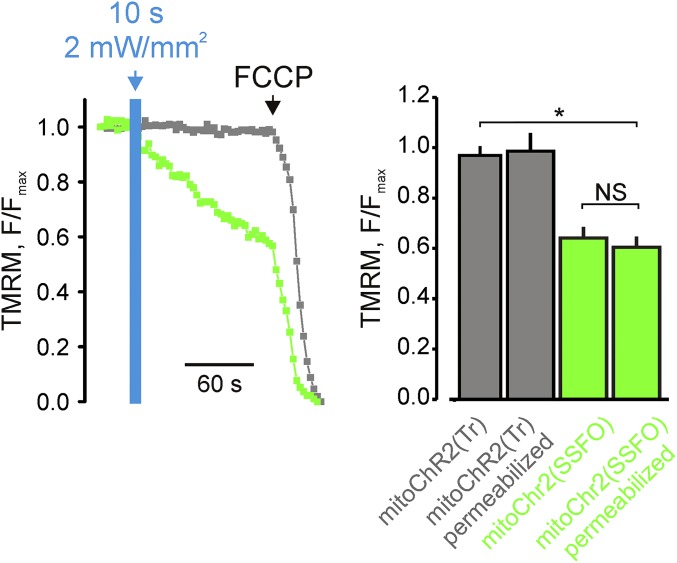
ChR2 channels are known to be highly permeable to H+, but they are also able to conduct other cations, such as Na+, K+, and Ca2+ (13). To investigate mitoChR2(SSFO) cation permeability in situ, digitonin-permeabilized cells expressing mitoChR2(SSFO) were incubated with intracellular sucrose-based medium devoid of Ca2+, Na+, and K+ ions (24) (Fig. S4 and Materials and Methods). The depolarization observed under these conditions was similar to that obtained in intact cells containing physiological K+ and Na+ concentrations, suggesting that mitoChR2(SSFO)-dependent modulation of the mitochondrial membrane potential can be elicited by H+ ions.
Fig. S4.
(Left) Light-dependent change in Δψm in digitonin-permeabilized HEK293T cells expressing mitoChR2(SSFO) (green) or mitoChR2(Tr) (gray) loaded with TMRM and perfused with intracellular Na+- and K+-free solution (Materials and Methods). (Right) Mean amplitude ± SEM of Δψm change in intact or permeabilized cells expressing mitoChR2(SSFO) (green) or mitoChR2(Tr) (gray); n ≥ 71 cells for each condition. *P < 0.05. NS, not significant.
We next sought to determine the effect of varying irradiance intensity and duration on the extent of mitochondrial depolarization. To trigger mitoChR2(SSFO) opening, a single cell in the field of view was illuminated with blue light pulses of the indicated duration and irradiance using a laser-based module designed for FRAP (Materials and Methods for details) and immediately imaged to record TMRM signal (Fig. 3 C and D). Altogether, the data indicated that the mitochondria-targeted ChR2 variants induce light-dependent mitochondrial depolarization of a magnitude consistent with their conductance and gating properties (17).
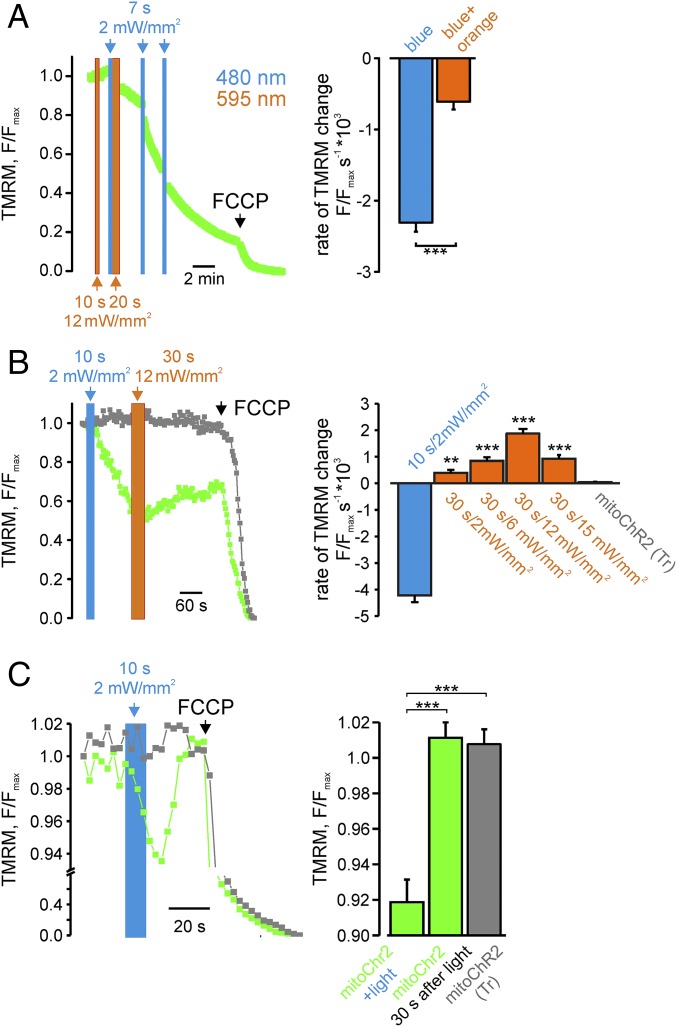
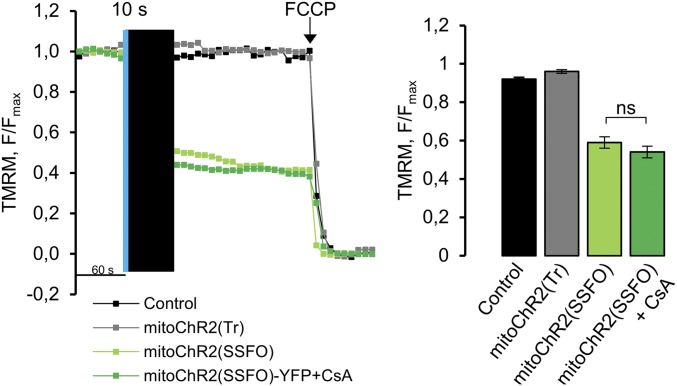
Next, we examined whether, similar to bistable PM-targeted channelrhodopsins, the activation of mitochondrial light-gated channels could be switched off by orange light at 595 nm (17). Illumination of HEK293T cells expressing mitoChR2(SSFO) by orange light (10 s, 12 mW/mm2) did not elicit by itself any change in Δψm (Fig. 4A). In contrast, following opening of the channel with blue light (7 s, 2 mW/mm2), the rate of mitochondrial depolarization was reduced approximately threefold when an orange light pulse (20 s) was used compared with the rate of depolarization with blue light alone (Fig. 4A). Moreover, orange light-dependent repolarization, albeit at a slower rate, was monitored when longer (30 s) orange light pulses were delivered following blue light-dependent depolarization (Fig. 4B), consistent with previous studies documenting the higher energy required for closing ChR2(SSFO) (16, 17). The incomplete recovery of Δψm was not due to changes in the permeability of the mitochondrial inner membrane, namely the opening of the permeability transition pore (PTP) (25), because we did not observe any difference in Δψm upon blue light illumination in the presence or absence of the PTP inhibitor cyclosporine A in HeLa cells (Fig. S5).
Fig. 4.
Light-dependent switching and reversibility of Δψm changes in cells expressing the optometabolic constructs. (A) Δψm changes in single HEK293T cells expressing mitoChR2(SSFO) and subjected to the indicated intermittent blue and orange light (irradiance and duration of illumination as indicated) (Left, representative trace; Right, mean rate ± SEM; n = 7 cells per condition). (B) Partial recovery of Δψm in HEK293T cells expressing mitoChR2(SSFO) following a 30-s-long pulse of orange light (as indicated; green trace). Cells expressing mitoChR2(Tr) exhibited no light-dependent change in Δψm (gray trace) (Left, representative trace; Right, mean rate ± SEM; n ≥ 29 per condition). (C) Recovery of Δψm changes in single HEK293T cells expressing mitoChR2 following a 10-s blue light pulse. (C, Left) Representative TMRM fluorescence traces in mitoChR2(Tr) (gray trace) and in mitoChR2(SSFO)-YFP–expressing cells (green trace). Cells expressing mitoChR2(Tr) exhibited no light-dependent change in Δψm (gray trace). (C, Right) Mean F/Fmax changes (±SEM; n ≥ 16 per condition), calculated after blue light photoactivation. **P < 0.01, ***P < 0.001.
Fig. S5.
PTP inhibition does not affect the extent of mitochondrial depolarization induced by mitoChR2(SSFO) opening. Typical traces of single HeLa cells expressing the mitoChR2(SSFO)-YFP variant with or without the addition of the PTP inhibitor CsA (1 µM), void vector-transfected cells, or cells expressing nonfunctional mitoChR2(Tr). The cells were initially illuminated for 10 s with blue light and then kept in the dark for 1 min (black bar) followed by TMRM excitation. The bar graph represents the mean (±SEM; n ≥ 23 cells per condition) of F/Fmax changes measured 5 min after the blue light pulse, as described in Fig. 4C. NS, not significant.
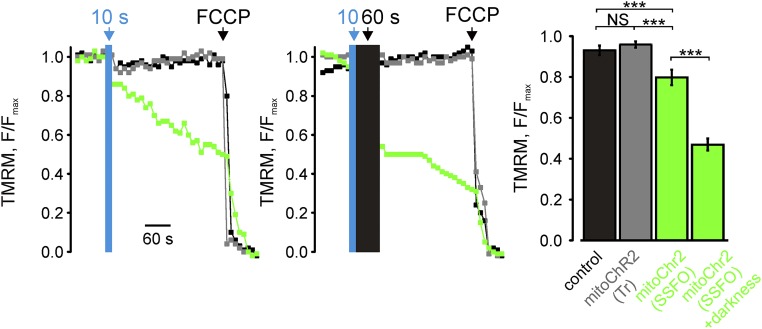
Because a mild deactivation of PM-targeted SSFO can be triggered by green light (17), we reasoned that the depolarization elicited by mitoChR2(SSFO) conductance could be mitigated by partial inactivation of the channel by the light beam used to continuously monitor Δψm (TMRM excitation, 0.2 mW/mm2). Indeed, blue light (10 s) pulses followed by a 60-s dark interval triggered an approximately twofold faster Δψm change compared with cells that were continuously excited for TMRM fluorescence (Fig. S6).
Fig. S6.
Effect of TMRM excitation on mitoChR2(SSFO) opening kinetics. Representative kinetics of Δψm changes in single HeLa cells expressing mitoChR2(SSFO)-YFP (green trace), mitoChR2(Tr)-YFP (gray trace), or empty vector (coexpressing a mitochondrial YFP; black trace). Where indicated, cells were illuminated with a single 10-s blue light pulse of 2 mW/mm2 (Left) or a single 10-s blue light pulse followed by 60 s of darkness (Middle). The bar graph shows mean F/Fmax changes (±SEM; n ≥ 16 per condition), calculated 1 min after blue light photoactivation (Right). ***P < 0.001. NS, not significant.
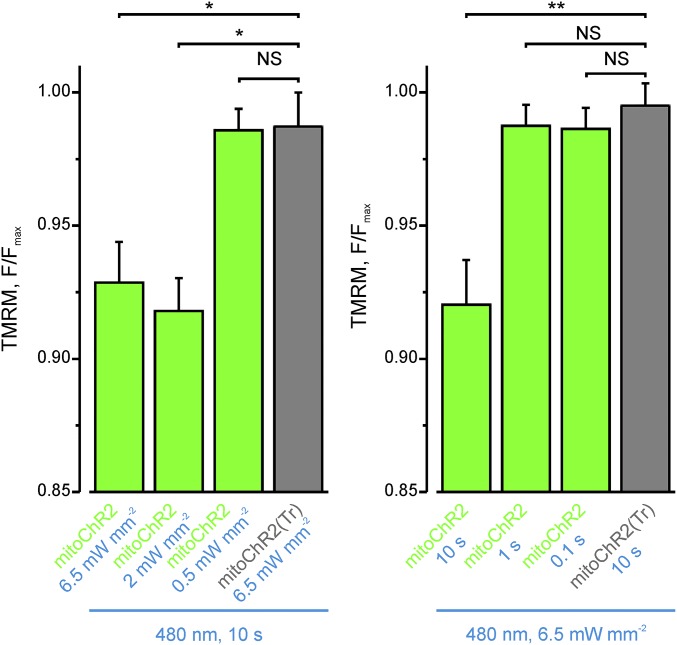
We then tested whether a fast and full recovery could be obtained with the original ChR2 variant (mitoChR2) that deactivates rapidly and spontaneously after blue light cessation (11). Consistent with its faster closure kinetics, excitation of HEK293T cells expressing mitoChR2 with blue light triggered a smaller (∼8% F/Fmax) mitochondrial depolarization (Fig. 4C and Fig. S7). Notably, the mitochondrial membrane potential fully recovered when blue light was terminated.
Fig. S7.
Light intensity and time dependence of Δψm changes in single HEK293T cells expressing mitoChR2 as in Fig. 4C. (Left) Light intensity dependence of the indicated mean TMRM F/Fmax values in mitoChR2(Tr)- (gray bar) and mitoChR2-YFP–expressing cells (green bars); n ≥ 28 cells per condition. (Right) Light time dependence of the indicated mean ± SEM TMRM F/Fmax values in mitoChR2(Tr)- (gray bar) and mitoChR2-YFP–expressing cells (green bars); n ≥ 85 cells per condition. *P < 0.05, **P < 0.01. NS, not significant.
Taken together, our experimental evidence indicates that (i) distinct mitoChR2 variants can induce a light-dependent depolarization of mitochondrial Δψm, which is partially or fully reversible in cells expressing mitoChR2(SSFO) or mitoChR2, respectively; and (ii) the extent of mitochondrial depolarization can be tuned by modulating irradiance and duration of the light pulse.
Light-Dependent Control of Mitochondrial Ca2+ Signaling and Metabolic Activity.
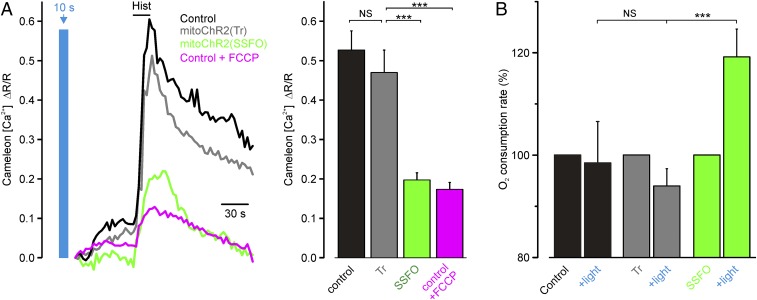
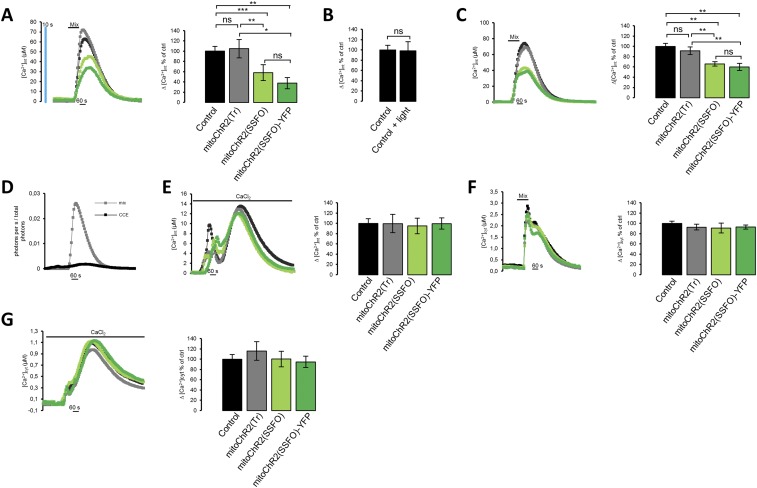
Next, we asked whether mitochondrial Ca2+ uptake, a key mitochondrial function dependent on Δψm, can also be modulated by mitoChR2. In this set of experiments, we used HeLa cells because of their robust mitochondrial Ca2+ transients (26). To address this issue, mitoChR2(SSFO) was used, as it triggers a strong mitochondrial depolarization and remains open after a single pulse of blue light. First, we monitored changes in mitochondrial Ca2+ uptake in HeLa cells coexpressing a matrix-targeted FRET-based Ca2+ sensor, 4mtD3cpv, and either mitoChR2(SSFO) or mitoChR2(Tr), upon 10 s of blue light illumination followed by histamine stimulation. Consistent with previous studies (27–30), histamine triggered a robust mitochondrial Ca2+ response in controls and mitoChR2(Tr)-expressing cells. In contrast, mitochondrial Ca2+ uptake was dramatically reduced in blue light-preilluminated cells expressing mitoChR2(SSFO), similar to control cells treated with the uncoupler FCCP (Fig. 5A). Similar results were obtained when mitochondrial Ca2+ uptake was monitored with the chemiluminescent sensor mt-aequorin (26) (Fig. S8 and SI Materials and Methods). Remarkably, partial mitochondrial depolarization by mitoChR2(SSFO) was sufficient to suppress mitochondrial Ca2+ entry via the mitochondria Ca2+ uniporter (MCU) almost completely, presumably due to the strong inward rectification of this channel (31).
Fig. 5.
Light-dependent changes in mitochondrial Ca2+ uptake and oxygen consumption rate in cells expressing the optometabolic constructs. (A, Left) Kinetics of mitochondrial Ca2+ transients (expressed as ΔR/R0) elicited by histamine (Hist; 100 μM) in single HeLa cells cotransfected with 4mtD3cpv and mitoChR2(SSFO), mitoChR2(Tr), or empty vector, preilluminated with a 10-s blue light pulse (2 mW/mm2) or pretreated with FCCP (1 μM). (A, Right) Mean values (±SEM; n ≥ 21 cells per condition) of the peak amplitude of mitochondrial Ca2+ increases. (B) Mean (±SEM; n = 9 independent experiments) OCR in control (empty vector) or mitoChR2(Tr)-YFP– or mitoChR2(SSFO)-YFP–transfected HeLa cells, before and after illumination with a 10-s blue light pulse (Materials and Methods). Change of OCR in cells expressing mitoChR2(SSFO)-YFP is underestimated because OCR is the mean of the whole-cell population and the transfection efficiency was ∼60%. ***P < 0.001. NS, not significant.
Fig. S8.
MitoChR2(SSFO) photoactivation inhibits mitochondrial Ca2+ uptake (as measured with targeted aequorin) without inducing intrinsic toxicity. HeLa cells were transiently transfected with empty vector/mitoChR2(Tr)/mitoChR2(SSFO)/mitoChR2(SSFO)-YFP and mt-aequorin (A–E) or cyt-aequorin (F and G). (A) Cells were analyzed for [Ca2+]mt changes upon the application of a mix of stimuli (histamine, CPA, ATP) after photoactivation of the ChRs with blue light (as described in Fig. 5A). (A, Left) Representative kinetics of [Ca2+]mt in control (black), mitoChR2(Tr)- (gray), mitoChR2(SSFO)- (green), and mitoChR2(SSFO)-YFP– (dark green) expressing cells. (A, Right) Mean (±SEM; n ≥ 3 coverslips for each condition) [Ca2+]mt increase normalized to controls. (B) The bar graph represents the mean (±SEM; n ≥ 7 coverslips for each condition) [Ca2+]mt increase normalized to nonpreilluminated controls. (C, Left) Representative kinetics of [Ca2+]mt in the absence of a blue light pulse when the opening of the channel is triggered by the light emitted locally by aequorin during mitochondrial Ca2+ uptake. (C, Right) Mean (±SEM; n ≥ 3 coverslips for each condition) [Ca2+]mt increase normalized to controls. (D) Typical kinetics of the rates of photon emission during mitochondrial Ca2+ uptake induced by the application of a mix of stimuli or by CCE. To activate CCE, cells were first treated with 100 nM thapsigargin in Ca2+-free EGTA containing medium to deplete the stores and then perfused with medium containing 0.75 mM CaCl2, where indicated. (E, Left) Typical kinetics of the increase in mitochondrial Ca2+ concentration ([Ca2+]mt) activated by CCE. (E, Right) Mean (±SEM; n ≥ 7 coverslips for each condition) [Ca2+]mt increase upon CCE activation, normalized to controls. (F) [Ca2+]cyt changes were analyzed upon the application of a mix of stimuli as described in A. (F, Right) Typical kinetics of cytosolic Ca2+ increases, [Ca2+]cyt. (F, Left) Mean (±SEM; n ≥ 7 coverslips for each condition) [Ca2+]cyt increase normalized to control. (G) [Ca2+]cyt changes upon the activation of CCE were analyzed as described in E. (G, Left) Representative kinetics of [Ca2+]cyt increase upon CCE activation. (G, Right) Mean (±SEM; n ≥ 4 coverslips for each condition) [Ca2+]cyt normalized to control. *P < 0.05, **P < 0.01, ***P < 0.001. NS, not significant.
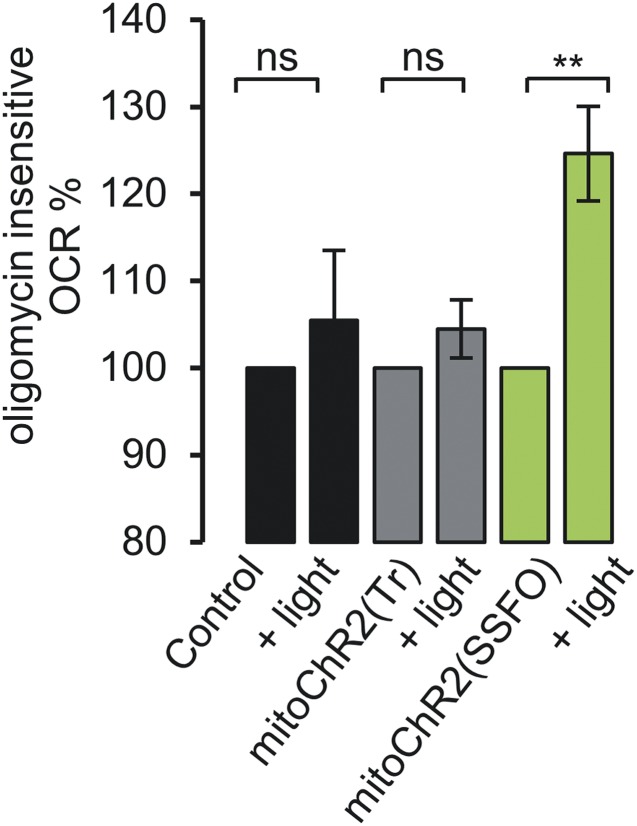
Mitochondrial uncoupling is predicted to affect O2 consumption. It is noteworthy that the rate of basal O2 consumption was increased by blue light illumination of mitoChR2(SSFO)-YFP–expressing HeLa cells but not of control cells or cells expressing mitoChR2(Tr) (Fig. 5B). Furthermore, an increase in oligomycin-insensitive O2 consumption, a classical effect of uncoupling, was observed in cells expressing mitoChR2(SSFO)-YFP illuminated with blue light, whereas no effect was observed in cells expressing mitoChR2(Tr) (Fig. S9).
Fig. S9.
Blue light-dependent oligomycin-insensitive oxygen consumption. Mean normalized oxygen consumption rate (±SEM; n ≥ 8 independent experiments) in control (void vector) or mitoChR2(Tr)- or mitoChR2(SSFO)-YFP–transfected HeLa cells. Cells were pretreated with oligomycin, and OCR was measured before and after illumination with a 10-s blue light pulse (Materials and Methods). **P < 0.01. NS, not significant.
Light-Dependent Control of Mitochondria-Associated Physiological Processes.
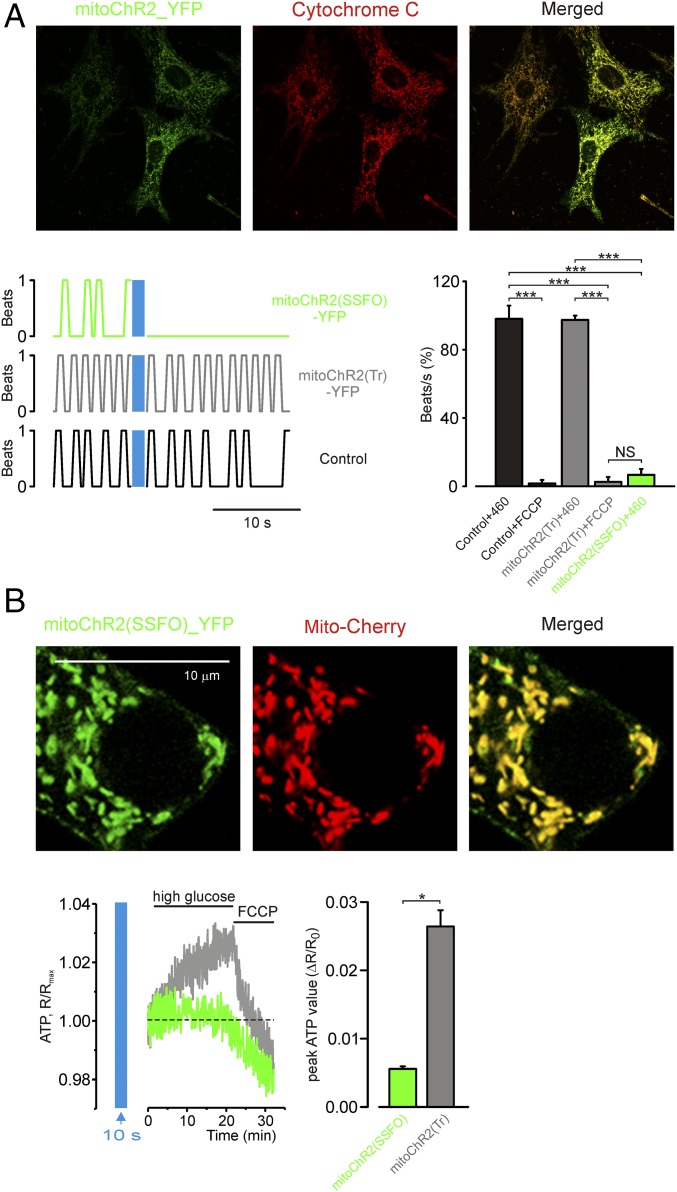
We then determined the potential of the optometabolic constructs for interrogating complex physiological processes (Fig. 6). We tested whether spontaneous beating of neonatal rat cardiomyocytes expressing mitoChR2(SSFO)-YFP, but not of cells expressing the nonfunctional mitoChR2(Tr)-YFP, could be suppressed by blue light illumination (Fig. 6A and Movies S1, S2, and S3). Irradiance of the beating cardiomyocytes for 10 s was followed by a strong inhibition of spontaneous beating of cardiomyocytes expressing mitoChR2(SSFO)-YFP but not mitoChR2(Tr)-YFP. A similar block of spontaneous beating was observed following mitochondrial depolarization by FCCP in cells expressing either construct.
Fig. 6.
Light-dependent control of beating cardiomyocyte and pancreatic β-cell glucose-dependent ATP production in cells expressing the optometabolic constructs. (A, Top) Confocal images of cultured rat neonatal cardiomyocytes expressing mitoChR2(SSFO)-YFP and immunostained with anti-cytochrome c antibody. (A, Bottom Left) Representative traces showing contractions over time before and after photoactivation (time and irradiance as reported in Fig. 5A) of cardiomyocytes expressing mitoChr2(SSFO)-YFP (green trace), mitoChR2(Tr)-YFP (gray trace), or Mito-YFP (control; black trace). (A, Bottom Right) Mean value (±SEM; n ≥ 4 cells per condition) of spontaneous beating frequency 10 s after blue light illumination (normalized to the frequency in the same cells measured before photoactivation) in cardiomyocytes expressing mitoChR2(SSFO)-YFP, mitoChR2(Tr), or transfected with empty vector. Where indicated, the cells were treated with 1 μM FCCP. (B, Top) Confocal images of cultured Min-6 β-cells expressing mitoChR2(SSFO)-YFP and IMM-targeted mito-mCherry (as indicated). (B, Bottom Left) Kinetics of ATP changes upon application of high glucose (20 mM) and FCCP (1 μM) to Min-6 cells cotransfected with the fluorescent ATP sensor AT 1.03 and either mitoChR2(SSFO)-YFP (green trace) or mitoChR2(Tr)-YFP (gray trace). Cells were preilluminated for 10 s with blue light (2 mW/mm2). (B, Bottom Right) Mean (±SEM) ΔR/R0 peak value in cells (n ≥ 90 per condition) illuminated for 10 s and expressing mitoChR2(SSFO)-YFP or mitoChR2(Tr)-YFP. *P < 0.05, ***P < 0.001. NS, not significant.
In pancreatic β-cells, a shift from low to high glucose triggers mitochondrial hyperpolarization, leading to a burst of ATP production (32). It is thus predicted that mitoChR2(SSFO) activation should prevent the high glucose-dependent increase in ATP production. Min-6 β-cells (Fig. 6B) were thus cotransfected with mitoChR2(SSFO)-YFP or mitoChR2(Tr)-YFP and the intracellular ATP sensor AT 1.03 (33) and then challenged with high glucose. Fig. 6B shows that upon preillumination with blue light, switching the cells from low- to high-glucose medium evoked a rise in ATP concentration in cells expressing mitoChR2(Tr)-YFP. In contrast, ATP elevation was abolished in cells expressing mitoChR2(SSFO)-YFP. A large drop in ATP was finally elicited by the mitochondrial uncoupler FCCP, probably due to a reversal of the H+ ATPase.
Light-Dependent Control of Mitochondria in Spatially Confined Regions of the Cell.
To determine whether the optometabolic strategy can be applied to a spatially restricted subpopulation of mitochondria within the same cell, we established a paradigm of spatially confined stimulation using a laser-based module designed for FRAP to selectively activate mitoChR2(SSFO) in predefined cell regions. TMRM fluorescence was measured inside and outside the photoactivated region of single HeLa cells expressing mitoChR2(SSFO).
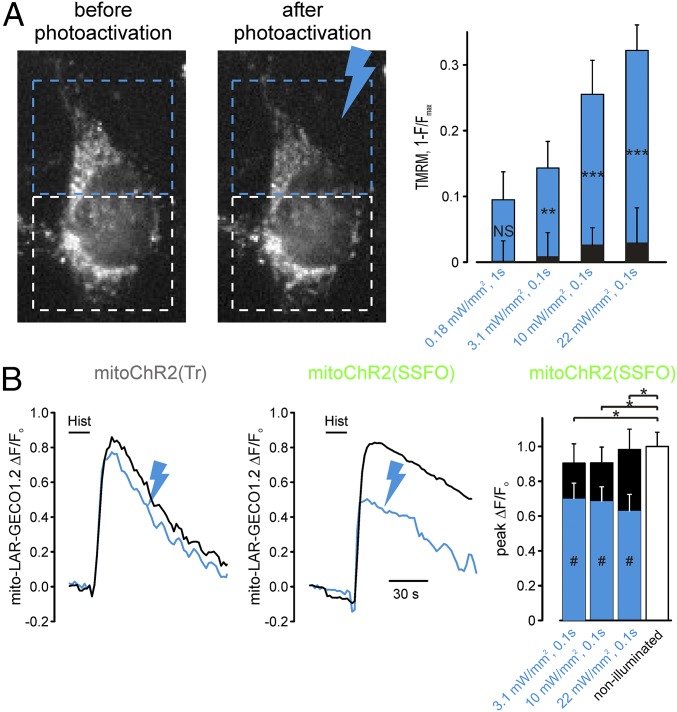
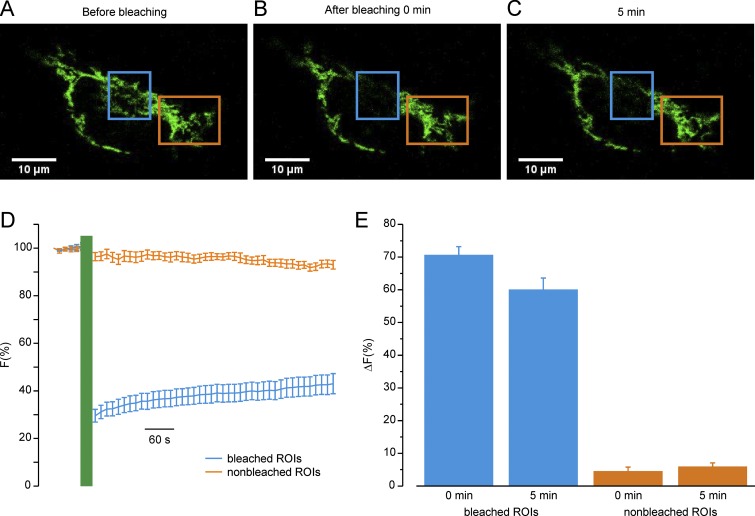
In cells expressing mitoChR2(SSFO), stimulation by blue light elicited a time- and irradiance-dependent change in mitochondrial membrane potential in the illuminated region (Fig. 7A). A very small, nonsignificant depolarization was observed in the nonilluminated regions. We next used a similar experimental paradigm, as described in Fig. 7A, to study mitochondrial Ca2+ signaling cross-talk upon depolarization of a confined cell region (Fig. 7B). Because 4mtD3cpv is sensitive to bleaching by the high-power and highly focalized 470-nm laser, we used a red-shifted Ca2+ sensor [mito-LAR-GECO 1.2 (34)] for this set of experiments. Stimulation by blue light reduced, as expected, histamine-evoked mitochondrial Ca2+ response in the illuminated region. In contrast, it had little effect on the mitochondrial Ca2+ response in nonilluminated regions. The highly confined effect of mitoChR2(SSFO) suggests that the HeLa cells used in this study have mitochondria with relatively slow and rare fusion/fission events (35). To confirm this hypothesis, FRAP experiments in HeLa cells expressing a mitochondria-targeted YFP (Fig. S10) were carried out. The region of the cells not illuminated during the bleaching period showed a negligible decrease in fluorescence immediately after the FRAP protocol that remained practically unaffected for an additional 5 min. In contrast, the bleached region showed a small recovery of fluorescence (about 10%) after the FRAP protocol. Such low fluorescence changes are compatible with a mitochondrial network with a limited intranetwork diffusion of the fluorescent protein and/or fusion events (35) within the time frame of the experiment.
Fig. 7.
Subcellular interrogation of mitochondrial membrane potential and Ca2+ signaling by optometabolic tools. (A) Spatially confined illumination elicits localized light-dependent changes of Δψm in cells expressing the optometabolic constructs. (A, Left) Representative images of a TMRM-stained, mitoChR2(SSFO)-transfected HeLa cell before and 5 min after the blue light pulse (19.4 mW/mm2 for 50 ms) delivered to the region of the cell marked by the blue rectangle. The white rectangle defines the region of cells that has not been illuminated. (A, Right) The bar graph reports the mean change of 1 − F/Fmax (±SEM) in cells expressing mitoChR2(SSFO) elicited by the indicated illumination regimes, normalized to the response of cells expressing the mitoChR2(Tr) construct to correct for TMRM bleaching induced by the blue laser (Materials and Methods). Blue bars represent the photoactivated part of the cells, whereas black bars refer to the nonstimulated region of the cells. **P < 0.01, ***P < 0.001 between the signal obtained in the photoactivated and nonphotoactivated parts of the cell. (B) Spatially confined illumination controls mitochondrial Ca2+ signals in distinct cell regions. (B, Left) Representative mitochondrial Ca2+ transients (expressed as ΔF/F0) elicited by histamine application (100 μM) in cells cotransfected with mito-LAR-GECO 1.2 and either the mitoChR2(SFFO)-YFP or mitoChR2(Tr)-YFP construct (as indicated). As in A, part of the cell was illuminated with a light pulse (22 mW/mm2 for 50 ms; blue trace), whereas the other part was not (black trace). Illumination had little effect on Ca2+ signals in cells expressing mitoChR2(Tr)-YFP (Left). In contrast, the Ca2+ signals in mitoChR2(SFFO)-YFP cells were diminished in the illuminated region (blue trace) compared with the nonilluminated part of the cell. (B, Right) Means (±SEM) of the change in Ca2+ signals following illumination with the indicated light pulses in cells expressing the mitoChR2(SFFO)-YFP or mitoChR2(Tr)-YFP construct (as indicated). *P < 0.05 for all of the conditions between the two variants. #P < 0.05 between illuminated region (blue bar) and nonilluminated region (black bar) of the cell expressing mitoChR(SSFO). NS, not significant.
Fig. S10.
FRAP analysis of mitochondrial network dynamics. (A–C) Representative confocal images of HeLa cells expressing mito-YFP before photobleaching (A), immediately after (B), and 5 min after (C) photobleaching in different regions of interest (ROIs). The blue ROI indicates the bleached area; the orange ROI indicates a nonbleached area. (Scale bars, 10 μm.) (D) Mean ± SEM traces of Mito-YFP fluorescence intensity. Traces show fluorescence intensities before and after photobleaching normalized to prebleached ones and plotted over time. The blue trace refers to bleached ROIs; the orange trace refers to ROIs of a nonbleached area. (E) Bars represent mean ± SEM values of the ΔF(%) changes (calculated as the difference between the fluorescence before bleaching and the fluorescence immediately or 5 min after bleaching) of the indicated ROIs at two different time points: immediately (0 min) and 5 min after bleaching. n = 12 cells per condition. P < 0.05 between the recovery of bleached and nonbleached regions.
SI Materials and Methods
Topology.
In PM-localized ChR2, the C terminus (and thus the YFP tag) is known to face the cytoplasm. Accordingly, one would predict that in a functional IMM-localized channel the YFP tag should face the matrix. To determine whether indeed mitoChR2(SSFO)-YFP is localized in the IMM and with the correct topology, we carried out a sequential fluorescence quenching analysis as previously described (18). HeLa cells coexpressing the YFP-tagged mitoChR2(SSFO) and an OMM, N33D3cpv, or a matrix marker, 4mtD3cpv, were first treated with proteinase K (Fig. 2A). No significant drop in fluorescent signal was observed in the intact cells, indicating that all of the YFP tags are protected by the PM. Permeabilization of the PM by digitonin in the presence of proteinase K was followed, as expected, by a disappearance of N33D3cpv fluorescence (18), but neither the fluorescent signal of the matrix-localized 4mtD3cpv nor that of mitoChR2(SSFO)-YFP was affected. Similarly, trypan blue, a strong quenching agent for YFP that is permeable across the OMM, but not the IMM, had no effect on mitoChR2(SSFO)-YFP and 4mtD3cpv fluorescence. Finally, cells pretreated with digitonin were perfused with alamethicin, known to permeabilize both the OMM and IMM to high molecular weight solutes (19, 20). The 4mtD3cpv-associated fluorescent signal was almost completely lost, as expected for a matrix-soluble protein (Fig. 2B), but no change was observed in mitoChR2(SSFO)-YFP fluorescence, as predicted for a mitochondrial integral protein of the IMM. In the presence of alamethicin, however, trypan blue rapidly quenched mitoChR2(SSFO)-YFP fluorescence (Fig. 2C). Taken together, the above experiments indicate that (i) mitoChR2 is targeted exclusively to the IMM and does not reach the PM, and (ii) the YFP tag of these two constructs is neither exposed to the cytosolic surface of the OMM nor to the intermembrane space.
Aequorin Ca2+ Measurement.
To strengthen and extend data about optogenetic control of mitochondrial Ca2+ uptake, we cotransfected mitoChR2(SSFO)-YFP, mitoChR2(SSFO), and mitoChR2(Tr) with mt-aequorin (or cyt-aequorin) to monitor the effect of channel opening on mitochondrial Ca2+ in a cell population. The data of Fig. S8A show that preilluminating the sample with blue light results in a strong reduction in the amplitude of the mitochondrial Ca2+ peak elicited by stimulation with IP3-generating stimuli, compared with controls or cells expressing the truncated form of the channel. It is noteworthy that the average mitochondrial Ca2+ peaks of control cells with or without preillumination are indistinguishable (Fig. S8B), indicating that blue light is not inducing phototoxicity.
Given that aequorin is a chemiluminescent protein and emits light at 460 nm upon a rise in Ca2+ levels, the prediction is that the light emitted, locally, by aequorin during the Ca2+ rise may be sufficient in itself to open the channel and thus reduce the amplitude of the mitochondrial Ca2+ rise. Indeed, the data of Fig. S8C confirm that this is the case, namely that the peak amplitude of the mitochondrial Ca2+ rise even without preillumination was significantly diminished in cells expressing mitoChR2(SSFO)-YFP compared with controls. To confirm that the reduction is not due to an intrinsic toxicity due to channel expression but depends on the depolarization induced by mitoChR2(SSFO) opening, we induced a much smaller Ca2+ rise in mitochondria by activating capacitative Ca2+ entry (CCE) (47). Given that the aequorin light emission is not linearly but exponentially related to Ca2+ concentration, for a 10-fold reduction in the Ca2+ peak (as for CCE compared with a mix of stimuli) the reduction in light emitted is over 100-fold (Fig. S8D). As expected, thus, the peak amplitude of the mitochondrial Ca2+ rise due to CCE was indistinguishable in mitoChR2-YFP–expressing cells compared with controls, indicating that under these conditions the aequorin-emitted light is insufficient to significantly open the channel (Fig. S8E). Moreover, the cytosolic Ca2+ peak was induced by stimulation with the mix of stimuli (Fig. S8F) or through CCE induction (Fig. S8G). No differences between control cells and cells expressing mitoChR2(SSFO) were observed, corroborating the observation that no significant toxicity is caused by mitoChR2(SSFO) expression.
These results not only confirm the efficacy of mitoChR2(SSFO) in controlling mitochondrial Ca2+ uptake in a cell population but also demonstrate that the YFP-tagged and untagged ChR2 versions are indistinguishable and not toxic.
Discussion
Currently, several strategies are available to monitor mitochondrial metabolic and signaling activity, but comparable tools to control mitochondrial function are still lacking. Our study describes an optometabolic strategy that allows highly specific, light-dependent regulation of Δψm across the IMM and therefore of its numerously coupled physiological functions. It is remarkable that targeting of channelrhodopsin to the IMM requires not only the inclusion of tandem repeats of mitochondrial signaling peptides but also truncation of 24 residues at the N terminus of the channel. Although the reason for the latter requirement is not entirely clear, it is worth noting that this region is engineered to enhance PM retention of channelrhodopsin and therefore needs to be trimmed to allow effective mitochondrial targeting. We show that several channelrhodopsin variants can be targeted to the IMM by the simultaneous inclusion of tandem repeats of mitochondrial signaling peptides and deletion of a PM retention N-terminally located sequence. The mitochondria-specific localization of mitoChR2 is further substantiated by the lack of any residual light-dependent firing in neurons.
We show that changes in mitochondrial membrane potential can be induced with high spatiotemporal precision in cells expressing mitoChR2 variants. Moreover, mitochondrial channelrhodopsins with various kinetic properties can potentially be used to interrogate the effects of both physiological and pathological changes of Δψm evoked by triggering relatively small and reversible changes (using mitoChR2) or inducing strong drops in mitochondrial membrane potential [using mitoChR2(SSFO)].
The observed light-dependent mitochondrial depolarization seemed slower than the light-dependent change in membrane potential triggered by PM-located ChRs in neurons. The mechanistic basis for this difference at present is not fully resolved. Notably, in neurons, whole-cell current via PM ChRs produces a relatively small depolarization, which is just sufficient to reach the activation threshold of voltage-gated Na+ channels. In contrast, to depolarize the mitochondria, the current via mitoChRs has to counteract the massive and continuous current generated by the electron transport chain, and the resulting changes in mitochondrial membrane potential could be an order of magnitude greater than those typically elicited in neurons. Also, kinetic properties of ChRs could be affected by distinct lipid composition and the steep electrical potential across the inner mitochondrial membrane.
It is noteworthy that two major properties of ChRs are retained when targeted to the IMM: (i) the ability to tune the amplitude of depolarization by varying the intensity and duration of the light pulses; and (ii) in cells expressing mitoChR(SSFO), the ability to induce prolonged but switchable depolarization with a single pulse of blue light. The latter aspect is important in linking optometabolic stimuli to metabolic analysis without continuous illumination that may interfere with the assay or trigger photodynamic damage.
A potential technical hurdle encountered when monitoring the effect of mitoChR2 photoactivation on Δψm is that the dye commonly used to monitor Δψm, TMRM, is excited at a wavelength that causes a partial inactivation of ChR2(SSFO). The use of other dyes for monitoring Δψm, such as JC1 or Rhod1,2,3, is hampered because their excitation profile overlaps with ChRs’ photoactivation spectra. We found, however, that this hurdle can be overcome by (i) reducing to a minimum the intensity of the TMRM excitation and the frequency of optical data acquisition; (ii) adding a dark gap between mitoChR2(SSFO) activation and Δψm monitoring; and (iii) linking stimulation of the optometabolic construct to nonoptic analysis of metabolism, such as O2 consumption. Our results also suggest that mitoChR2 can modulate mitochondrial membrane potential in the absence of Na+ and K+ ions, but further studies across a wide pH range will be needed to address the role of H+ permeation in this process.
A unique aspect of the mitochondrial network is that it is formed by high-resistance elements required to maintain the steep, ∼−200-mV membrane potential across the IMM, but at the same time these elements can be interconnected by fission and fusion events that generate a dynamic mitochondrial network (36, 37). To depolarize a subset of mitochondria within the same cell, use of photoactivated uncouplers has been proposed (38). However, after uncaging, these uncouplers may rapidly diffuse within the cell, reaching other mitochondrial regions or even neighboring cells (5). Our FRAP analysis in HeLa cells indicates that, in these cells, the mitochondrial network undergoes relatively slow and rare fusion events. These cells, accordingly, appear nicely suited to test whether mitoChR2(SSFO)-mediated depolarization can be restricted to a small subset of mitochondria. Our results indicate that, by using the optometabolic tool, we cannot only control mitochondrial membrane potential but also monitor whether and how this change is communicated to other cell regions. In particular, we found that the Δψm changes and Ca2+ uptake efficacy can be restricted almost exclusively to the mitochondrial regions where mitoChR2(SSFO) is activated, confirming the high-resistance coupling of the parts of the mitochondrial network in this cell model.
The results of this study also indicate that the optometabolic approach can be used to study complex physiological processes at the cellular level. Optogenetic control has been recently used to control cardiac pacing (39). It is unclear, however, whether tuning of the metabolic state of cardiomyocytes can be used to regulate their spontaneous beating activity. We show here that optometabolic stimulation, inducing mitochondrial depolarization, can suppress the spontaneous beating of neonatal cardiomyocytes. Future studies will determine whether this strategy can be implemented in vivo.
Altogether, the optometabolic strategy described here will allow interrogating the cellular physiological role of mitochondria in cells, tissues, and organs independent of the use of drugs such as uncouplers or inhibitors of the respiratory chain that are plagued by numerous side effects, lack cell-type specificity, and generally difficult to load in tissues/animals. By the use of cell-specific promoters, the optometabolic modulation of Δψm could provide selective control of mitochondrial functions in distinct cell types within a mixed population. Finally, the precise spatial control of light illumination demonstrated here in single cells will facilitate intracellular interrogation of distinct subpopulations within the mitochondrial network with high spatiotemporal resolution.
Materials and Methods
Generation and Photostimulation of ChR2 Constructs.
ChR2-YFP fragments (SSFO, C128) were cloned from viral constructs into pcDNA3.1 vector. I197 variant was obtained by site-directed mutagenesis. Truncated variant was obtained by introducing a premature stop codon. The mitochondria-targeted ChR2-YFP plasmids were constructed by in-frame fusing of the mitochondria-targeting sequence of 4mt to the N terminus of ChR2-YFP via a HindIII site. For mitoChR2 constructs, the initial 72 bp of ChR2-coding region were deleted by introducing a BamHI site and subsequent deletion. For some applications, constructs lacking a fluorescent tag were used.
Animals.
All procedures were conducted in accordance with the Italian and European Communities Council Directive on Animal Care and were approved by the Italian Ministry of Health or by the Weizmann Institute Animal Care and Use Committee (IACUC).
Cell Culture, Transfection, and Viability Determination.
HEK293T (human embryonic kidney cell line), HeLa, and human melanoma GA-PLXR cells were cultured in DMEM (high-glucose) supplemented with 10% FCS and 50 mg/mL penicillin and streptomycin. Plasmid transfection was performed using the CaPO4 precipitation protocol in cultures of 30 to 50% confluence for HEK293T cells. GA-PLXR cells were transfected with Arrest-In transfection reagent (Thermo Scientific) according to the manufacturer’s instructions. For HeLa cells, transfection was performed at 60% confluence using TransIT-LT1 transfection reagent (Mirus Bio) with 1 µg of DNA. Cotransfection with cDNA of mitoChR2(SSFO)/empty vector/mitoChR2(Tr) and Ca2+ probes (aequorin or cameleon) was performed at a molar ratio of 5:1 to maximize the cotransfection efficiency. All experiments were performed 48 to 72 h after transfection.
All-trans retinal (ATR; 2 μg/mL final concentration) was added to the culture medium 2 to 12 h before experiments. The viability of cells expressing the mitoChR2(SSFO) or mitoChR2(Tr) constructs following illumination was determined at the indicated times by propidium iodide (PI) stain following cell counting as previously described (40).
Hippocampal Neuron Culture and Electrophysiology.
Hippocampi were isolated from postnatal day 0 Sprague–Dawley rats and treated with papain (20 U mL−1) for 45 min at 37 °C. The digestion was stopped with 10 mL MEM/Earle’s salts without l-glutamine along with 20 mM glucose, serum extender (1:1,000), and 10% heat-inactivated FBS containing 25 mg of BSA and 25 mg of trypsin inhibitor. The tissue was triturated in a small volume of this solution with a fire-polished Pasteur pipette, and ∼100,000 cells in 1 mL were plated per coverslip on 24-well plates. Glass coverslips were coated overnight at 37 °C with 1:50 Matrigel (Collaborative Biomedical Products). Cells were plated in culture medium (Neurobasal containing 2× B-27 and 2 mM GlutaMAX-I; Life Technologies). We replaced half of the medium with culture medium the next day, giving a final serum concentration of 1.75%. Electrical recordings were performed as previously described (17).
Images were acquired on an Olympus confocal microscope using an oil-immersion objective. Cells expressing mitoChR2-Cherry constructs and Mito-YFP were live-imaged using YFP/Cherry standard microscope settings in Ringer’s solution.
Topology Experiments.
HeLa cells expressing mitoChR2(SSFO)-YFP, 4mtD3cpv, or N33D3cpv were analyzed using a DM6000 inverted microscope (Leica) with a 40× oil objective (HCX Plan Apo, N.A. 1.25) as described previously (18). Excitation light produced by a 460-nm LED (LZ1-10DB05; LED Engin) was filtered at 470 nm through an excitation filter (ET470/24), and the emitted light was collected through a 515-nm long-pass filter and a dichroic mirror (510 DCXR).
Cells were mounted in an open-topped chamber thermostatted at 37 °C and maintained in an extracellular (EC) Ca2+-free medium containing 135 mM NaCl, 5 mM KCl, 1 mM MgCl2, 0.4 mM KH2PO4, 10 mM glucose, and 20 mM Hepes (pH 7.4) at 37 °C. To cut YFP facing the extracellular space, cells were perfused with EC Ca2+-free medium in the presence of proteinase K (20 μg/μL). Plasma membrane permeabilization was performed with 100 μM digitonin in an intracellular-like medium (IC) containing 10 mM NaCl, 130 mM KCl, 1 mM MgCl2, 1 mM KH2PO4, 2 mM succinic acid, and 20 mM Hepes (pH 7.4) at 37 °C. Afterward, to cut YFP facing the cytosol, cells were perfused with IC Ca2+-free medium supplemented with proteinase K (20 μg/μL) and, finally, to quench any YFP facing the intermembrane space, HeLa cells were perfused with IC medium supplemented with trypan blue (0.5 mg/mL). For alamethicin experiments, plasma membranes of HeLa cells were prepermeabilized with digitonin (as described above). Alamethicin (20 μg/mL) was added in IC medium to permeabilize the IMM.
Off-line analysis of topology experiments was performed with ImageJ (Wayne Rasband, NIH, Bethesda). The YFP fluorescence intensity (with background signal subtracted) was analyzed after selecting proper regions of interest (ROIs) on each cell; the intensity was expressed as % of the initial YFP fluorescence. These experiments were carried out without addition of ATR, because its spectrum partially overlaps that of YFP.
Mitochondrial Membrane Potential Measurements: TMRM Assay.
Mitochondrial membrane potential was determined by TMRM fluorescence in HEK293T and HeLa cells.
HEK293T cells were loaded for 30 min, at room temperature, with 50 nM TMRM in Ringer’s solution containing 120 mM NaCl, 5.4 mM KCl, 0.8 mM MgCl2, 20 mM Hepes, 15 mM glucose, and 1.8 mM CaCl2 (pH 7.4 with NaOH). TMRM fluorescence was viewed in a BX51WI microscope (Olympus) equipped with a 60× water-immersion lens (Olympus). For TMRM excitation, a high-intensity green light LED (535 ± 5 nm; Prizmatix; 1 mW/mm2) was used, and emission was collected through a U-MNG2 Olympus filter (530- to 550-nm excitation filter, 570-nm dichroic mirror, 590-nm long-pass emission filter) and acquired by using a back-illuminated 80 × 80 pixel cooled camera (NeuroCCD-SMQ; RedShirt Imaging). Images were acquired every 2.5 to 3.5 s (50-ms exposure). For blue light exposure, a high-intensity 495 ± 5-nm LED was used (Prizmatix). The image data were exported for analysis in Igor Pro software (WaveMetrics).
HeLa cells were loaded for 15 to 30 min, at 37 °C, with 20 nM TMRM in MEM without phenol red (Life Technologies). TMRM fluorescence was viewed using a DM6000 inverted microscope (Leica) with a 40× oil objective (HCX Plan Apo, N.A. 1.25). Excitation light produced by a 590-nm LED (Thorlabs; irradiance 0.2 mW/mm2) was filtered at 540 nm through an excitation filter (ET590/20×), and the emitted light was collected through a TRITC filter (excitation BP 515 to 560 nm, dichroic 580, emission 590LP). Cells were preilluminated to trigger mitoChR2(SSFO) opening by using a 460-nm LED (LZ1-10DB05; LED Engin) for 10 s and then immediately imaged to record the TMRM signal.
To check the effect of green light on the kinetics of TMRM signal decrease, cells were first illuminated with blue light, kept in darkness for 1 min, and followed again by TMRM excitation. To test for PTP opening, TMRM fluorescence was assessed in cells expressing mitoChR2(SSFO)-YFP in the presence of the PTP inhibitor CsA (1 µM).
TMRM and Ca2+ Imaging for Subcellular Photoactivation: FRAP Module.
TMRM assay.
HeLa cell transfection was performed with 1 μg of DNA. Cotransfection with cDNA of mitoChR2(SSFO)/mitoChR2(Tr) and a nuclear RFP (H2B_RFP) was performed in a molar ratio of 5:1 to maximize the cotransfection efficiency. All experiments were performed 48 to 72 h after transfection. HeLa cells were loaded with 20 nM TMRM for 15 to 30 min at room temperature (RT) in extracellular saline. TMRM fluorescence was viewed using a spinning disk upright microscope (Crisel Instruments) in wide-field acquisition mode with a 40× water objective (Olympus; N.A. 0.8). Excitation light was produced by a 550 ± 15-nm LED (Lumencor; irradiance 0.4 mW/mm2) and filtered through a quad band dichroic and emission filter (Dapi/Fitch/CY3/CY5). To trigger mitoChR2(SSFO) opening, software generated for FRAP experiments was used to select specific ROIs of the cells. The photoactivation was performed using a 470-nm laser generating a spot pattern illumination. Given the scanning mode of the FRAP module, only the mitoChR(SSFO) variant can be used, being a ChR2 variant able to remain open for several minutes upon a single pulse of blue light. Selected ROIs were illuminated with pulses of different duration and irradiance (as indicated in the legends of Figs. 3C and 7) and then immediately imaged to record the TMRM signal. Acquisition time for TMRM signal was 1 frame per min to reduce the interference of green light with the opening kinetics of SSFO.
Ca2+ imaging.
HeLa cells were cotransfected with cDNA of mitoChR2(SSFO)-YFP/mitoChR2(Tr)-YFP and mito_LAR-GECO1.2 at a molar ratio of 5:1. All experiments were performed 48 to 72 h after transfection.
The plasmid CMV-mito-LAR-GECO1-2 was purchased from Addgene [plasmid 61245 (34)] and has a reported kd for Ca2+ of about 12 µM.
Mito_LAR-GECO1.2 and YFP fluorescence signals were viewed using a spinning disk upright microscope (Crisel Instruments) in wide-field acquisition with a 40× water objective (Olympus; N.A. 0.8). Imaging was performed using an excitation light produced by a 550/15-nm LED device (Lumencor) and filtered through a quad band filter (Dapi/Fitch/CY3/CY5). For imaging of YFP fluorescence, a 510/25-nm LED device (Lumencor) was used. MitoChR2(SSFO) opening was triggered using a 470-nm laser with pulses of different duration and irradiance (as described in Fig. 7B). Mito_LAR-GECO1.2 signals were acquired 1 min following the photoactivation, to minimize the effect of the green light on the opening kinetics of mitoChR2(SSFO). Images were recorded every 2 s. During the experiments, cells were maintained in extracellular saline containing 1 mM CaCl2. Histamine (100 µM) was manually added to the bath where indicated.
Photoactivation and Irradiance Measurement.
For photoactivation, the light sources were either LED arrays or laser devices, with an emitting peak of 460 to 480 nm at an intensity indicated in mW/mm2 for activating the mitoChR2 constructs, and with an emitting peak of 590 nm at an intensity indicated in mW/mm2 for mitoChR2(SSFO) closure. Light intensity was determined on the microscope stage before each experiment using a Thorlabs PM100D photometer. Light signals were temporally paced using a Master-8 device or by confocal software.
Ca2+ Imaging with 4mtD3cpv.
HeLa cells expressing mitochondria-targeted cameleon (4mtD3cpv) cotransfected with mitoChR2(SSFO)/void vector/mitoChR2(Tr) were analyzed using a DM6000 inverted microscope (Leica) with a 40× oil objective (HCX Plan Apo, N.A. 1.25). Settings and conditions were as described (41). Exposure time varied from 100 to 200 ms, depending on the intensity of the fluorescent signal of the cells analyzed. Images were acquired every 2 s. Cells were preilluminated to trigger mitoChR2(SSFO) opening by using a 460-nm LED (LED Engin; LZ1-10DB05 LED) for 10 s, and FRET measurements started 1 min after illumination.
Data are presented as ΔR/R0 values (where ΔR is the change of the cpV/CFP emission intensity ratio at any time and R0 is the fluorescence emission ratio at time 0).
ATP Measurement with AT 1.03.
For glucose-dependent ATP measurements, Min-6 cells were cotransfected with mitoChR2(SSFO) and AT 1.03 probe, superfused intermittently with low (3 mM) and high (20 mM) glucose-containing solutions as previously described (42, 43), and excited with blue light pulses as indicated in Fig. 6B.
Aequorin Ca2+ Measurements.
Ca2+ measurement in the cytosol or in mitochondria with targeted aequorin was carried out as described (44). In the indicated cases, cells were preilluminated to trigger mitoChR2(SSFO) opening by using a 460-nm LED (LED Engin; LZ1-10DB05 LED) for 10 s, and the aequorin measurements started 1 min after illumination.
Oxygen Consumption.
OCR in adherent cells was measured with an XF24 Extracellular Flux Analyzer (Seahorse Bioscience). HeLa cells were plated and transfected with mitoChR2(SSFO)-YFP or Mito-YFP and void vector/mitoChR2(Tr). Forty-eight to 72 h after transfection, cells were detached and seeded to get a single monolayer on XF24 cell-culture microplates (Seahorse Bioscience) in 200 μL of high-glucose DMEM and incubated at 37 °C in 5% CO2 for 24 h in the presence of ATR. Thirty minutes before starting the experiments, the growth medium was replaced in each well with 670 μL of high-glucose DMEM. After an OCR baseline measurement, 1 μM oligomycin, 1 μM FCCP, 1 μM rotenone, and 1 μM antimycin A were sequentially added to each well. The analyzer’s standard protocol was shortened to record basal respiration within 30 min from the flash of blue light. In each plate, half of the wells were kept in the dark, whereas half were illuminated for 10 s at 480 nm using a Dual Fluorescent Protein flashlight (NightSea). Data were obtained from four independent transfections and two or three replicates for each transfection. Data are expressed as the average of the basal respiration, calculated as OCR (pmol of O2 per min) per million cells, normalized to nonpreilluminated controls (for details, see ref. 45).
Neonatal Rat Cardiomyocytes.
Neonatal rat cardiomyocytes were prepared from ventricles of neonatal Wistar rats (0 to 2 d after birth) as described (46). The experiments were carried out 72 h after transfection and imaged using a DM6000 inverted microscope (Leica) with a 40× oil objective (HCX Plan Apo, N.A. 1.25). Contraction was monitored morphologically in bright field. To avoid the possibility that the contraction of neighboring cells could mask the effect of the single transfected cell, only isolated and beating cardiomyocytes expressing mitoChR2(SSFO)-YFP were analyzed.
FRAP Experiments for Mitochondrial Dynamics Experiments.
FRAP experiments were carried out in HeLa cells upon transfection with the cDNA encoding Mito-YFP. Twenty-four hours after transfection, cells bathed in mKRB were illuminated on a Leica SP5 confocal system using a 100×/1.4 oil objective and an argon 458-nm laser line. Images were taken every 10 s (1 min for the prebleaching period; 4 min of bleaching; 5 min for the recovery period); 512-nm wavelength was used to excite and bleach Mito-YFP. The fluorescence intensity of the region of interest with background signal subtracted was normalized to that before bleaching (%F = Ft/F0 × 100), where Ft is the fluorescence intensity recorded at any time and F0 is the fluorescence intensity recorded before bleaching.
Statistical Analysis.
All data are given as means ± SEM. Statistical analysis was performed using Origin (OriginLab Corporation) and assessed using a one-way ANOVA with Tukey’s and Bonferroni post hoc tests and a P value of 0.05.
Materials.
Proteinase K, trypan blue, alamethicin, histamine, ATP, and digitonin were purchased from Sigma-Aldrich, and CPA was from Calbiochem. All other materials were analytical or of the highest available grade.
Supplementary Material
Acknowledgments
We thank D. Arduino and U. Tripati for technical support. This work was supported by grants from the German Research Foundation (DFG) under German-Israeli Project Cooperation (to I.S., F.P., I.A.F., and M.H.) and Emmy Noether Programme PE 2053/1-1 (to F.P. and J.W.); Bavarian Ministry of Sciences, Research and the Arts, in the Framework of the Bavarian Molecular Biosystems Research Network (to F.P.); and Italian Ministry of Education [Fondo per gli Investimenti della Ricerca di Base (FIRB) Project and Euro Bioimaging Project], Fondazione Cassa di Risparmio di Padova e Rovigo (CARIPARO) Foundation, Veneto Region [Rete di infrastrutture e supporto dell'innovazione biotecnologica (RISIB) Project], and Consiglio Nazionale delle Ricerche (CNR) Special Project Aging (to T.P.).
Footnotes
The authors declare no conflict of interest.
This article contains supporting information online at www.pnas.org/lookup/suppl/doi:10.1073/pnas.1703623114/-/DCSupplemental.
References
- 1.Szabadkai G, Duchen MR. Mitochondria: The hub of cellular Ca2+ signaling. Physiology (Bethesda) 2008;23:84–94. doi: 10.1152/physiol.00046.2007. [DOI] [PubMed] [Google Scholar]
- 2.Kasahara A, Scorrano L. Mitochondria: From cell death executioners to regulators of cell differentiation. Trends Cell Biol. 2014;24:761–770. doi: 10.1016/j.tcb.2014.08.005. [DOI] [PubMed] [Google Scholar]
- 3.Hofer AM. Ca2+ signaling at membrane contact sites. Cell Calcium. 2015;58:331–332. doi: 10.1016/j.ceca.2015.07.002. [DOI] [PubMed] [Google Scholar]
- 4.De Stefani D, Rizzuto R, Pozzan T. Enjoy the trip: Calcium in mitochondria back and forth. Annu Rev Biochem. 2016;85:161–192. doi: 10.1146/annurev-biochem-060614-034216. [DOI] [PubMed] [Google Scholar]
- 5.Glancy B, et al. Mitochondrial reticulum for cellular energy distribution in muscle. Nature. 2015;523:617–620. doi: 10.1038/nature14614. [DOI] [PMC free article] [PubMed] [Google Scholar]
- 6.Clapham DE. Calcium signaling. Cell. 2007;131:1047–1058. doi: 10.1016/j.cell.2007.11.028. [DOI] [PubMed] [Google Scholar]
- 7.Rizzuto R, Duchen MR, Pozzan T. Flirting in little space: The ER/mitochondria Ca2+ liaison. Sci STKE. 2004;2004:re1. doi: 10.1126/stke.2152004re1. [DOI] [PubMed] [Google Scholar]
- 8.Rizzuto R, Pozzan T. Microdomains of intracellular Ca2+: Molecular determinants and functional consequences. Physiol Rev. 2006;86:369–408. doi: 10.1152/physrev.00004.2005. [DOI] [PubMed] [Google Scholar]
- 9.Tatsuta T, Langer T. Quality control of mitochondria: Protection against neurodegeneration and ageing. EMBO J. 2008;27:306–314. doi: 10.1038/sj.emboj.7601972. [DOI] [PMC free article] [PubMed] [Google Scholar]
- 10.Arslan P, Corps AN, Hesketh TR, Metcalfe JC, Pozzan T. cis-unsaturated fatty acids uncouple mitochondria and stimulate glycolysis in intact lymphocytes. Biochem J. 1984;217:419–425. doi: 10.1042/bj2170419. [DOI] [PMC free article] [PubMed] [Google Scholar]
- 11.Boyden ES, Zhang F, Bamberg E, Nagel G, Deisseroth K. Millisecond-timescale, genetically targeted optical control of neural activity. Nat Neurosci. 2005;8:1263–1268. doi: 10.1038/nn1525. [DOI] [PubMed] [Google Scholar]
- 12.Zhang F, Wang LP, Boyden ES, Deisseroth K. Channelrhodopsin-2 and optical control of excitable cells. Nat Methods. 2006;3:785–792. doi: 10.1038/nmeth936. [DOI] [PubMed] [Google Scholar]
- 13.Nagel G, et al. Channelrhodopsin-2, a directly light-gated cation-selective membrane channel. Proc Natl Acad Sci USA. 2003;100:13940–13945. doi: 10.1073/pnas.1936192100. [DOI] [PMC free article] [PubMed] [Google Scholar]
- 14.Palmer AE, et al. Ca2+ indicators based on computationally redesigned calmodulin-peptide pairs. Chem Biol. 2006;13:521–530. doi: 10.1016/j.chembiol.2006.03.007. [DOI] [PubMed] [Google Scholar]
- 15.Pendin D, Greotti E, Lefkimmiatis K, Pozzan T. Exploring cells with targeted biosensors. J Gen Physiol. 2017;149:1–36. doi: 10.1085/jgp.201611654. [DOI] [PMC free article] [PubMed] [Google Scholar]
- 16.Prakash R, et al. Two-photon optogenetic toolbox for fast inhibition, excitation and bistable modulation. Nat Methods. 2012;9:1171–1179. doi: 10.1038/nmeth.2215. [DOI] [PMC free article] [PubMed] [Google Scholar]
- 17.Yizhar O, et al. Neocortical excitation/inhibition balance in information processing and social dysfunction. Nature. 2011;477:171–178. doi: 10.1038/nature10360. [DOI] [PMC free article] [PubMed] [Google Scholar]
- 18.Giacomello M, et al. Ca2+ hot spots on the mitochondrial surface are generated by Ca2+ mobilization from stores, but not by activation of store-operated Ca2+ channels. Mol Cell. 2010;38:280–290. doi: 10.1016/j.molcel.2010.04.003. [DOI] [PubMed] [Google Scholar]
- 19.Petronilli V, et al. Transient and long-lasting openings of the mitochondrial permeability transition pore can be monitored directly in intact cells by changes in mitochondrial calcein fluorescence. Biophys J. 1999;76:725–734. doi: 10.1016/S0006-3495(99)77239-5. [DOI] [PMC free article] [PubMed] [Google Scholar]
- 20.Hoffman NE, et al. MICU1 motifs define mitochondrial calcium uniporter binding and activity. Cell Reports. 2013;5:1576–1588. doi: 10.1016/j.celrep.2013.11.026. [DOI] [PMC free article] [PubMed] [Google Scholar]
- 21.Grote M, Engelhard M, Hegemann P. Of ion pumps, sensors and channels—Perspectives on microbial rhodopsins between science and history. Biochim Biophys Acta. 2014;1837:533–545. doi: 10.1016/j.bbabio.2013.08.006. [DOI] [PubMed] [Google Scholar]
- 22.Richards R, Dempski RE. Re-introduction of transmembrane serine residues reduce the minimum pore diameter of channelrhodopsin-2. PLoS One. 2012;7:e50018. doi: 10.1371/journal.pone.0050018. [DOI] [PMC free article] [PubMed] [Google Scholar]
- 23.Ward MW. Quantitative analysis of membrane potentials. Methods Mol Biol. 2010;591:335–351. doi: 10.1007/978-1-60761-404-3_20. [DOI] [PubMed] [Google Scholar]
- 24.Palty R, et al. NCLX is an essential component of mitochondrial Na+/Ca2+ exchange. Proc Natl Acad Sci USA. 2010;107:436–441. doi: 10.1073/pnas.0908099107. [DOI] [PMC free article] [PubMed] [Google Scholar]
- 25.Bernardi P. Modulation of the mitochondrial cyclosporin A-sensitive permeability transition pore by the proton electrochemical gradient. Evidence that the pore can be opened by membrane depolarization. J Biol Chem. 1992;267:8834–8839. [PubMed] [Google Scholar]
- 26.Rizzuto R, Simpson AW, Brini M, Pozzan T. Rapid changes of mitochondrial Ca2+ revealed by specifically targeted recombinant aequorin. Nature. 1992;358:325–327. doi: 10.1038/358325a0. [DOI] [PubMed] [Google Scholar]
- 27.de la Fuente S, Fonteriz RI, Montero M, Alvarez J. Dynamics of mitochondrial [Ca(2+)] measured with the low-Ca(2+)-affinity dye rhod-5N. Cell Calcium. 2012;51:65–71. doi: 10.1016/j.ceca.2011.10.007. [DOI] [PubMed] [Google Scholar]
- 28.De Marchi U, Castelbou C, Demaurex N. Uncoupling protein 3 (UCP3) modulates the activity of sarco/endoplasmic reticulum Ca2+-ATPase (SERCA) by decreasing mitochondrial ATP production. J Biol Chem. 2011;286:32533–32541. doi: 10.1074/jbc.M110.216044. [DOI] [PMC free article] [PubMed] [Google Scholar]
- 29.Ishida S, Matsu-Ura T, Fukami K, Michikawa T, Mikoshiba K. Phospholipase C-β1 and β4 contribute to non-genetic cell-to-cell variability in histamine-induced calcium signals in HeLa cells. PLoS One. 2014;9:e86410. doi: 10.1371/journal.pone.0086410. [DOI] [PMC free article] [PubMed] [Google Scholar]
- 30.Rizzuto R, et al. Close contacts with the endoplasmic reticulum as determinants of mitochondrial Ca2+ responses. Science. 1998;280:1763–1766. doi: 10.1126/science.280.5370.1763. [DOI] [PubMed] [Google Scholar]
- 31.Kirichok Y, Krapivinsky G, Clapham DE. The mitochondrial calcium uniporter is a highly selective ion channel. Nature. 2004;427:360–364. doi: 10.1038/nature02246. [DOI] [PubMed] [Google Scholar]
- 32.Kennedy ED, Maechler P, Wollheim CB. Effects of depletion of mitochondrial DNA in metabolism secretion coupling in INS-1 cells. Diabetes. 1998;47:374–380. doi: 10.2337/diabetes.47.3.374. [DOI] [PubMed] [Google Scholar]
- 33.Imamura H, et al. Visualization of ATP levels inside single living cells with fluorescence resonance energy transfer-based genetically encoded indicators. Proc Natl Acad Sci USA. 2009;106:15651–15656. doi: 10.1073/pnas.0904764106. [DOI] [PMC free article] [PubMed] [Google Scholar]
- 34.Wu J, et al. Red fluorescent genetically encoded Ca2+ indicators for use in mitochondria and endoplasmic reticulum. Biochem J. 2014;464:13–22. doi: 10.1042/BJ20140931. [DOI] [PMC free article] [PubMed] [Google Scholar]
- 35.Karbowski M, et al. Quantitation of mitochondrial dynamics by photolabeling of individual organelles shows that mitochondrial fusion is blocked during the Bax activation phase of apoptosis. J Cell Biol. 2004;164:493–499. doi: 10.1083/jcb.200309082. [DOI] [PMC free article] [PubMed] [Google Scholar]
- 36.Scorrano L. Keeping mitochondria in shape: A matter of life and death. Eur J Clin Invest. 2013;43:886–893. doi: 10.1111/eci.12135. [DOI] [PubMed] [Google Scholar]
- 37.Westermann B. Mitochondrial fusion and fission in cell life and death. Nat Rev Mol Cell Biol. 2010;11:872–884. doi: 10.1038/nrm3013. [DOI] [PubMed] [Google Scholar]
- 38.Chalmers S, et al. Selective uncoupling of individual mitochondria within a cell using a mitochondria-targeted photoactivated protonophore. J Am Chem Soc. 2012;134:758–761. doi: 10.1021/ja2077922. [DOI] [PMC free article] [PubMed] [Google Scholar]
- 39.Nussinovitch U, Gepstein L. Optogenetics for in vivo cardiac pacing and resynchronization therapies. Nat Biotechnol. 2015;33:750–754. doi: 10.1038/nbt.3268. [DOI] [PubMed] [Google Scholar]
- 40.Chard PS, Bleakman D, Savidge JR, Miller RJ. Capsaicin-induced neurotoxicity in cultured dorsal root ganglion neurons: Involvement of calcium-activated proteases. Neuroscience. 1995;65:1099–1108. doi: 10.1016/0306-4522(94)00548-j. [DOI] [PubMed] [Google Scholar]
- 41.Wong AKC, et al. Heterogeneity of Ca2+ handling among and within Golgi compartments. J Mol Cell Biol. 2013;5:266–276. doi: 10.1093/jmcb/mjt024. [DOI] [PubMed] [Google Scholar]
- 42.Nita II, et al. The mitochondrial Na+/Ca2+ exchanger upregulates glucose dependent Ca2+ signalling linked to insulin secretion. PLoS One. 2012;7:e46649. doi: 10.1371/journal.pone.0046649. [DOI] [PMC free article] [PubMed] [Google Scholar]
- 43.Nita II, et al. Pancreatic β-cell Na+ channels control global Ca2+ signaling and oxidative metabolism by inducing Na+ and Ca2+ responses that are propagated into mitochondria. FASEB J. 2014;28:3301–3312. doi: 10.1096/fj.13-248161. [DOI] [PMC free article] [PubMed] [Google Scholar]
- 44.Filadi R, et al. Mitofusin 2 ablation increases endoplasmic reticulum-mitochondria coupling. Proc Natl Acad Sci USA. 2015;112:E2174–E2181. doi: 10.1073/pnas.1504880112. [DOI] [PMC free article] [PubMed] [Google Scholar]
- 45.Pancrazi L, et al. Foxg1 localizes to mitochondria and coordinates cell differentiation and bioenergetics. Proc Natl Acad Sci USA. 2015;112:13910–13915. doi: 10.1073/pnas.1515190112. [DOI] [PMC free article] [PubMed] [Google Scholar]
- 46.Robert V, et al. Beat-to-beat oscillations of mitochondrial [Ca2+] in cardiac cells. EMBO J. 2001;20:4998–5007. doi: 10.1093/emboj/20.17.4998. [DOI] [PMC free article] [PubMed] [Google Scholar]
- 47.Parekh AB. Regulation of CRAC channels by Ca2+-dependent inactivation. Cell Calcium. December 16, 2016 doi: 10.1016/j.ceca.2016.12.003. [DOI] [PubMed] [Google Scholar]
Associated Data
This section collects any data citations, data availability statements, or supplementary materials included in this article.


