Significance
Ubiquitination and phosphorylation are the two most important protein posttranslational modifications and cell signals. Ubiquitin can be specifically phosphorylated at S65, and the finding here suggests a general functional role for Ub phosphorylation. We show that subtle fluctuation near physiological pH can affect the protonation status of the S65 phosphoryl group and modulate the structure of the ubiquitin monomer and polyubiquitin. It is known that cellular pH varies among organelles and changes under physiological and pathological conditions. Because ubiquitin is involved in myriad aspects of cell biology, a pH-sensitive conformational switch acquired upon S65 phosphorylation would allow phosphorylated ubiquitin to interact with different target proteins upon environmental cues. It would also enable cross-talk between ubiquitination and phosphorylation signals.
Keywords: ubiquitin, phosphorylation, protein dynamics, pH sensitivity, conformational switch
Abstract
Ubiquitin (Ub) is an important signaling protein. Recent studies have shown that Ub can be enzymatically phosphorylated at S65, and that the resulting pUb exhibits two conformational states—a relaxed state and a retracted state. However, crystallization efforts have yielded only the structure for the relaxed state, which was found similar to that of unmodified Ub. Here we present the solution structures of pUb in both states obtained through refinement against state-specific NMR restraints. We show that the retracted state differs from the relaxed state by the retraction of the last β-strand and by the extension of the second α-helix. Further, we show that at 7.2, the pKa value for the phosphoryl group in the relaxed state is higher by 1.4 units than that in the retracted state. Consequently, pUb exists in equilibrium between protonated and deprotonated forms and between retracted and relaxed states, with protonated/relaxed species enriched at slightly acidic pH and deprotonated/retracted species enriched at slightly basic pH. The heterogeneity of pUb explains the inability of phosphomimetic mutants to fully mimic pUb. The pH-sensitive conformational switch is likely preserved for polyubiquitin, as single-molecule FRET data indicate that pH change leads to quaternary rearrangement of a phosphorylated K63-linked diubiquitin. Because cellular pH varies among compartments and changes upon pathophysiological insults, our finding suggests that pH and Ub phosphorylation confer additional target specificities and enable an additional layer of modulation for Ub signals.
Ubiquitin (Ub), a 76-residue signaling protein, is found ubiquitously in cells. Two or more Ub molecules can be covalently linked to form a diubiquitin (diUb) and then a polyubiquitin (polyUb), as an isopeptide bond is formed between the carboxylate group of one Ub (called the distal Ub) and the amine group of another Ub (called the proximal Ub). Owing to the characteristic quaternary structures of polyUb and specific interactions between polyUb and its target proteins (1, 2), a polyUb with a specific linkage can be involved in a distinctive set of cellular functions (3).
The heterogeneity of Ub also arises from other types of covalent modifications. Proteomics studies have indicated that Ub is phosphorylated at multiple sites (4, 5). However, PINK1 is the only Ub kinase known to date, which specifically phosphorylates Ub at S65 (6, 7). Under normal conditions, only a fraction of Ub is S65-phosphorylated. However, upon oxidative stress, neurodegeneration, or aging, the level of S65 phosphorylation increases significantly (4, 8). S65-phosphorylated Ub (pUb) in turn can activate PARKIN, a ubiquitin ligase, and induce mitophagy (9–12). However, no other pUb-specific targets have been clearly identified, and how phosphorylation affects Ub signaling in general remains unclear.
Previously, Komander and coworkers showed that pUb gives two distinct sets of NMR peaks, which correspond to the two conformational states of pUb exchanging at a slow timescale (13). Based on NMR long-range HNCO experiments, the authors concluded that the two states differ in the hydrogen-bonding network involving the last β-strand (β5)—the β5 moves up by two residues and the C-terminal tail in one conformational state is then retracted. However, crystallization efforts yielded only the structure for the relaxed state, which turned out to be similar to the structure of unphosphorylated wild-type Ub (13, 14). Furthermore, S65D or S65E phosphomimetic mutants of pUb afforded only a single set of NMR peaks (13) and failed to fully mimic S65 phosphorylation (4).
The various organelles and compartments inside a cell are buffered at specific pHs (15). Because Ub is involved in myriad aspects of cellular processes, it is possible that pH may play a role in Ub function. Acids are continuously generated from metabolic activities. Therefore, the homeostasis of cellular pH has to be maintained, and slight pH change, even transient and localized, can serve as a cellular signal (15, 16). For example, the loss of pH gradient across the inner membrane of mitochondria often preludes mitophagy (17), a process involving PARKIN and pUb. Therefore, we hypothesize that pH may regulate the function of pUb during mitophagy as well as other cellular processes.
To understand how S65 phosphorylation and pH may impact Ub signals, we set out to determine the solution structures of pUb in both relaxed and retracted states. We came to discover that the S65 phosphoryl group in the relaxed state has an unusually elevated pKa value, much higher than that in the retracted state. As a result, the pUb interconverts between relaxed and retracted states and also between protonated and deprotonated species, whose equilibrium is shifted in response to slight pH change. Using phosphorylated K63-linked diubiquitin (pK63-diUb) as a reporter, we further show that the pH-dependent conformational switch of pUb can be translated into the rearrangement of Ub subunits in pK63-diUb. Thus, we propose that S65 phosphorylation modulates the structure of polyUb and enables polyUb to interact with different target proteins.
Results and Discussion
The Solution Structure of pUb Relaxed and Retracted States.
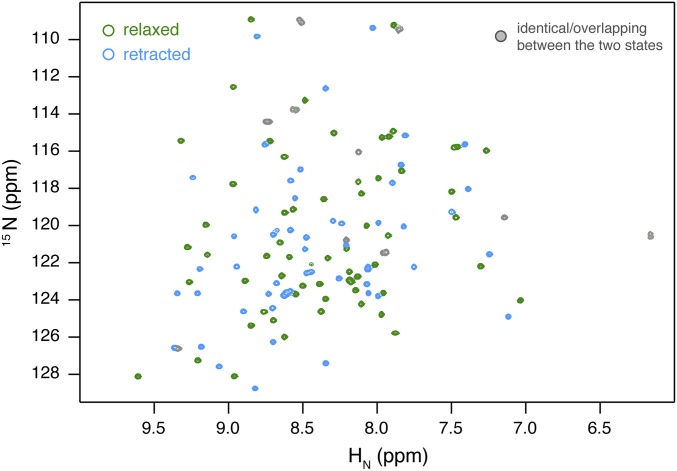
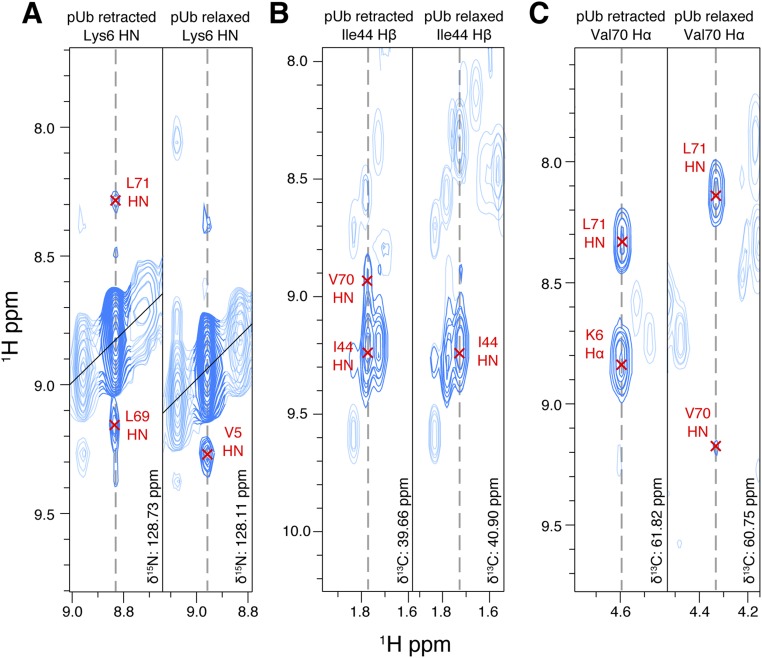
We identified 125 peaks for the backbone amide of pUb in the 1H-15N heteronuclear single-quantum coherence (HSQC) spectrum (Fig. S1). Among these peaks, 59 can be assigned to the relaxed state, 56 can be assigned to the retracted state, and 10 can be assigned to both states. Starting from well-resolved peaks, we could make nearly complete assignment of side-chain resonances and obtain state-specific NOE distance restraints (Fig. S2) and residual dipolar coupling (RDC) restraints. For the 10 overlapped residues, only intraresidue or sequential NOE restraints were applied and no RDC restraints. Refining against the different types of restraints, we determined the solution structures of pUb in both relaxed and retracted states (Table S1).
Fig. S1.
1H-15N HSQC spectrum for pUb collected at pH 7.4 in 20 mM Hepes buffer containing 150 mM NaCl. Many more peaks are observed than the number of residues in ubiquitin, a 76-residue protein. The peaks arise from two species at about equal populations, namely the relaxed state (green contours) and the retracted state (cyan contours). The two species interconvert at a slow timescale relative to their chemical-shift differences, as previously shown (13). There are a total of 125 peaks in the spectrum, among which 59 peaks can be uniquely identified for the backbone amide of the relaxed state and 56 peaks can be uniquely identified for the backbone amide of the retracted state. In addition, there are 10 peaks that can be assigned to a particular residue of either conformational state due to spectral overlap (gray contours). The 10 residues are 10, 25, 34, 35, 36, 39, 52, 60, 61, and 67.
Fig. S2.
State-specific NOEs can be obtained for either the relaxed state or retracted state. Representative strips of NOESY spectra from (A) HN of K6 in the 3D 15N-edited 3D NOESY spectrum, (B) Hβ of I44 in the 13C-edited 3D NOESY spectrum, and (C) Hα of V70 in the 13C-edited 3D NOESY spectrum. Note that these atoms have different chemical shifts and also different NOE cross-peaks between the two states.
Table S1.
Statistics of 30 structures each for the pUb relaxed and retracted states
| Restraints and refinement | Relaxed state* | Retracted state* |
| Number of restraints | ||
| NOEs | 523 | 803 |
| Intra (i = j) | 262 | 420 |
| Short-range (|i − j| < 3) | 140 | 238 |
| Long-range (|i − j| ≥ 3) | 121 | 145 |
| RDCs | ||
| PEG(C12E5)/hexanol HN–N | 49 | 51 |
| Pf1 HN–N | 56 | 44 |
| Pf1 HN–C′ | 55 | 41 |
| H bonds | 46 | 58 |
| Dihedral angles† | ||
| φ/ψ | 142 | 145 |
| 3JHNHA | – | 40 |
| Number of violations (per structure) | ||
| Distance constraints (>0.5 Å) | 0 | 0 |
| Dihedral angle constraints (>5°) | 0 | 0 |
| RMS deviations, Å | ||
| Backbone heavy atoms‡ | 0.24 ± 0.05 | 0.33 ± 0.07 |
| All heavy atoms‡ | 0.77 ± 0.05 | 0.88 ± 0.06 |
| Ramachandran plot, % | ||
| Most favored | 94.5 | 90.2 |
| Additionally allowed | 3.9 | 9.8 |
| Generously allowed | 1.6 | 0 |
| Disallowed | 0 | 0 |
| Z scores | ||
| Second-generation packing quality | −0.758 | −2.010 |
| Ramachandran plot appearance | −0.644 | −2.690 |
| χ1/χ2 rotamer normality | −1.083 | −3.027 |
| Backbone conformation | 2.382 | 1.449 |
For either the relaxed state or retracted state, 160 structures were calculated and 30 structures were selected for their fewest violations of restraints and lowest overall energy. The structures were assessed with PROCHECK and WHATIF (61, 62). The structures for the relaxed state and retracted state have been deposited in the PDB under ID codes 5XK5 and 5XK4, respectively.
The backbone dihedral angle restraints were obtained using TALOS+ (48) from backbone chemical shift values, providing that 9 out of 10 predictions fall into a consistent region of the Ramachandran plot. HNHA scalar coupling restraints were only applied for the structural refinement of the retracted state.
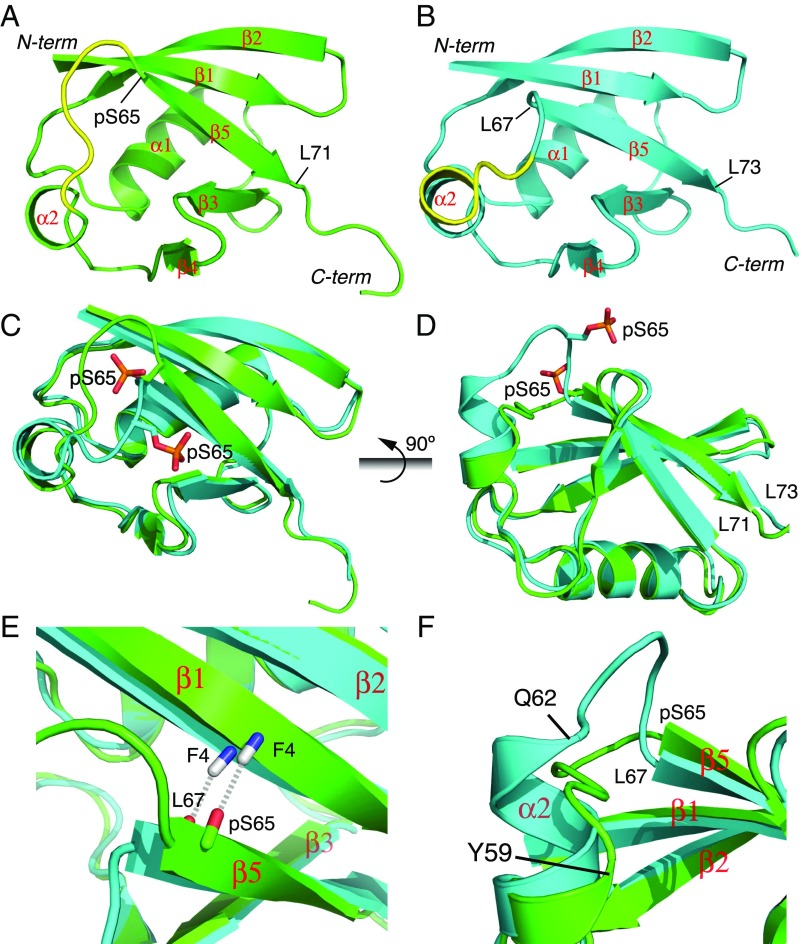
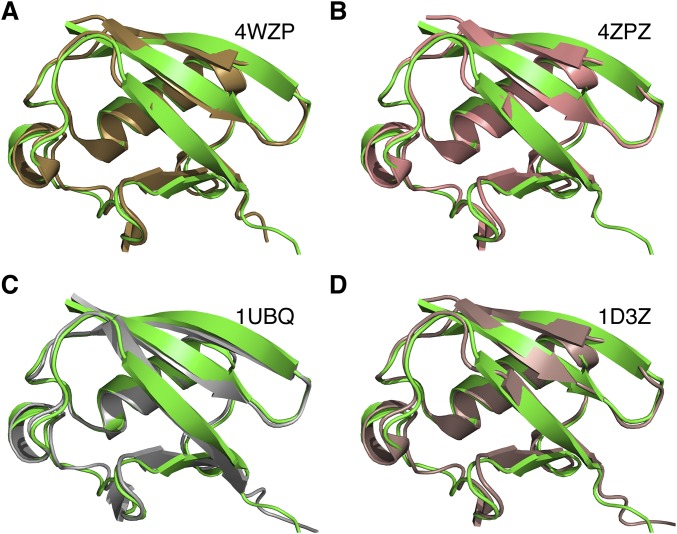
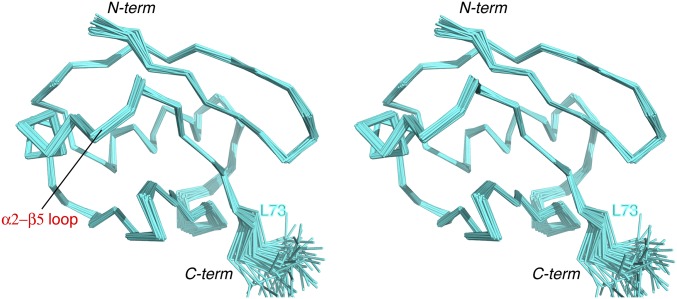
The structure for the relaxed state is well-converged, with a root-mean-square (RMS) deviation of 0.24 ± 0.05 Å for backbone heavy atoms (Fig. 1A and Fig. S3). The relaxed state structure is similar to the crystal structures of pUb previously determined (Fig. S4 A and B) (13, 14), with RMS differences of <0.8 Å for backbone heavy atoms. The solution structure for the relaxed state is also similar to the structure of unphosphorylated Ub, with backbone RMS differences of <0.8 Å (Fig. S4 C and D) (18, 19).
Fig. 1.
Solution structures of pUb. (A) Structure of pUb in the relaxed state. (B) Structure of pUb in the retracted state. The structure shown is closest to the mean, with the secondary structures labeled and α2-β5 loop (residues 60 to 64) highlighted. (C and D) Comparison between the two conformational states of pUb in different perspectives. The backbone RMS difference between the two is 0.79 Å for residues 1 to 58. The last residues in β5 are labeled. (E) Close-up view of strand β5. The amide group of F4, indicated with dashed lines, is hydrogen-bonded to L67 in the retracted state and to pS65 in the relaxed state. (F) Close-up view of helix α2. α2 extends by three residues to Q62 in the retracted state instead of Y59 in the relaxed state.
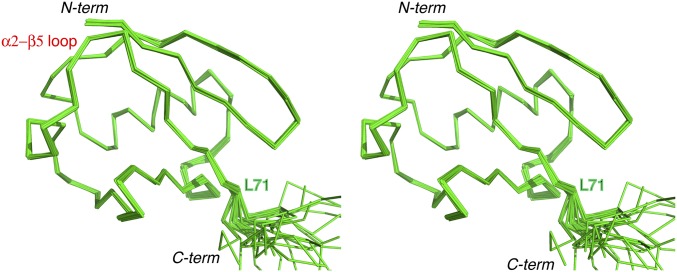
Fig. S3.
Stereoscopic view of the solution structure for the pUb relaxed state. Thirty structures are selected from 160 structures calculated for their lowest energy, and are superimposed by the rigid portion of the protein (residues 1 to 72). The RMS deviation for backbone heavy atoms of the rigid residues is 0.24 ± 0.05 Å, and the RMS deviation for all heavy atoms is 0.77 ± 0.05 Å.
Fig. S4.
Structural comparison of the pUb relaxed state. Shown in green cartoon is the solution structure closest to the mean we have determined herein. This structure is compared with (A) the crystal structure of pUb in the relaxed state (13), (B) the crystal structure of pUb in the relaxed state (14), (C) the crystal structure of wild-type Ub, and (D) the NMR structure of wild-type Ub, the first model. Protein Data Bank (PDB) structure ID codes are labeled; the backbone RMS differences for residues 1 to 72 are 0.804, 0.807, 0.685, and 0.696 Å, respectively.
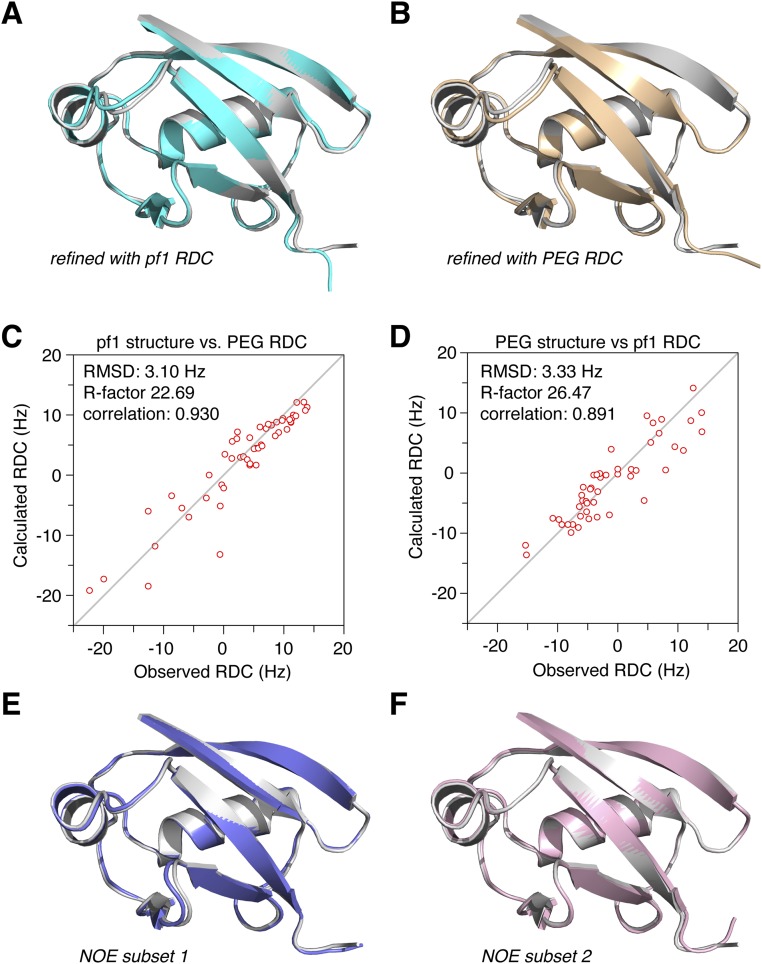
The structure for the retracted state also converges well, with a backbone RMS deviation of 0.33 ± 0.07 Å (Fig. 1B, Fig. S5, and Table S1). To assess the accuracy of the structure, we performed multiple cross-validations. Leaving out one set of RDC restraints, we could still obtain the structure of the retracted state, which is similar to the structure obtained by refining against the full set of restraints (Fig. S6 A and B). Significantly, the free RDC restraints can be cross-validated with the working structures (Fig. S6 C and D). We also refined the structure of the retracted state with a subset of randomly selected NOE distance restraints. Regardless, the calculations afforded similar structures (Fig. S6 E and F). It means that the NOEs are self-consistent, and unlikely to arise from a different conformational state of pUb.
Fig. S5.
Stereoscopic view of the solution structure for the pUb retracted state. Thirty structures are selected from 160 structures calculated for their lowest energy, and are superimposed by the rigid portion of the protein (residues 1 to 74). The structures are viewed from the same perspective as in Fig. S3. The RMS deviation for backbone heavy atoms of rigid residues is 0.33 ± 0.07 Å, and the RMS deviation for all heavy atoms is 0.88 ± 0.06 Å. Compared to Fig. S3, there are fewer flexible residues at the C terminus.
Fig. S6.
Cross-validation of the pUb retracted state structure. (A and B) Structures refined with only one set of the RDC restraints for backbone amide bond vectors, obtained in the alignment medium of either pf1 phage (cyan cartoon) or PEG(C12E5)/hexanol (yellow cartoon). Superimposed on the structure calculated with a full set of restraints (gray cartoon), the backbone RMS differences are 0.43 and 0.47 Å, respectively. (C and D) Correlations between the observed and calculated RDCs from the structure obtained with the RDC restraints excluded. The agreement is reasonably good for the cross-validated RDC restraints. (E and F) Structures refined with a subset of NOE distance restraints, with 10% of the NOEs randomly removed. The resulting structures have RMS differences of 0.29 and 0.27 Å from the structure calculated with the full set of restraints (gray cartoon), respectively.
Structural comparison reveals the difference between the two states of pUb. As previously shown (13), the strand β5 moves up by two residues in the retracted state. The β5 in the retracted state comprises residues L67 to L73, and the backbone carbonyl group of L67 forms an interstrand hydrogen bond with the amide group of F4 (Fig. 1 C and E). In the relaxed state, β5 comprises residues pS65 to L71, with the carbonyl group of pS65 hydrogen-bonded to the amide group of F4. In addition to β5 retraction, helix α2 extends by three more residues in the retracted state ending at Q62, as opposed to Y59 in the relaxed state (Fig. 1 D and F). Accompanying the secondary structure changes, the residues in the loop connecting α2 and β5 undergo a large movement, as large as ∼10 Å, between the two conformational states (Fig. 1 A and B).
pH Regulates the Abundance of the Two pUb States.
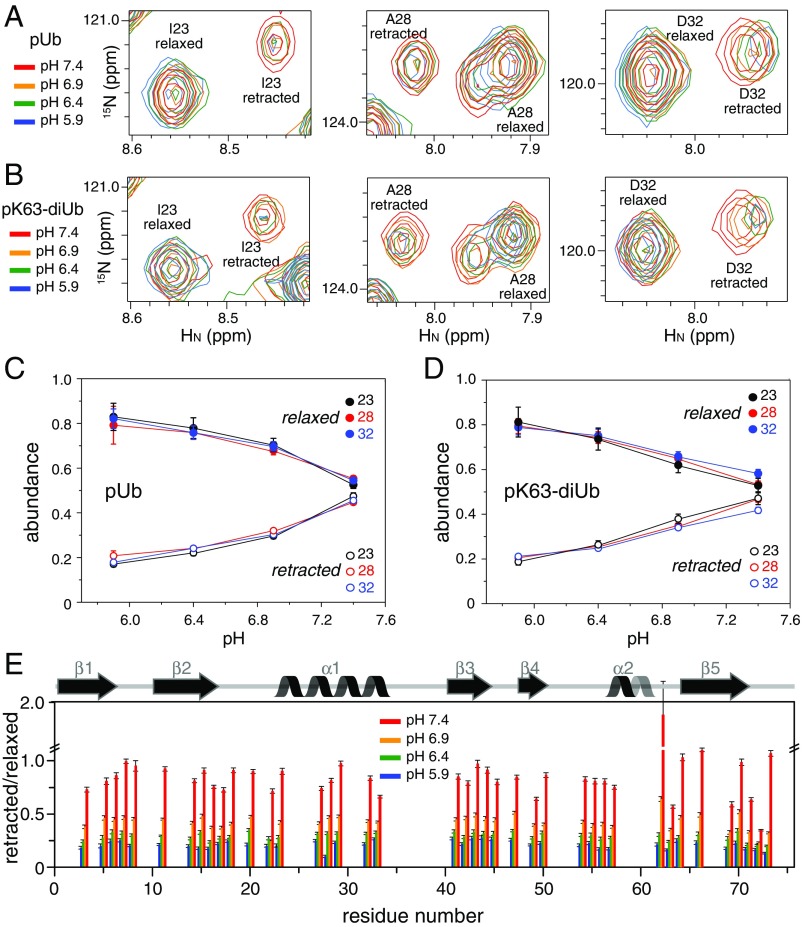
At pH 7.4, we found that the well-resolved peaks for the two conformational states of pUb have nearly the same peak intensities. However, in the previous NMR study done at a slightly lower pH, it was found that the relaxed state of pUb had a larger population (13). To assess whether the difference in the relative peak intensities arises from different buffer conditions, we collected 1H-15N HSQC spectra of pUb at pH values of 7.4, 6.9, 6.4, and 5.9. As the pH decreases, the peak intensities for the retracted state decrease, whereas the peak intensities for the same residues in the relaxed state increase (Fig. 2 A and C).
Fig. 2.
Changes of NMR peak intensities in response to pH. (A and B) Overlay of 15N-HSQC spectra for residues I23, A28, and D32 in pUb and the proximal Ub of pK63-diUb, respectively. The data were collected at 298 K with the proteins prepared in 20 mM Pipes buffer containing 150 mM NaCl. These residues are far from pS65, and experience relatively little chemical-shift perturbations upon pH change. (C and D) The abundance of the relaxed or retracted state, roughly proportional to the peak intensities, is plotted as a function of pH. (E) Relative peak intensity for all of the residues in pUb. Only the peaks that can be quantified for both states in all pH conditions are shown. Error bars indicate the SD propagated from the peak-intensity measurements. The secondary structures of pUb are indicated.
The peak intensities of all pUb residues follow the same trend in response to pH, but details vary. At pH 7.4, the relative peak intensities between retracted state and relaxed state can be >1 for some residues but much smaller for some others. For example, the peak intensity of Q62 in the retracted state is 2.21 times that in the relaxed state, whereas the peak intensity of L69 in the retracted state is only 0.59 times that in the relaxed state (Fig. 2E). The deviations likely arise from structural change and local dynamics. Thus, the peak intensities measured from 2D 1H-15N HSQC spectra may not reflect the exact populations of the two states.
S65 Phosphoryl Group in the Relaxed State Has an Unusually High pKa.
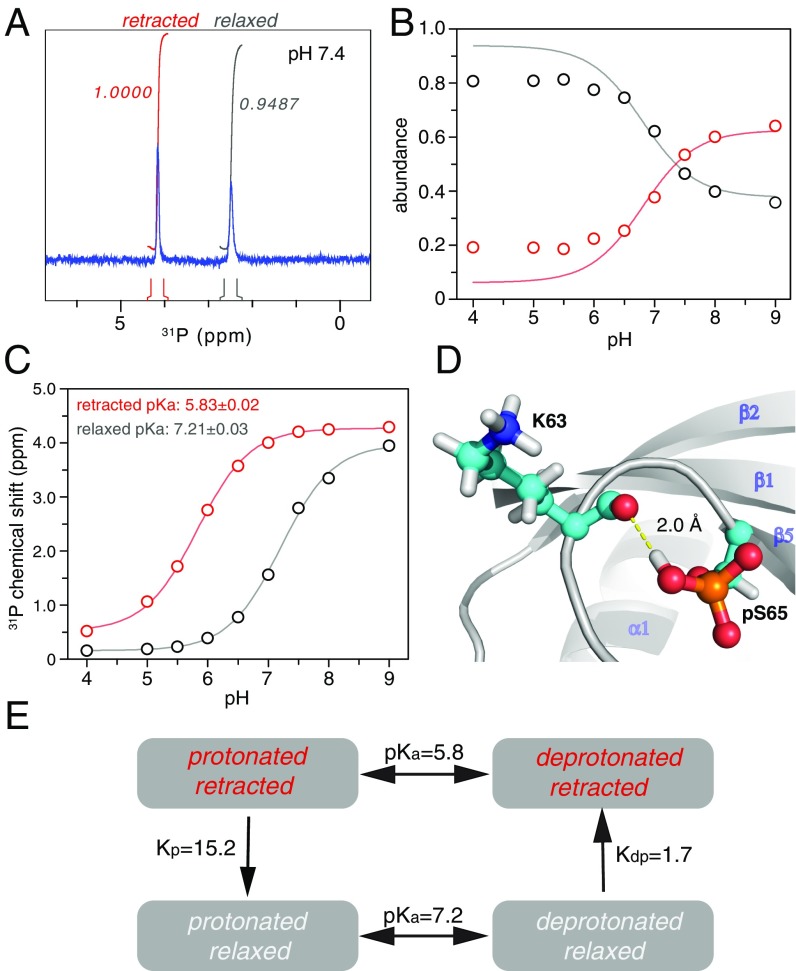
To understand what triggers the interconversion between the two states, we collected a series of 1D 31P spectra over a broad range of pH from 4 to 9. Unlike 2D 1H-15N HSQC spectra, we could easily integrate the volume for each 31P peak, which corresponds to the exact population of the associated conformational state. At pH 7.4, two 31P peaks can be observed, and the integral for the downfield peak is slightly larger than the integral for the upfield peak (Fig. 3A). As pH decreases, the integral for the upfield peak increases and reaches ∼80% of the total pUb; as pH increases, the integral for the downfield 31P increases and reaches ∼60% of the total pUb (Fig. 3B). The change in volumes of the two 31P peaks in response to pH is in good agreement with the pattern identified from 2D 1H-15N HSQC spectra. Therefore, the upfield 31P peak should be from the relaxed state, whereas the downfield 31P peak should be from the retracted state.
Fig. 3.
pUb exists in equilibrium among four chemical species. (A) Two 31P peaks can be observed with about the same integrated peak volumes, which can be assigned to the pS65 phosphoryl group in the retracted state and relaxed state. (B) The relative abundance of the two conformational states, quantitated by 31P peak integrals, changes in response to pH. (C) The 31P chemical-shift value changes in response to pH. The pKa values can be fitted for the retracted state and relaxed state. (D) The unusually high pKa value for the relaxed state can be attributed to a hydrogen bond between the protonated pS65 phosphoryl group and the backbone carbonyl of K63. (E) Illustration of the coupled equilibriums of pUb, with the equilibrium constants denoted. A slight decrease in pH leads to the enrichment of protonated/relaxed species of pUb, whereas a slight increase in pH leads to the enrichment of deprotonated/retracted species of pUb.
The 31P chemical shift is also an ideal indicator for the protonation status of the phosphoryl group, which can differ by up to 4 ppm between deprotonated (dianionic) and protonated (monoanionic) species (20, 21). Both 31P peaks of pUb shift progressively upon pH change, and we could fit the pKa values of 5.83 ± 0.02 and 7.21 ± 0.03 for the retracted state and relaxed state, respectively (Fig. 3C). The pKa value for the retracted state is consistent with the value generally observed for the serine phosphoryl group (21), and is also consistent with the structure of the retracted state in which pS65 is located in a loop and its side chain is solvent-exposed (Fig. 1D). However, the pKa value for the relaxed state is unusually elevated, differing from that of the retracted state by 1.4 pH units.
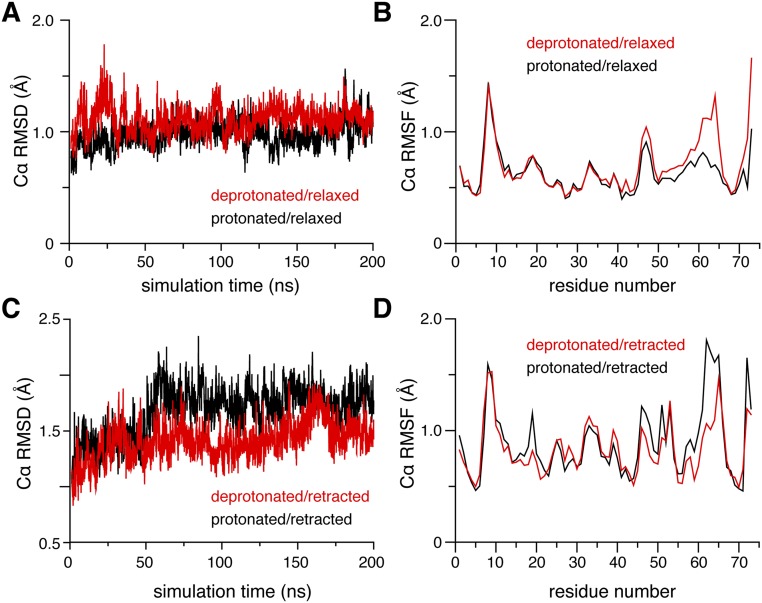
To explain why the pKa value of pS65 in the relaxed state is so elevated, we performed molecular dynamics (MD) simulations for the different species of pUb. As indicated by backbone RMS fluctuations, the protonated/relaxed species is more stable than deprotonated/relaxed species of pUb, whereas the deprotonated/retracted species is more stable than protonated/retracted species of pUb (Fig. S7). Importantly, the simulations revealed that the protonated S65 phosphoryl group in the relaxed state could form a hydrogen bond with the backbone carbonyl group of K63 in an ideal geometry (Fig. 3D). This hydrogen bond would stabilize the protonated/relaxed species of pUb and account for the unusually high pKa value.
Fig. S7.
Molecular dynamics simulations starting from pUb structures. (A and C) Representative trajectories for the pUb relaxed state and retracted state, respectively. Fluctuations in Cα RMSD are shown for residues 1 to 72 for the relaxed state and 1 to 74 for the retracted state. (B and D) The Cα RMSFs calculated with reference to the average conformation of the relaxed and retracted state, respectively.
Based on the pKa values and based on the relative abundance of the two pUb states at various pHs, we determined the equilibrium constants for the interconversion between the relaxed state and retracted state, which are 15.2 ± 1.1 from the protonated/retracted species to the protonated/relaxed species and 1.7 ± 0.1 from the deprotonated/relaxed species to the deprotonated/retracted species (Fig. 3E). As such, the coupled equilibria explain why the protonated/relaxed species is enriched at slight acidic pH and the deprotonated/retracted species is enriched at slightly basic pH. Using these four equilibrium constants, we could also backcalculate the populations for the relaxed and retracted states, which agree well with the experimental values at pH between 6.5 and 8 (Fig. 3B). At more acidic pH, however, the experimental population for the retracted state hovers at ∼0.2, higher than the calculated value. It is possible that additional factors such as protonation of neighboring E64 may help to stabilize the retracted state at acidic pH.
Ub Phosphomimetic Mutants Are Similar to Wild Type.
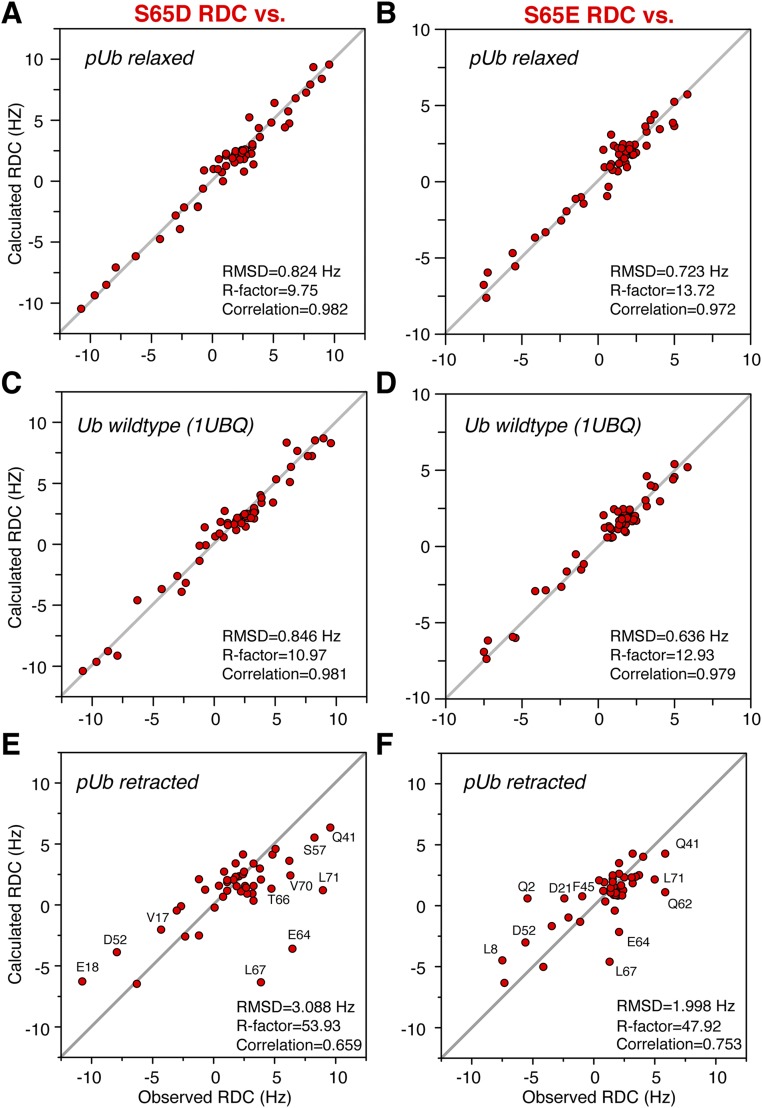
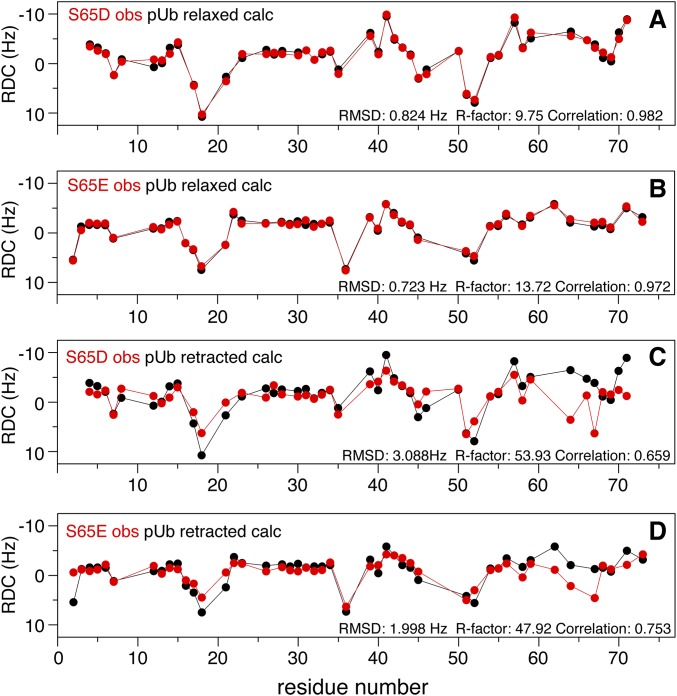
Glutamate or aspartate substitution of serine is commonly used for mimicking phosphorylated serine, as it can be easily engineered. However, a previous NMR study showed that the mutant has only one set of NMR peaks (13). Here we collected the backbone RDC values for Ub S65E and S65D mutants and assessed them against the structures of the relaxed state of pUb and unmodified wild-type Ub (Fig. S8). The good correlations between the observed and calculated RDCs indicate that the structures of phosphomimetic mutants are similar to the structure of the relaxed state. On the other hand, the RDC values measured for the phosphomimetic mutants agree poorly with the structure of the retracted state, with the largest discrepancies observed for residues in β5 and the α2-β5 loop (Figs. S8 and S9).
Fig. S8.
Assessment of the structures of Ub phosphomimetic mutants. Residual dipolar couplings for backbone NH bond vectors were collected for Ub S65D and Ub S65E mutants in 6% PEG(C12E5)/hexanol alignment medium. The experimental RDC values were compared (A and B) against the solution structure of the pUb relaxed state (this study; the conformer closest to the mean), (C and D) against the crystal structure of wild-type Ub (PDB ID code 1UBQ), and (E and F) against the solution structure of the pUb retracted state (this study; the conformer closest to the mean). Outliers in the correlation plots are labeled. For each assessment, the RMS difference, RDC R factor, and correlation coefficient are given.
Fig. S9.
Assessment of the structures of Ub phosphomimetic mutants by residue. The observed RDC values for the mutants collected in PEG(C12E5)/hexanol alignment medium are compared with the calculated RDC values based on (A and B) relaxed and (C and D) retracted state structures of pUb. For each assessment, the RMS difference, RDC R factor, and correlation coefficient are given.
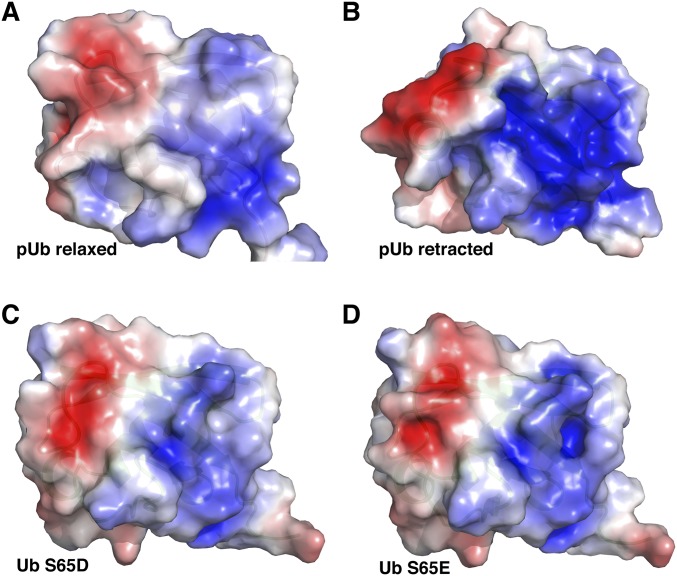
We also compared the electrostatic potentials of the various structures (Fig. S10). The electrostatic surface of the S65E or S65D mutant appears similar to that of the protonated/relaxed species of pUb. However, pUb can carry two negative charges at residue 65 either in its relaxed state or retracted state, which would have drastically different electrostatic surfaces. Hence, the different charge states and conformational heterogeneity of pUb explain why glutamate or aspartate substitution poorly mimics Ub S65 phosphorylation.
Fig. S10.
Electrostatic surface of ubiquitin for the (A) pUb relaxed state with pS65 protonated, carrying (−1) formal charge, (B) pUb retracted state with pS65 in deprotonated form carrying (−2) formal charge, (C) S65D mutant of Ub, and (D) S65E mutant of Ub. The phosphomimetic mutants were constructed in PyMOL from the wild-type Ub (PDB ID code 1UBQ). The PQR files with partial charges assigned to atoms were generated at the PDB2PQR server. The parameters for phosphorylated groups in the −1 and −2 charge states were taken from ref. 40. The electrostatic potential is calculated with the APBS plugin in PyMOL, in the presence of 150 mM NaCl. The molecular surface of Ub is colored by electrostatic potential, displayed in a scale from red (−3 kT/e) to blue (+3 kT/e). Note that electrostatic surfaces of the phosphomimetic mutant would look less similar to the pUb relaxed state if the latter were deprotonated.
pH Modulates Quaternary Structures of Phosphorylated Diubiquitin.
Because polyUb is the predominant form in cells (22), we asked whether the structure and dynamics of phosphorylated polyUb are also affected by pH. K63 is close to the phosphorylation site, and moves by ∼10 Å between the two conformational states of pUb. Thus, the quaternary structures of K63-linked diubiquitin (K63-diUb) may be affected by S65 phosphorylation. With an unlabeled pUb attached at K63 of an 15N-labeled pUb, we evaluated the peak intensities of proximal pUb in response to pH. Just like the pUb monomer, the peak intensities of the relaxed state in pK63-diUb also decrease when the pH increases, and at pH 7.4 have nearly the same intensities as the corresponding peaks in the retracted state (Fig. 2 B and D). Because the relative abundance of the two states is dictated by the equilibrium shift among the four pUb species (Fig. 3E), it can be reasoned that the proximal pUb in pK63-diUb has the same pH-sensitive conformational switch as the pUb monomer does.
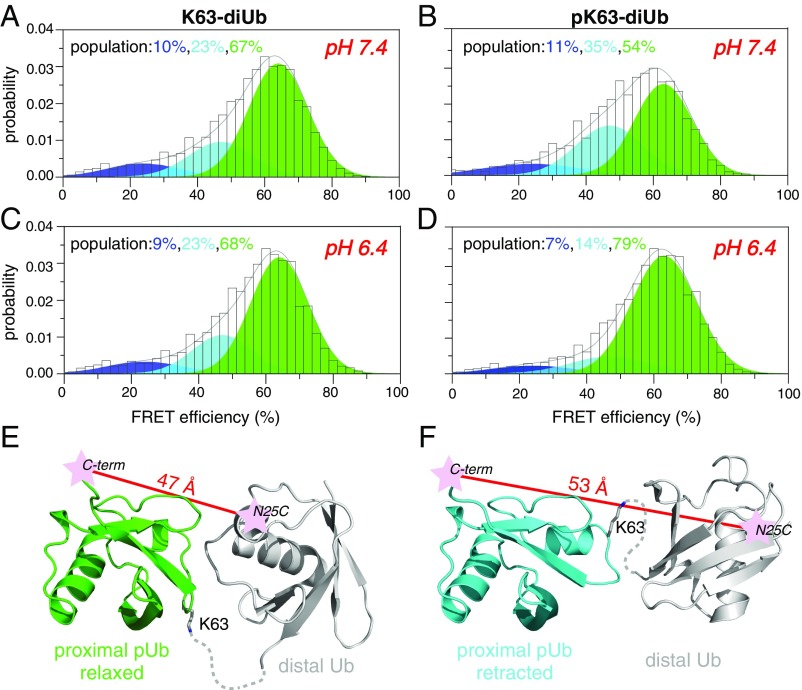
We have shown previously that K63-diUb adopts three interconverting conformational states, each responsible for recognizing a specific target protein (2). Also in that study, we showed that the two closed states of K63-diUb, namely C1 and C2, are populated at a 3:1 ratio in the absence of a target protein. Here, using single-molecule fluorescence resonance energy transfer (smFRET) with fluorophores conjugated at the N25C site of distal Ub and G76C site of proximal Ub, we directly visualized the conformational distribution of K63-diUb. The single-molecule measurement allows a straightforward assessment of the constituting conformational states in a dynamic system without the complication from ensemble averaging (23, 24). At pH 7.4, we found that the smFRET profile of K63-diUb can be fitted as the sum of three Gaussian functions (Figs. S11–S13). Centering at FRET efficiencies of about 24, 47, and 64%, the populations for the low-, medium-, and high-FRET species are 10, 23, and 67%, respectively (Fig. 4A). The high-FRET and medium-FRET species have a ratio of 3:1, suggesting that these two species correspond to the two closed states previously characterized (2). When the pH is dropped to 6.4, the smFRET profile for K63-diUb remains the same (Fig. 4C), indicating that the structure of unphosphorylated K63-diUb is insensitive to pH.
Fig. S11.
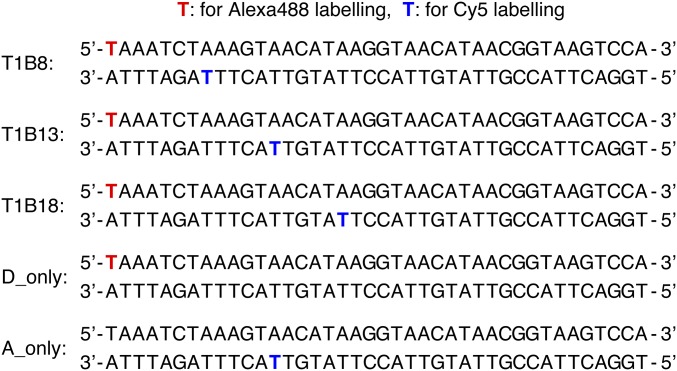
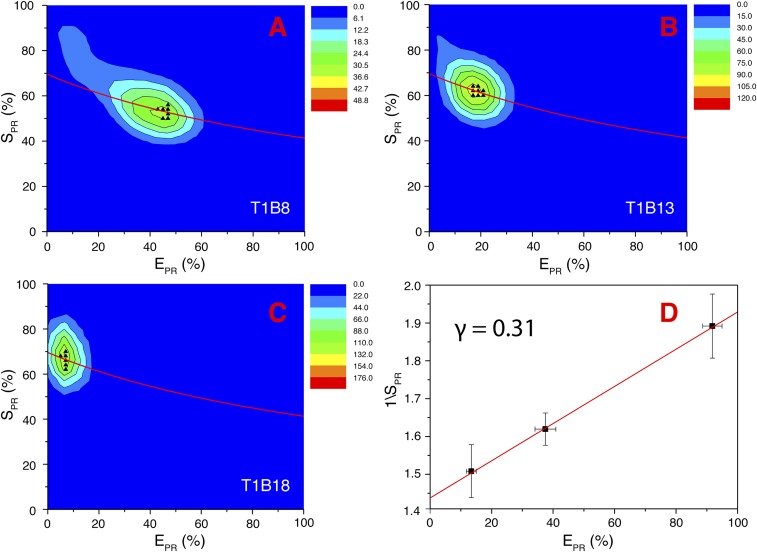
DNA oligonucleotides used for assessing smFRET parameters. After annealing, double-stranded DNA oligonucleotides were prepared in 20 mM Hepes, 100 mM NaCl, 1 mM EDTA, 0.01% (vol/vol) Tween 20 (pH 7.0) buffer, with additional 1 mM l-ascorbic acid and 1 mM methylviologen (60). The donor-only and acceptor-only DNA duplex samples were used to measure the cross-talk terms. The Lk term (donor emission leaked to the acceptor channel) was determined from the fDexAem/fDexDem ratio for the donor-only sample, and the Di term (direct excitation of the acceptor) was determined from the fDexAem/fAexAem ratio for the acceptor-only sample. The Lk term was determined at ∼0.08, whereas the Di term was ∼0.09 for the Alexa Fluor 488–Cy5 pair by our instrumentation. The doubly labeled duplex DNA sample with various donor–acceptor distances (separated by increasing the number of base pairs) was used to determine the correction coefficient γ (cf. Fig. S12). The determination of Di and Lk values allows accurate determination of the FRET efficiency.
Fig. S13.
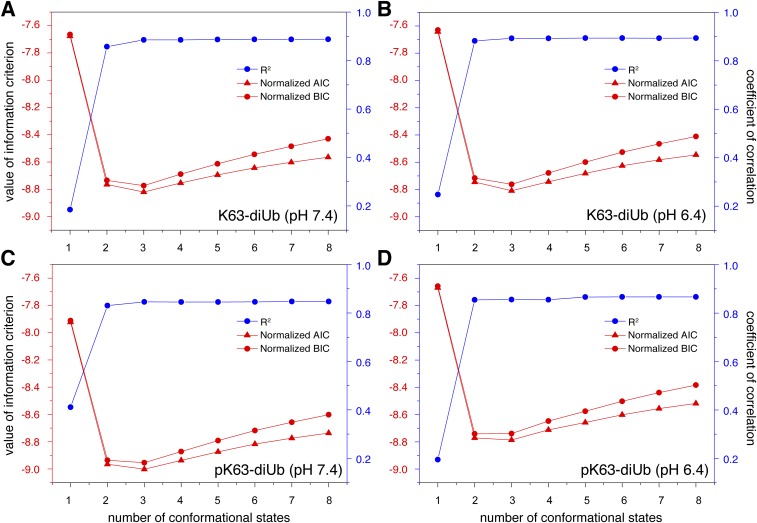
Statistical analysis of smFRET data. Here we use AIC and BIC criteria (57) to identify the number of conformational states that best reproduce the observed smFRET data for (A and B) K63-diUb and (C and D) pK63-diUb at pH 7.4 and 6.4. The smFRET data were obtained with the fluorophores attached to the C terminus of the proximal Ub and the N25C site of the distal Ub in K63-diUb (or pK63-diUb). Besides the AIC and BIC parameters, the overall correlation coefficient R2 was also assessed, which is defined as 1 − RSS/TSS (RSS, sum of the square of residuals; TSS, total sum of the squares). Penalized for additional fitting parameters, both normalized AIC and BIC values reach minima with a three-state model for each system analyzed here.
Fig. 4.
Quaternary structure of pK63-diUb is pH-sensitive. (A and C) The smFRET profile of K63-diUb can be fitted as the sum of three FRET species. Centering at efficiencies of 24.3 ± 1.5, 47.4 ± 0.6, and 63.8 ± 0.6%, the populations for the three species are 10.0 ± 0.5, 22.7 ± 1.0, and 67.3 ± 1.4% at pH 7.4, and 9.2 ± 0.4, 23.2 ± 0.9, and 67.6 ± 0.7% at pH 6.4. (B and D) The smFRET profile of pK63-diUb can also be fitted as the sum of three FRET species. The populations for the three species are 10.9 ± 0.8, 34.1 ± 0.4, and 55.0 ± 0.7% at pH 7.4, and 6.8 ± 1.6, 14.0 ± 2.3, and 79.2 ± 1.4% at pH 6.4. (E and F) Structural models for the high- and medium-FRET species of pK63-diUb. Providing that the pH-sensitive movement of the α2-β5 loop is piggybacked onto the intrinsic subunit movement of K63-diUb, the FRET distance (indicated by red lines) is shorter when the proximal Ub is in the relaxed state (green cartoon) than it is in the retracted state (cyan cartoon). The Ub linkage is indicated with dashed lines.
Using the same labeling scheme, we characterized the conformational space of pK63-diUb. Its smFRET profile can also be fitted as the sum of three FRET species, which center at the same FRET efficiencies as those observed for K63-diUb. However, the population for the high-FRET species is only 54% at pH 7.4, whereas the population for the medium-FRET species is 35% for pK63-diUb (Fig. 4B). As the pH decreases to 6.4, the smFRET profile can still be fitted to three Gaussian functions (Fig. S13). However, more than 20% of the protein is converted from the medium-FRET species to the high-FRET species, with the latter populated at 79% (Fig. 4D).
Determination of the ensemble structures of pK63-diUb would be complicated, as it involves a permutation of the two conformational states for each Ub subunit. Thus, we modeled the structures based on the known ensemble structures of K63-diUb (2). Randomizing the configurations of the fluorophores attached to the C1 and C2 closed-state structures, we obtained interdye distances of 50.4 ± 9.7 and 56.1 ± 9.2 Å, respectively. The distances are in good agreement with the distances computed based on the FRET efficiencies, 47.4 and 53.2 Å for high- and medium-FRET species, respectively. Thus, the pH-sensitive movement of the α2-β5 loop and residue K63 in pUb may be piggybacked onto the domain movement of K63-diUb—the proximal pUb in the relaxed state appears compatible with the C1 closed state (Fig. 4E), and the proximal pUb in the retracted state appears compatible with the C2 closed state (Fig. 4F). This would explain why a pH decrease leads to the conversion from the medium-FRET species to the high-FRET species of pK63-diUb. Because the quaternary arrangement between Ub subunits is responsible for target specificity (1, 2), S65 phosphorylation would allow polyUb to interact with target proteins differently at different pHs.
Concluding Remarks
With the joint use of multiple biophysical techniques, we show here that the structure of pUb exists in equilibrium between protonated and deprotonated species and between retracted and relaxed states. Thanks to a hydrogen bond between the protonated phosphoryl group and the backbone carbonyl of K63, the S65 phosphoryl group in the relaxed state has an elevated pKa value of 7.2. Consequently, any pH change can cause a shift of the equilibrium, enriching protonated/relaxed species or deprotonated/retracted species. pH-sensitive conformational switches have been reported for many other proteins (25–27). It has also been reported that K48-linked diubiquitin switches from a closed conformation to a predominant open conformation at pH 4.5 (28, 29). However, these examples of acid–base equilibrium all involve protein titratable side chains. Thus it is particularly interesting that a phosphoryl group can respond to subtle fluctuation around physiological pH and trigger a protein conformational switch.
The pH-sensitive conformational switch of the pUb monomer leads to the structural rearrangement of phosphorylated polyUb. The different quaternary structures of a polyUb would then confer upon the polyUb additional target specificities (1, 2). It is well-known that the different cell compartments are homeostatic at specific pHs. For example, the pH is ∼7.2 in the cytosol and nucleus, ∼8 inside mitochondria, between 6.0 and 6.7 in the Golgi, and more acidic in endosomes, ranging from 5.5 to 6.5 (15). Thus, the pH sensitivity may allow polyUb to perform location-specific functions. Moreover, the kinase of pUb, PINK1, is either anchored at mitochondria or exists as a soluble form in the cytosol (30). Thus, phosphorylated polyUb can be either recruited or generated on-site. Upon oxidative stress, neurodegeneration, and aging, Ub phosphorylation level drastically increases (4, 8, 31), whereas mitophagy, apoptosis, ischemia, inflammation, aging, and many pathophysiological conditions are all associated with changes in cellular pH (32–35). Altogether, it is likely that certain functions of pUb are only turned on in response to changes in both Ub phosphorylation level and environmental pH. Our finding thus opens a door for the better understanding of how phosphorylation regulates ubiquitin signaling.
Materials and Methods
Full methods are provided in SI Materials and Methods. Proteins were prepared following established protocols (13, 36, 37). NMR data collection was performed with Bruker 500-, 600- or 850-MHz spectrometers. The solution structures for the two states of pUb were refined using Xplor-NIH (38). Proteins labeled with Alexa Fluor 488 and Cy5 dyes were analyzed using a confocal microscope equipped with picosecond-pulsed lasers using an interleaved pulsing scheme (39). MD simulations were performed using AMBER 14 with the established parameters for phosphoserine (40).
SI Materials and Methods
Preparation of Protein Samples.
The Ub monomer was expressed and purified as previously described (41). For isotope enrichment, 1 g/L U-15N–labeled NH4Cl (Isotec) and/or 2 g/L U-13C–labeled glucose (Isotec) were added to Escherichia coli culture as the sole nitrogen and/or carbon source. Preparation of K63-linked diUb was based on the established protocol (36) as previously described (37). To prepare the NMR sample described in Fig. 2B, unlabeled Ub (with a K63R point mutation introduced) was conjugated to another U-15N–labeled Ub (with an additional C-terminal residue of 77D).
PINK1 from body louse (phPNK1) was prepared as previously described (13). For S65 phosphorylation, PINK1, Ub (or K63-diUb), MgCl2, and ATP were mixed at the molar ratio of 1:100:5,000:5,000 in 20 mM Tris buffer (pH 8.0, containing 1 mM DTT). The reaction proceeded at room temperature overnight. The product pUb (or pK63-diUb) was purified using a Source Q column (GE Healthcare), buffer-exchanged, and confirmed with electrospray mass spectrometry (Bruker Daltonics).
Alexa Fluor 488 C5 maleimide (Alexa488; Thermo Fisher) and Cy5 maleimide (GE Healthcare) were used as fluorescence donor and acceptor, respectively. To introduce the dyes, an N25C point mutation was introduced to the distal Ub of K63-diUb (or pK63-diUb), and a G76C mutation was introduced to the proximal Ub, using the QuikChange approach. The Förster distance R0 for the Alexa488 and Cy5 pair is 52 Å (42). The dyes were first dissolved in DMSO to 1 mM concentration, and freshly prepared just before conjugation. The DTT in the buffer for the K63-diUb cysteine mutant was removed with desalting, and the protein was reacted with the premixed Alexa488 and Cy5 dyes at a molar ratio of 1:4:4. The conjugation reaction was performed in the dark at room temperature for 4 h, and the product was purified using a Source Q column (GE Healthcare). The fractions for the doubly labeled K63-diUb had absorptions at 280, 493, and 650 nm, and the protein fractions collected were further confirmed using mass spectrometry (Bruker Daltonics). The concentration for the doubly labeled K63-diUb was measured by UV at 493-nm absorption (the molar extinction coefficient is 72,000 cm−1⋅M−1 for Alexa488) and by UV at 650-nm absorption (the molar extinction coefficient is 250,000 cm−1⋅M−1 for Cy5), which gave the same concentrations.
NMR Experiments and Structure Calculation.
NMR samples were prepared in 20 mM Hepes buffer (pH 7.4 unless otherwise noted, with the addition of 150 mM NaCl in 10:90% D2O/H2O; Pipes buffer was used for pH titrations). NMR data were acquired at 298 K on Bruker 500, 600-, and 850-MHz spectrometers equipped with cryogenic probes. The data were processed with NMRPipe (43). A suite of NMR experiments including 1H-15N HSQC, HNCACB, CBCACONH, HNCO, HCCONH, and CCONH was acquired for backbone and side-chain assignment. Because the relaxed state and retracted state interconvert at a slow timescale (13), 59 peaks out of 125 peaks in the 1H-15N HSQC can be assigned to the relaxed state, 56 peaks can be assigned to the retracted state, and 10 peaks can be assigned to a particular residue of either state.
The 13C-edited and 15N-edited 3D NOESY spectra were collected with a mixing time of 120 ms for distance restraints. State-specific assignment of side-chain resonances and NOEs was made with CCPN analysis (44). For RDC measurement, two different alignment media, pf1 phage (9 mg/mL; ASLA) and PEG(C12E5)/hexanol (6%; Sigma-Aldrich) were used (45, 46). The in-phase/anti-phase versions of 1H-15N HSQC and HNCO spectra were acquired in the absence or presence of the alignment media (47). One-bond HN–N and two-bond H–C′ RDC restraints were obtained for the well-resolved residues in the relaxed state and retracted state, respectively. The NMR restraints also include backbone dihedral angle restraints using TALOS+ (48) and φ-angle restraints based on three-bond HΝ–Hα scalar coupling (49). Simulated annealing refinement was performed using Xplor-NIH for the relaxed state and retracted state of pUb separately, by refining against the experimental restraints (Table S1) with the addition of a weak radius-of-gyration restraint (50) and knowledge-based database restraint (51).
A total of 160 structures were calculated for each state, and 30 structures were selected for their lowest energy and smallest deviation from the mean structure. To cross-validate, we took a subset of the NOEs (∼10%; free NOEs), and used the remaining NOEs (working NOEs) for structural refinement. The resulting structures were assessed against the structures obtained with the full set of restraints, which was repeated 10 times. The same procedure was also performed for RDC restraints, to assess self-consistency of the restraints and evaluate the accuracy of the retracted state structure. Similarly, cross-validation was performed for the structural refinement of the relaxed state. The structure figures are rendered with PyMOL (version 1.7; Schrödinger). The partial charge was generated with PDB2PQR (52), with the addition of parameters for phosphorylated serine (40). The electrostatic potential colored onto the protein surface was rendered in PyMOL with the APBS plug-in.
For pH titrations, the NMR samples were prepared in 20 mM Pipes buffer with 150 mM NaCl, and were carefully taken out from the NMR tube each time to adjust the pH using a Micro Combination pH electrode (Mettler Toledo). The 31P 1D spectrum was recorded for pUb on a Bruker 500-MHz spectrometer equipped with a BBO cryoprobe. The phosphorus base frequency was 202.456 MHz, and 0 ppm was referenced to 10% phosphoric acid (53). Protons were decoupled with WALTZ16 (54) during 31P channel acquisition. With an interscan delay of 1.5 s, 2,048 transients were accumulated. The 1D NMR data were processed and integrated using Bruker TopSpin 3.0. The 31P chemical-shift value for the relaxed state or retracted state as a function of pH was fitted to acid–base equilibrium to afford the pKa value. The zero-order equilibrium constants, including Kp = [protonated/relaxed]/[protonated/retracted] and Kdp = [deprotonated/retracted]/[deprotonated/relaxed], were calculated by globally fitting to 31P peak integrals at pH 6.5 to 9 and to the pKa values of the two states.
Molecular Dynamics Simulations.
The simulations for pUb under different protonation status were performed in AMBER 14 using the ff12SB force field. The starting conformer is the NMR structure calculated for the relaxed and retracted states, and pS65 in monoanionic or dianionic forms is patched using the established parameters (40). The protein was solvated in a cube containing TIP3P water molecules, with 10-Å padding in every direction. The structures were first energy-minimized at 298 K, and the MD trajectories were recorded for 200 ns, affording 2,000 snapshots at 100-ps intervals. The Cα root-mean-square deviation (RMSD) for residues 1 to 72 of the relaxed state (residues 1 to 74 of the retracted state) was calculated for each snapshot during the simulation, and the Cα root-mean-square fluctuation (RMSF) values were calculated over the entire trajectory with reference to the average conformation. Three structures were selected from the NMR structures calculated for the relaxed state and retracted state, and used as the starting structure for MD simulation. Each structure is either protonated or deprotonated, and three independent MD trajectories were run for each species of the pUb, that is, for a total of six runs for each starting conformer. Analysis of hydrogen bonds was performed for the simulation trajectories using the PTRAJ module in AMBER with default criteria.
Single-Molecule FRET Measurement.
An A1 confocal microscope (Nikon) was used for single-molecule imaging, and a pulsed interleaved excitation (PIE) scheme (39) was used with two SPCM-AQRH detectors (Excelitas) for recording fluorescence time traces at two different wavelengths. Two picosecond-pulsed diode laser heads (LDH-P-C-485B and LDH-P-C-640B; PicoQuant) were driven by a PDL 828 Sepia II driver (PicoQuant) at a repetition rate of 32 MHz, which allowed interleaved excitations for Alexa488 and Cy5. Each laser was coupled to the A1 microscope through a single-mode fiber, and was reflected by a dichroic mirror through a water-immersion objective (WI 60×, N.A. 1.20; Nikon).
The protein sample was loaded onto a hybridization chamber (Thermo Fisher) glued to a glass coverslip (Thermo Fisher). The laser confocal point was set to ∼80 μm above the coverslip. The excitation power at the back of the objective was ∼100 μW for the 485-nm laser and ∼35 μW for the 640-nm laser, as estimated with a power meter (PM20-FC; Thorlabs). Focused to a 99.6-μm pinhole, the fluorescence emission from the excited protein molecule was collected with the same objective. The donor and acceptor emissions were separated with a dichroic mirror (T600lpxr; Chroma). Donor emission was filtered with an ET550/50-m band pass (Chroma) and acceptor emission was filtered with an ET700/75-m band pass (Chroma), before being focused onto the two SPCM-AQRH detectors.
The fluorescence outputs were recorded with a TimeHarp 260 PCI board (PicoQuant) built into a PC workstation, and the data were stored in the time-tagged time-resolved module (PicoQuant). The photon counts including fDex/Dem, fDex/Aem, and fAex/Aem were obtained by binning the photons in 500-µs bins using SymPhoTime64 software (PicoQuant). Here, fDex/Dem represents the photon count for the donor excitation and donor emission channel, fDex/Aem represents the photon count for the donor excitation and acceptor emission channel, and fAex/Aem represents the photon count for the acceptor excitation and acceptor emission channel. With all three fluorescence time traces recorded, the signals from donor-only or acceptor-only protein molecules were filtered out, so as to ensure that an fDex/Aem photon only arises from a doubly labeled protein. Burst search was performed using a start/stop criterion as described (55, 56).
The parameters for instrumentation and fluorophores were calibrated following the established protocol (55). Double-stranded DNA oligonucleotides with different donor–acceptor distances, that is, the fluorophore conjugation sites separated by various numbers of bases (Fig. S11), were used to determine the detection correction factor γ and the cross-talk terms (Fig. S12). The cross-talk terms included the donor emission detected by the acceptor channel (donor leakage; abbreviated Lk) and the acceptor emission excited by the donor excitation wavelength (acceptor direct excitation; abbreviated Di). Alexa488 was conjugated to the C6-amino group of a dT nucleotide at the 5′ end of one oligonucleotide strand, whereas Cy5 was conjugated to the C6-amino group of an internal dT nucleotide of another oligonucleotide strand. The fluorophore-conjugated oligonucleotides were purchased from Sangong Biotech and further purified using a Source Q column. The purified single-stranded DNA oligonucleotides were mixed at room temperature in pH 8.0 buffer containing 40 mM Tris⋅HCl and 500 mM NaCl, heated to 95 °C for 2 min, and gradually cooled down to room temperature in the dark for annealing. To ensure complete hybridization for the acceptor-labeled DNA strand, the donor-labeled strand had 50% molar excess (the donor-only double-stranded DNA could be filtered out using the PIE scheme). To prepare the donor-only and acceptor-only double-stranded DNA, a 10-fold excess of unlabeled DNA strand was used for annealing.
Fig. S12.
Determination of the correction coefficient γ. γ is defined as ηAemφA/ηDemφD, in which φA and φD are the quantum yields of the acceptor and donor fluorophores, respectively, and ηAem and ηDem are the detection efficiencies for the acceptor and donor channel detectors, respectively. (A–C) Using the three DNA samples shown in Fig. S11, we measured the FRET efficiencies and ensured >3 counts per bin for photon time trace fAex/Aem and >4 counts per bin for photon time trace fDex/Dem, to remove donor-only and acceptor-only species. Two-dimensional heat maps were plotted for the cross-talk–corrected proximity FRET transfer efficiency ratio EPR versus the cross-talk–corrected stoichiometry ratio SPR. The SPR is defined as (fDex/Dem + fDex/Aem − Lk − Di)/(fDex/Dem + fDex/Aem + fAex/Aem − Lk − Di). (D) Fitting a linear function between 1/SPR and EPR, (55), we obtained the γ-value at 0.31 and the β-value at 1.42. The errors in the plot correspond to the diameters in the hottest bin in both dimensions of the heat maps. Calibration of the γ-value allows accurate determination of the FRET efficiency.
The donor and acceptor fluorophores were conjugated at the same pair of sites for K63-diUb or pK63-diUb. The smFRET measurements were performed at 25 °C in 20 mM Pipes, pH 7.4 or 6.4 buffer, both containing 150 mM NaCl, 0.01% (vol/vol) Tween 20 (Thermo Fisher), 1 mM l-ascorbic acid, and 1 mM methylviologen (Sigma-Aldrich). The concentration of the doubly labeled protein sample was ∼150 pM. The smFRET data were collected for ∼2 h. The threshold for photon count traces fDex/Dem, fDex/Aem, and fAex/Aem was 3 to 7 counts per bin depending on the background dark counts. To be classified as a burst, the total photon counts (fDex/Dem + fDex/Aem) in the burst had to be at least 25 above the background threshold.
To assess the number of constituting conformational states for K63-diUb from the smFRET data, we used the expectation-maximization (EM) algorithm (57) for fitting multi-Gaussian mixture models. The EM algorithm was coded in-house and implemented in GNU Octave (https://www.gnu.org/software/octave/). First, the program makes a hypothesis about the number of different components that make up the observed smFRET data and then it calculates the likelihood for the corresponding parameters, and finally the program adjusts the parameters to maximize the likelihood. For evaluating the number of Gaussian components, we introduced Bayesian information criterion (BIC) (58) and Akaike information criterion (AIC) (59) terms, in addition to an overall correlation coefficient, R2 (Fig. S13). The errors associated with Gaussian species were obtained from triplicate experiments. A bootstrap resampling method was also used to estimate the errors, which are generally smaller (<1%). The C1 and C2 closed-state structures of K63-diUb (2) were used to compute the theoretical interdye distances, with the mutations of N25C in the distal Ub and G76C in the proximal Ub first introduced using PyMOL. Alexa488 and Cy5 dyes were patched onto the structures in two alternative combinations. With the rigid aromatic rings grouped, the bonds between the protein backbone and aromatic rings were allowed to rotate when permitted by the local structure. The optimization was performed in Xplor-NIH, and the conformers with the lowest van der Waals and covalent energy terms were selected.
Acknowledgments
We thank Prof. Xin-Sheng Zhao for advice on smFRET data collection, and Chao Huang at ETSC Technologies and Chun-Yuan Zhou and Hong-Yi Chen at Nikon China for help with instrumentation. Grant support from the Chinese Ministry of Science and Technology (2013CB910200 to C.T. and W.-P.Z.; 2016YFA0501200 to C.T., Z.G., and X.D.), National Natural Science Foundation of China (31225007 to C.T.; 81573400 to W.-P.Z.; 31500595 to Z.L.; 31400735 to Z.G.; 31400644 to X.D.), and K.C. Wong Education Foundation made this research possible. Z.L. was supported in part by China Postdoctoral Science Foundation Grants 2015M571860 and 2016T90537. The research of C.T. was supported in part by an International Early Career Scientist grant from the Howard Hughes Medical Institute.
Footnotes
The authors declare no conflict of interest.
This article is a PNAS Direct Submission.
Data deposition: The atomic coordinates for the pUb retracted state and relaxed state have been deposited in the Protein Data Bank, www.pdb.org (PDB ID codes 5XK4 and 5XK5, respectively), and the associated NMR chemical shifts and restraints have been deposited in the BioMagResBank, www.bmrb.wisc.edu (accession nos. 36081 and 36082, respectively).
This article contains supporting information online at www.pnas.org/lookup/suppl/doi:10.1073/pnas.1705718114/-/DCSupplemental.
References
- 1.Ye Y, et al. Ubiquitin chain conformation regulates recognition and activity of interacting proteins. Nature. 2012;492:266–270. doi: 10.1038/nature11722. [DOI] [PMC free article] [PubMed] [Google Scholar]
- 2.Liu Z, et al. Lys63-linked ubiquitin chain adopts multiple conformational states for specific target recognition. eLife. 2015;4:e05767. doi: 10.7554/eLife.05767. [DOI] [PMC free article] [PubMed] [Google Scholar]
- 3.Yau R, Rape M. The increasing complexity of the ubiquitin code. Nat Cell Biol. 2016;18:579–586. doi: 10.1038/ncb3358. [DOI] [PubMed] [Google Scholar]
- 4.Herhaus L, Dikic I. Expanding the ubiquitin code through post-translational modification. EMBO Rep. 2015;16:1071–1083. doi: 10.15252/embr.201540891. [DOI] [PMC free article] [PubMed] [Google Scholar]
- 5.Swatek KN, Komander D. Ubiquitin modifications. Cell Res. 2016;26:399–422. doi: 10.1038/cr.2016.39. [DOI] [PMC free article] [PubMed] [Google Scholar]
- 6.Koyano F, et al. Ubiquitin is phosphorylated by PINK1 to activate parkin. Nature. 2014;510:162–166. doi: 10.1038/nature13392. [DOI] [PubMed] [Google Scholar]
- 7.Kane LA, et al. PINK1 phosphorylates ubiquitin to activate Parkin E3 ubiquitin ligase activity. J Cell Biol. 2014;205:143–153. doi: 10.1083/jcb.201402104. [DOI] [PMC free article] [PubMed] [Google Scholar]
- 8.Swaney DL, Rodríguez-Mias RA, Villén J. Phosphorylation of ubiquitin at Ser65 affects its polymerization, targets, and proteome-wide turnover. EMBO Rep. 2015;16:1131–1144. doi: 10.15252/embr.201540298. [DOI] [PMC free article] [PubMed] [Google Scholar]
- 9.Wauer T, Simicek M, Schubert A, Komander D. Mechanism of phospho-ubiquitin-induced PARKIN activation. Nature. 2015;524:370–374. doi: 10.1038/nature14879. [DOI] [PMC free article] [PubMed] [Google Scholar]
- 10.Sauvé V, et al. A Ubl/ubiquitin switch in the activation of Parkin. EMBO J. 2015;34:2492–2505. doi: 10.15252/embj.201592237. [DOI] [PMC free article] [PubMed] [Google Scholar]
- 11.Lazarou M, et al. The ubiquitin kinase PINK1 recruits autophagy receptors to induce mitophagy. Nature. 2015;524:309–314. doi: 10.1038/nature14893. [DOI] [PMC free article] [PubMed] [Google Scholar]
- 12.Kumar A, et al. Parkin-phosphoubiquitin complex reveals cryptic ubiquitin-binding site required for RBR ligase activity. Nat Struct Mol Biol. 2017;24:475–483. doi: 10.1038/nsmb.3400. [DOI] [PMC free article] [PubMed] [Google Scholar]
- 13.Wauer T, et al. Ubiquitin Ser65 phosphorylation affects ubiquitin structure, chain assembly and hydrolysis. EMBO J. 2015;34:307–325. doi: 10.15252/embj.201489847. [DOI] [PMC free article] [PubMed] [Google Scholar]
- 14.Han C, Pao KC, Kazlauskaite A, Muqit MM, Virdee S. A versatile strategy for the semisynthetic production of Ser65 phosphorylated ubiquitin and its biochemical and structural characterisation. ChemBioChem. 2015;16:1574–1579. doi: 10.1002/cbic.201500185. [DOI] [PMC free article] [PubMed] [Google Scholar]
- 15.Casey JR, Grinstein S, Orlowski J. Sensors and regulators of intracellular pH. Nat Rev Mol Cell Biol. 2010;11:50–61. doi: 10.1038/nrm2820. [DOI] [PubMed] [Google Scholar]
- 16.Dechant R, et al. Cytosolic pH is a second messenger for glucose and regulates the PKA pathway through V-ATPase. EMBO J. 2010;29:2515–2526. doi: 10.1038/emboj.2010.138. [DOI] [PMC free article] [PubMed] [Google Scholar]
- 17.Wang Y, Nartiss Y, Steipe B, McQuibban GA, Kim PK. ROS-induced mitochondrial depolarization initiates PARK2/PARKIN-dependent mitochondrial degradation by autophagy. Autophagy. 2012;8:1462–1476. doi: 10.4161/auto.21211. [DOI] [PubMed] [Google Scholar]
- 18.Vijay-Kumar S, Bugg CE, Cook WJ. Structure of ubiquitin refined at 1.8 Å resolution. J Mol Biol. 1987;194:531–544. doi: 10.1016/0022-2836(87)90679-6. [DOI] [PubMed] [Google Scholar]
- 19.Cornilescu G, Marquardt JL, Ottiger M, Bax A. Validation of protein structure from anisotropic carbonyl chemical shifts in a dilute liquid crystalline phase. J Am Chem Soc. 1998;120:6836–6837. [Google Scholar]
- 20.Bienkiewicz EA, Lumb KJ. Random-coil chemical shifts of phosphorylated amino acids. J Biomol NMR. 1999;15:203–206. doi: 10.1023/a:1008375029746. [DOI] [PubMed] [Google Scholar]
- 21.Platzer G, Okon M, McIntosh LP. pH-dependent random coil (1)H, (13)C, and (15)N chemical shifts of the ionizable amino acids: A guide for protein pKa measurements. J Biomol NMR. 2014;60:109–129. doi: 10.1007/s10858-014-9862-y. [DOI] [PubMed] [Google Scholar]
- 22.Xu P, et al. Quantitative proteomics reveals the function of unconventional ubiquitin chains in proteasomal degradation. Cell. 2009;137:133–145. doi: 10.1016/j.cell.2009.01.041. [DOI] [PMC free article] [PubMed] [Google Scholar]
- 23.Schuler B. Single-molecule FRET of protein structure and dynamics—A primer. J Nanobiotechnology. 2013;11(Suppl 1):S2. doi: 10.1186/1477-3155-11-S1-S2. [DOI] [PMC free article] [PubMed] [Google Scholar]
- 24.Deniz AA. Deciphering complexity in molecular biophysics with single-molecule resolution. J Mol Biol. 2016;428:301–307. doi: 10.1016/j.jmb.2015.12.011. [DOI] [PMC free article] [PubMed] [Google Scholar]
- 25.Schnell JR, Chou JJ. Structure and mechanism of the M2 proton channel of influenza A virus. Nature. 2008;451:591–595. doi: 10.1038/nature06531. [DOI] [PMC free article] [PubMed] [Google Scholar]
- 26.Di Russo NV, Estrin DA, Martí MA, Roitberg AE. pH-dependent conformational changes in proteins and their effect on experimental pK(a)s: The case of Nitrophorin 4. PLOS Comput Biol. 2012;8:e1002761. doi: 10.1371/journal.pcbi.1002761. [DOI] [PMC free article] [PubMed] [Google Scholar]
- 27.Isom DG, et al. Protons as second messenger regulators of G protein signaling. Mol Cell. 2013;51:531–538. doi: 10.1016/j.molcel.2013.07.012. [DOI] [PMC free article] [PubMed] [Google Scholar]
- 28.Hirano T, et al. Conformational dynamics of wild-type Lys-48-linked diubiquitin in solution. J Biol Chem. 2011;286:37496–37502. doi: 10.1074/jbc.M111.256354. [DOI] [PMC free article] [PubMed] [Google Scholar]
- 29.Lai MY, Zhang D, Laronde-Leblanc N, Fushman D. Structural and biochemical studies of the open state of Lys48-linked diubiquitin. Biochim Biophys Acta. 2012;1823:2046–2056. doi: 10.1016/j.bbamcr.2012.04.003. [DOI] [PMC free article] [PubMed] [Google Scholar]
- 30.Gao J, et al. Cytosolic PINK1 promotes the targeting of ubiquitinated proteins to the aggresome-autophagy pathway during proteasomal stress. Autophagy. 2016;12:632–647. doi: 10.1080/15548627.2016.1147667. [DOI] [PMC free article] [PubMed] [Google Scholar]
- 31.Fiesel FC, et al. (Patho-)Physiological relevance of PINK1-dependent ubiquitin phosphorylation. EMBO Rep. 2015;16:1114–1130. doi: 10.15252/embr.201540514. [DOI] [PMC free article] [PubMed] [Google Scholar]
- 32.Matsuyama S, Reed JC. Mitochondria-dependent apoptosis and cellular pH regulation. Cell Death Differ. 2000;7:1155–1165. doi: 10.1038/sj.cdd.4400779. [DOI] [PubMed] [Google Scholar]
- 33.Raimondo JV, et al. Tight coupling of astrocyte pH dynamics to epileptiform activity revealed by genetically encoded pH sensors. J Neurosci. 2016;36:7002–7013. doi: 10.1523/JNEUROSCI.0664-16.2016. [DOI] [PMC free article] [PubMed] [Google Scholar]
- 34.Mabe H, Blomqvist P, Siesjö BK. Intracellular pH in the brain following transient ischemia. J Cereb Blood Flow Metab. 1983;3:109–114. doi: 10.1038/jcbfm.1983.13. [DOI] [PubMed] [Google Scholar]
- 35.Lagadic-Gossmann D, Huc L, Lecureur V. Alterations of intracellular pH homeostasis in apoptosis: Origins and roles. Cell Death Differ. 2004;11:953–961. doi: 10.1038/sj.cdd.4401466. [DOI] [PubMed] [Google Scholar]
- 36.Pickart CM, Raasi S. Controlled synthesis of polyubiquitin chains. Methods Enzymol. 2005;399:21–36. doi: 10.1016/S0076-6879(05)99002-2. [DOI] [PubMed] [Google Scholar]
- 37.Liu Z, Tang C. Ensemble structure description of Lys63-linked diubiquitin. Data Brief. 2016;7:81–88. doi: 10.1016/j.dib.2016.02.003. [DOI] [PMC free article] [PubMed] [Google Scholar]
- 38.Schwieters CD, Kuszewski JJ, Tjandra N, Clore GM. The Xplor-NIH NMR molecular structure determination package. J Magn Reson. 2003;160:65–73. doi: 10.1016/s1090-7807(02)00014-9. [DOI] [PubMed] [Google Scholar]
- 39.Müller BK, Zaychikov E, Bräuchle C, Lamb DC. Pulsed interleaved excitation. Biophys J. 2005;89:3508–3522. doi: 10.1529/biophysj.105.064766. [DOI] [PMC free article] [PubMed] [Google Scholar]
- 40.Homeyer N, Horn AH, Lanig H, Sticht H. AMBER force-field parameters for phosphorylated amino acids in different protonation states: Phosphoserine, phosphothreonine, phosphotyrosine, and phosphohistidine. J Mol Model. 2006;12:281–289. doi: 10.1007/s00894-005-0028-4. [DOI] [PubMed] [Google Scholar]
- 41.Liu Z, et al. Noncovalent dimerization of ubiquitin. Angew Chem Int Ed Engl. 2012;51:469–472. doi: 10.1002/anie.201106190. [DOI] [PMC free article] [PubMed] [Google Scholar]
- 42.Kalinin S, et al. A toolkit and benchmark study for FRET-restrained high-precision structural modeling. Nat Methods. 2012;9:1218–1225. doi: 10.1038/nmeth.2222. [DOI] [PubMed] [Google Scholar]
- 43.Delaglio F, et al. NMRPipe: A multidimensional spectral processing system based on UNIX pipes. J Biomol NMR. 1995;6:277–293. doi: 10.1007/BF00197809. [DOI] [PubMed] [Google Scholar]
- 44.Vranken WF, et al. The CCPN data model for NMR spectroscopy: Development of a software pipeline. Proteins. 2005;59:687–696. doi: 10.1002/prot.20449. [DOI] [PubMed] [Google Scholar]
- 45.Hansen MR, Mueller L, Pardi A. Tunable alignment of macromolecules by filamentous phage yields dipolar coupling interactions. Nat Struct Biol. 1998;5:1065–1074. doi: 10.1038/4176. [DOI] [PubMed] [Google Scholar]
- 46.Rücket M, Otting G. Alignment of biological macromolecules in novel nonionic liquid crystalline media for NMR experiments. J Am Chem Soc. 2000;122:7793–7797. [Google Scholar]
- 47.Ottiger M, Delaglio F, Bax A. Measurement of J and dipolar couplings from simplified two-dimensional NMR spectra. J Magn Reson. 1998;131:373–378. doi: 10.1006/jmre.1998.1361. [DOI] [PubMed] [Google Scholar]
- 48.Shen Y, Delaglio F, Cornilescu G, Bax A. TALOS+: A hybrid method for predicting protein backbone torsion angles from NMR chemical shifts. J Biomol NMR. 2009;44:213–223. doi: 10.1007/s10858-009-9333-z. [DOI] [PMC free article] [PubMed] [Google Scholar]
- 49.Vuister GW, Bax A. Quantitative J correlation: A new approach for measuring homonuclear three-bond J(H(N)H(alpha)) coupling constants in 15N-enriched proteins. J Am Chem Soc. 1993;115:7772–7777. [Google Scholar]
- 50.Schwieters CD, Clore GM. A pseudopotential for improving the packing of ellipsoidal protein structures determined from NMR data. J Phys Chem B. 2008;112:6070–6073. doi: 10.1021/jp076244o. [DOI] [PubMed] [Google Scholar]
- 51.Bermejo GA, Clore GM, Schwieters CD. Smooth statistical torsion angle potential derived from a large conformational database via adaptive kernel density estimation improves the quality of NMR protein structures. Protein Sci. 2012;21:1824–1836. doi: 10.1002/pro.2163. [DOI] [PMC free article] [PubMed] [Google Scholar]
- 52.Dolinsky TJ, Nielsen JE, McCammon JA, Baker NA. PDB2PQR: An automated pipeline for the setup of Poisson–Boltzmann electrostatics calculations. Nucleic Acids Res. 2004;32:W665–W667. doi: 10.1093/nar/gkh381. [DOI] [PMC free article] [PubMed] [Google Scholar]
- 53.Bonev BB, Chan WC, Bycroft BW, Roberts GC, Watts A. Interaction of the lantibiotic nisin with mixed lipid bilayers: A 31P and 2H NMR study. Biochemistry. 2000;39:11425–11433. doi: 10.1021/bi0001170. [DOI] [PubMed] [Google Scholar]
- 54.Shaka AJ, Keeler J, Frenkiel T, Freeman R. An improved sequence for broad band decoupling: WALTZ-16. J Magn Reson. 1983;52:335–338. [Google Scholar]
- 55.Lee NK, et al. Accurate FRET measurements within single diffusing biomolecules using alternating-laser excitation. Biophys J. 2005;88:2939–2953. doi: 10.1529/biophysj.104.054114. [DOI] [PMC free article] [PubMed] [Google Scholar]
- 56.Gopich IV. Accuracy of maximum likelihood estimates of a two-state model in single-molecule FRET. J Chem Phys. 2015;142:034110. doi: 10.1063/1.4904381. [DOI] [PMC free article] [PubMed] [Google Scholar]
- 57.Burnham KP, Anderson DR. Multimodel inference: Understanding AIC and BIC in model selection. Sociol Methods Res. 2004;33:261–304. [Google Scholar]
- 58.Schwarz G. Estimating the dimension of a model. Ann Stat. 1978;6:461–464. [Google Scholar]
- 59.Akaike H. A new look at the statistical model identification. IEEE Trans Automat Contr. 1974;19:716–723. [Google Scholar]
- 60.Vogelsang J, et al. A reducing and oxidizing system minimizes photobleaching and blinking of fluorescent dyes. Angew Chem Int Ed Engl. 2008;47:5465–5469. doi: 10.1002/anie.200801518. [DOI] [PubMed] [Google Scholar]
- 61.Laskowski RA, Rullmannn JA, MacArthur MW, Kaptein R, Thornton JM. AQUA and PROCHECK-NMR: Programs for checking the quality of protein structures solved by NMR. J Biomol NMR. 1996;8:477–486. doi: 10.1007/BF00228148. [DOI] [PubMed] [Google Scholar]
- 62.Hooft RW, Vriend G, Sander C, Abola EE. Errors in protein structures. Nature. 1996;381:272. doi: 10.1038/381272a0. [DOI] [PubMed] [Google Scholar]


