

Abstract
Objective
Anhedonia is central to multiple psychiatric disorders and causes substantial disability. A dimensional conceptualization posits that anhedonia severity relates to a trans-diagnostic continuum of reward deficits in specific neural networks. Prior investigations of functional connectivity related to anhedonia have focused on case-control comparisons in specific disorders, using region-specific seed-based analyses. Here, the authors explore the entire functional connectome in relation to reward responsivity across a population of adults with hetereogenous psychopathology.
Method
In a sample of 225 adults from five diagnostic groups (major depressive disorder, n=32; bipolar disorder, n=50; schizophrenia, n=51, psychosis risk, n=39; and healthy controls, n=53), the authors conducted a connectome-wide analysis examining the relationship between a dimensional measure of reward responsivity (reward sensitivity subscale of the Behavioral Activation Scale) and resting-state functional connectivity using multivariate distance-based matrix regression.
Results
This connectome-wide analysis identified foci of dysconnectivity associated with reward responsivity in the nucleus accumbens (NAc), default mode network (DMN) and cingulo-opercular network (CON). Follow-up analyses revealed dysconnectivity among specific large-scale functional networks and their connectivity with the NAc. Reward deficits were associated with decreased connectivity between the NAc and DMN and increased connectivity between the NAc and CON. In addition, impaired reward responsivity was associated with DMN hyper-connectivity and diminished connectivity between DMN and CON.
Conclusions
These results emphasize the centrality of the nucleus accumbens in the pathophysiology of reward deficits and suggest that dissociable patterns of connectivity among large-scale networks are critical to the neurobiology of reward dysfunction across clinical diagnostic categories.
INTRODUCTION
Anhedonia, defined as diminished reward responsivity, is central to a wide range of psychiatric disorders. In mood disorders such as major depressive disorder (MDD) and bipolar disorder (BPD), depression is frequently associated with anhedonia, significantly impacting psychosocial function (1). Similarly, in psychotic disorders such as schizophrenia (SCZ), anhedonia is one of the negative symptoms that lack effective treatments and cause substantial disability (2). The presence of anhedonia across multiple psychiatric disorders suggests common underlying deficits in reward system function. Such a conceptualization accords with the NIMH Research Domain Criteria (RDoC) effort to map transdiagnostic (i.e. across disorder) dimensions of psychopathology, such as anhedonia, to abnormalities in specific brain circuitry (3).
Both animal and human studies consistently implicate the mesolimbic reward system, particularly the ventral striatum (VS) and nucleus accumbens (NAc) in the neurobiology of anhedonia (4). Neuroimaging studies in unipolar depression report VS hypo-responsivity during reward-related tasks (5). A similar blunting of striatal activation is seen in bipolar depression (6), schizophrenia (7) and psychosis risk populations (8). Given that this system has been implicated in multiple disorders, dimensional paradigms have recently been employed to identify common reward valuation abnormalities across disorders (9). We recently demonstrated using task-based fMRI that depression severity is related to blunted VS responses to monetary rewards across unipolar and bipolar depression (6); others have reported similar results across a diverse group of patients with MDD, SCZ, alcohol dependence, ADHD and healthy controls (10). These findings highlight the value of dimensional approaches in identifying common neurobehavioral brain abnormalities (11).
One approach increasingly utilized to investigate circuit-level abnormalities in psychiatric disorders is resting-state (intrinsic) functional connectivity, which examines correlations in activity across different regions and can be used to delineate large-scale functional networks. Functional connectivity abnormalities are found in diverse psychiatric conditions (12,13), suggesting that psychiatric disorders can be studied as syndromes of dysconnectivity. Utilizing resting-state fMRI, several studies in distinct psychiatric disorders have employed seed-based analyses, pre-selecting specific brain regions (seeds) and examining how their activity correlates with activity in the rest of the brain. These studies implicate corticostriatal abnormalities in reward-related symptomatology (14,15).
Studies investigating the relationship between reward-related deficits and functional network abnormalities have been limited, in part, by two factors. First, only a few studies have evaluated these deficits across multiple psychiatric disorders. This diminishes the ability to identify common brain phenotypes underlying reward system deficits associated with anhedonia. Second, most studies have examined functional connectivity on a regional basis using traditional seed-based analyses restricted to a few brain regions. By definition, this approach cannot reveal potentially important effects in brain regions not included in the analysis. In response to these limitations, here we evaluated a large and heterogeneous sample of adults with psychiatric conditions associated with reward abnormalities, including major depression, bipolar disorder, schizophrenia, genetic and clinical psychosis risk, as well as healthy individuals. We conducted a connectome-wide association study (or CWAS), where alterations in functional connectivity are examined across all the inter-regional connections in the brain (16). For this analysis, we used multivariate distance-based matrix regression (MDMR), a statistical procedure suited for analyzing complex neuroimaging data, where there are many biological variables (e.g. image voxels) per subject. Specifically, MDMR examines the overall pattern of connectivity for each individual voxel with all other brain voxels, in relation to a clinical phenotype of interest such as dimensional reward responsiveness. As suggested by the NIMH RDoC initiative (17), we measured anhedonia as a reduction in reward responsivity, using the reward sensitivity subscale of the Behavioral Activation Scale (BAS Reward) (18).
We hypothesized that across the dimension of reward responsivity, this data-driven analysis would reveal common patterns of dysconnectivity involving key elements of the reward system such as the NAc. Our analytic approach was not biased by a priori network selection but rather explored the entire complexity of the functional connectome using MDMR. This strategy was facilitated by a large sample of adults evaluated using a common imaging and phenotyping protocol. As described below, we offer novel evidence of functional network abnormalities associated with deficits in reward responsiveness across clinical diagnostic categories.
METHODS
Participants
For this study, 244 subjects were assessed at two half-day visits using a common imaging and phenotyping protocol. On the first visit, the Structured Clinical Interview for DSM-IV was conducted. On the second visit, assessment of reward responsiveness and neuroimaging was conducted. Subjects were enrolled if they met criteria for major depressive disorder, bipolar disorder, schizophrenia, were at genetic or clinical risk of psychosis (e.g., a first degree relative of an individual with a psychotic disorder or who met clinical high risk criteria for psychosis) or had no Axis I diagnosis (healthy controls). Following quality assurance, the final sample included in the analysis comprised 225 subjects (Table 1). For a list of medications by class, see Table S1. The University of Pennsylvania Institutional Review Board approved all study procedures and all subjects gave informed consent in writing. See Supplementary Methods for additional details.
Table 1.
Demographics of the study participants
| NC | BPD | MDD | SCZ | PR | P value | |
|---|---|---|---|---|---|---|
| n | 53 | 50 | 32 | 51 | 39 | NA |
| Gender (% Female) | 53% | 62% | 50% | 47% | 41% | 0.36 |
| Age (mean, sd in years) | 32.52 (13.0) | 30.58 (10.6) | 40.13 (13.0) | 37.54 (12.0) | 32.84 (16.2) | < 0.01 |
| Education (mean, sd in years) | 14.86 (2.3) | 14.47 (2.2) | 14.10 (2.8) | 13.65 (2.2) | 14.34 (2.4) | 0.12 |
| BAS Reward (mean, sd) | 17.72 (1.8) | 17.06 (2.5) | 16.09 (2.8) | 16.74 (2.6) | 17.44 (1.9) | < 0.05 |
| % taking psychotropic medication | 0% | 92% | 66% | 96% | 15% | < 0.001 |
| In-scanner motion (mean, sd in mm) | 0.08 (0.03) | 0.07 (0.04) | 0.09 (0.05) | 0.09 (0.06) | 0.09 (0.06) | 0.18 |
Abbreviations: BAS reward; Behavioral Activation Scale, reward sensitivity subscale; NA, not applicable; NC, normal controls; BPD, bipolar disorder; MDD, major depressive disorder; SCZ, schizophrenia; PR, psychosis risk
Dimensional assessment of reward responsiveness
To assess reward-related functioning, the Behavioral Activation Scale (BAS) including the reward sensitivity subscale (BAS Reward) was administered (18). BAS Reward was chosen as it has been identified as a transdiagnostic measure of reward responsivity (17) and used to index anhedonia (19). The scale captures a broad range of reward functioning, and is useful for dimensional analyses across both clinical and non-clinical samples (Figure S1). As the initial descriptions of the BAS factor structure considered healthy young adults, we conducted a factor analysis on item-level data to confirm previously identified subfactors including BAS Reward in our clinical sample (Table S2).
Image acquisition and processing
All magnetic resonance imaging data were acquired on the same Siemens 3T MRI scanner using the same imaging sequences, as detailed in Supplementary Methods. Resting-state fMRI bold-oxygen-level dependent (BOLD) time series data were processed to correct image distortion and to minimize the influence of participant motion (20), transformed into a standard anatomical brain space (Montreal Neurological Institute, MNI) and downsampled to a lower spatial resolution prior to CWAS (16).
Connectome-Wide Association Study (CWAS) using MDMR
MDMR relating reward sensitivity to whole-brain connectivity patterns was conducted in three steps (Figure 1). In the first step, the processed voxelwise subject resting-state fMRI data were used to conduct a seed-based connectivity analysis at each gray matter voxel. This step calculates the Pearson’s correlation between each voxel’s BOLD time series and that of every other voxel within gray matter. In the second step, the overall pattern of connectivity for each voxel was compared between the subjects using a distance metric. The distance metric quantifies the similarity in the pattern of connectivity between each pair of subjects (16). Finally, in the third step, MDMR was used to test how well the dimensional variable of interest (BAS Reward) explained the distances between each subject’s pattern of connectivity at that seed voxel, while controlling for the effects of nuisance covariates such as clinical group status, age, sex, and in-scanner motion (21). This MDMR procedure identified voxels where BAS Reward affected the overall pattern of connectivity. As in Shehzad et al., the false positive error rate (type I error) of MDMR was controlled using cluster-correction with a voxel height of z>1.64 (16), and utilized a cluster-extent probability threshold P<0.01 (22). Cortical projections of MDMR statistical maps were displayed using Caret (23). (See Supplementary Methods for additional details).
Figure 1.
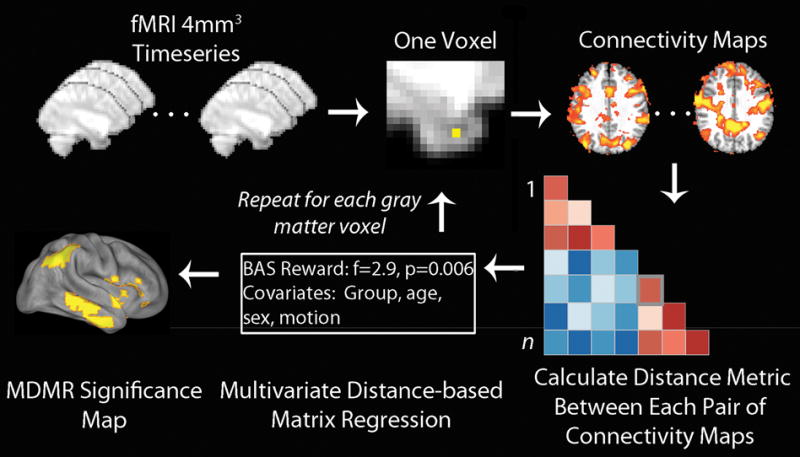
Connectome-wide analysis using multivariate distance-based matrix regression (MDMR). Template-space functional time series were resampled at 4mm3 for computational feasibility. For each gray matter voxel a connectivity map was created for each subject, which were compared in a pairwise manner to create a distance matrix. MDMR used these distance matrices to evaluate the complex multivariate pattern of connectivity in association with reward responsivity (BAS Reward) across subjects while controlling for clinical group, age, sex and in-scanner motion. This yielded a pseudo-F statistic and a corresponding P value through permutation testing. This procedure was repeated for each gray matter voxel, yielding a voxel-wise significance map. Modified with permission from Shehzad et al. (16).
Follow up seed-based analyses
Although MDMR identifies clusters where the overall multivariate pattern of connectivity is dimensionally related to BAS Reward, it does not describe the specific pattern of connectivity that is driving the significant result. As in prior studies (24,25), we conducted post-hoc seed-based analyses from each cluster returned by MDMR, followed by network analyses of these regions (described below). Group-level seed analyses included covariates as above. These follow-up analyses subsequent to MDMR are applied descriptively, as the seeds were selected based on the significance of the MDMR result. Further details are described in the Supplementary Methods.
Network construction and analysis
In order to summarize the observed pairwise interactions among the implicated brain regions, we evaluated the data within a network framework. We constructed a graph of cortical nodes consisting of clusters identified by MDMR. As in prior work, subcortical nodes such as the NAc were not included in detecting cortical modules (26). The graph was separated into distinct network modules using community detection techniques (described in Supplementary Methods). Differences in connectivity among the cortical modules and with the NAc were investigated using measures of within-network and between network connectivity (27). Within-network connectivity was defined as the mean correlation strength of all edges within a network module. In contrast, between-network connectivity was defined on a pairwise basis as the mean strength of edges between nodes within a network module and nodes outside the module (27). The relationship of BAS Reward to these connectivity measures was examined using linear regression, with covariates as detailed above.
Supplementary analyses
To evaluate within-group dimensional effects, we conducted separate analyses examining network-level associations for each diagnostic group and specific sub-groups, as well as for a psychopathology-only sample that excluded healthy controls. Additionally, we explored differences in network-level measures among categorical diagnostic groups. Furthermore, to assess specificity for our clinical phenotype, we compared network associations among the BAS subscales and with diagnosis-specific disease severity measures (see Supplementary Methods). Although the above analyses accounted for variables including clinical group, age, sex and in-scanner motion, we also conducted additional analyses including smoking status as a covariate. Finally, we also included composite medication load as a confound variable in network analyses, based on a previously described method (28).
RESULTS
MDMR identifies multiple foci of connectivity related to reward responsivity
MDMR revealed multiple regions where the multivariate pattern of connectivity was dimensionally related to reward sensitivity across clinical diagnostic categories (Figure 2). These regions included bilateral NAc and a set of widely distributed cortical regions (bilateral temporoparietal junction, right insular cortex, right inferior and left superior lateral temporal cortex, left lateral orbitofrontal cortex and left dorsomedial frontal cortex) (Table S3). As these results do not describe which specific connections form the basis for the observed multivariate results, each significant MDMR cluster was next evaluated using a standard seed-based connectivity analysis.
Figure 2.
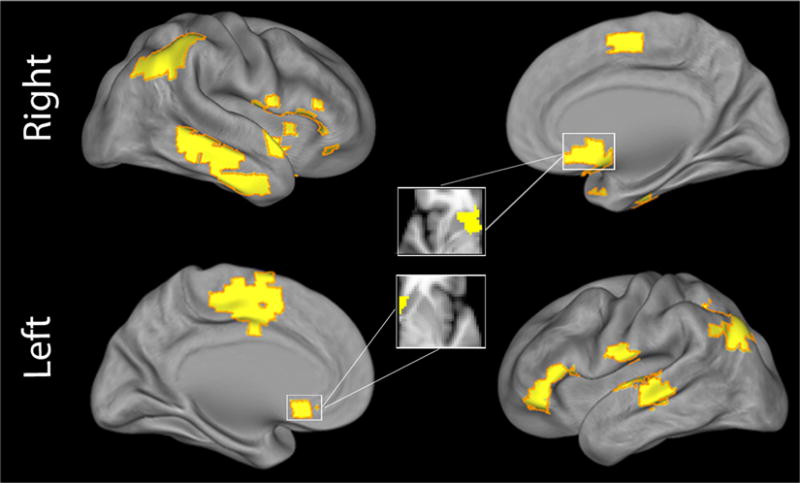
MDMR identified multiple foci of connectivity related to reward responsivity. Cortical projection displaying clusters identified by multivariate distance-based matrix regression (MDMR) where BAS Reward affected the overall multivariate pattern of functional connectivity. All clusters corrected for multiple comparisons at z>1.64, P<0.01.
Seed-based connectivity analyses explain patterns of connectivity that drive MDMR results
Follow-up analyses used the regions identified by MDMR as the basis for seed-based connectivity analyses, which examined the connectivity from a given region with the rest of the brain on a voxelwise basis. These analyses demonstrated that the multivariate results from MDMR were driven by altered patterns of connectivity impacting elements of the default mode network (DMN) and cingulo-opercular network (CON) (Figure 3). With increasing BAS Reward, NAc connectivity increased with elements of the DMN, including the temporoparietal junction, lateral temporal cortex, anterior medial prefrontal cortex, and posterior cingulate cortex (Figure 3A). Conversely, NAc connectivity decreased with elements of the CON, including the insular cortex and dorsomedial frontal cortex (including supplementary motor regions). Within clusters in the DMN, higher BAS Reward was associated with a dissociable pattern of diminished connectivity with other elements of the DMN, as well as increased connectivity with CON regions (Figure 3B). Similarly, for clusters in the CON, higher BAS Reward was associated with decreased connectivity with other parts of the CON and increased connectivity with DMN regions (Figure 3C).
Figure 3.
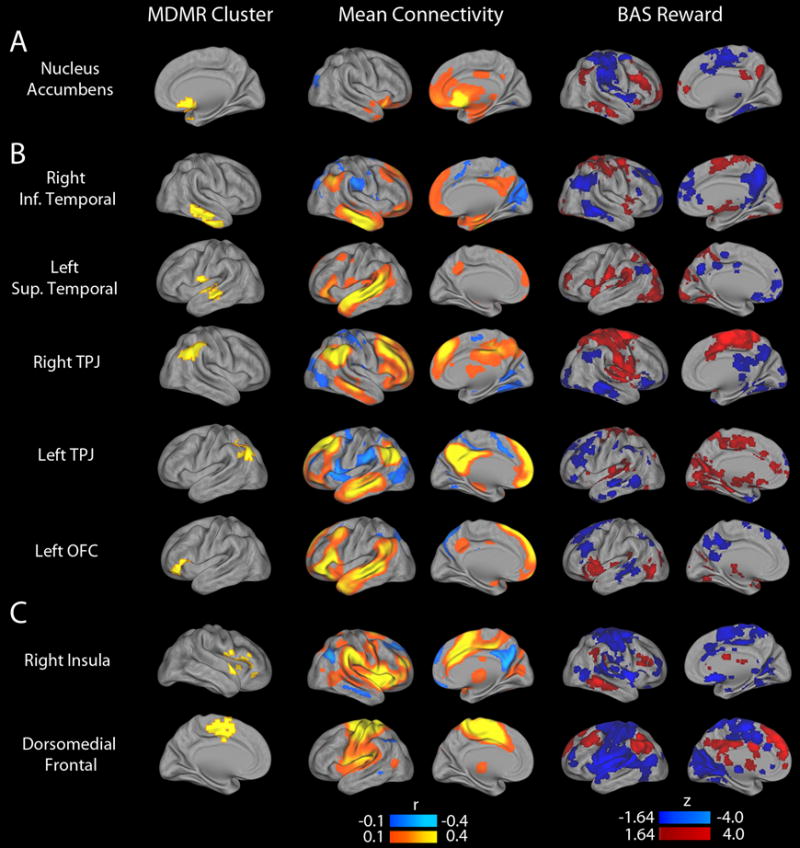
Follow-up seed-based connectivity analyses explain patterns of connectivity that drive MDMR results. The multivariate results of the connectome-wide association study (CWAS) identified the nucleus accumbens (A), default mode regions (B) and cingulo-opercular regions (C) where the overall pattern of connectivity is related to reward responsivity, but did not delineate the nature of those patterns. Accordingly, each cluster identified by CWAS (left column) was used as a seed to identify what changes in connectivity led to the significant finding. The middle column displays the mean connectivity across all subjects from each seed. The right column displays the association with BAS Reward for each seed.
Reward deficits are associated with a dissociable pattern of within- and between-network connectivity
The results of the seed based analyses suggested common patterns of dysconnectivity involving the NAc, DMN, and CON. In order to concisely summarize these effects, we conducted network analyses where nodes were centered upon the clusters identified by MDMR (Figure 4). Application of community detection procedures to the cortical regions identified by MDMR revealed two network modules: a DMN module (blue in Figure 3A) and a CON module (red). The integrity of these modules was confirmed through permutation testing (DMN: P=1.95 × 10⁻⁴; CON: P=2.39×10⁻⁴).
Figure 4.
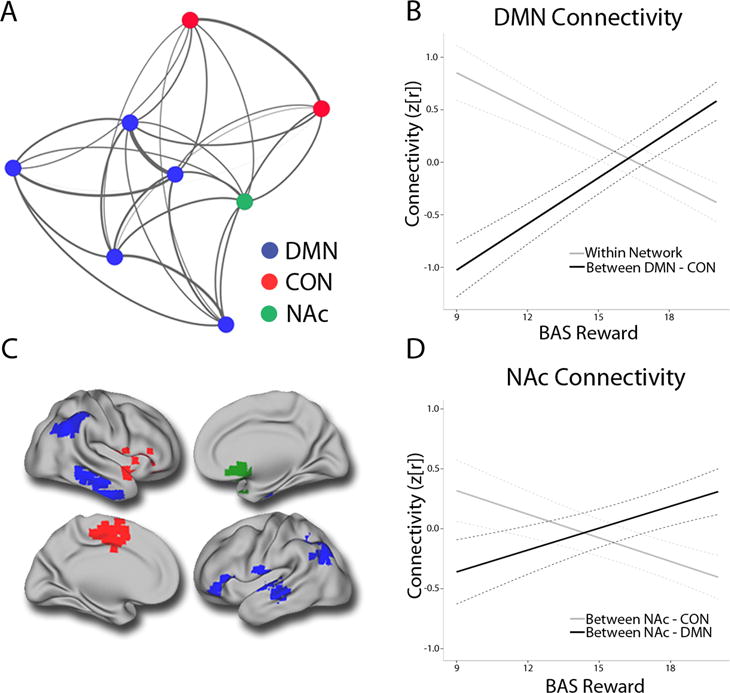
Dissociable patterns of within and between-network connectivity dimensionally relate to reward deficits across psychiatric disorders. Layout of mean connectivity within a network of nodes defined by multivariate distance-based matrix regression (MDMR) (Panel A). DMN hyperconnectivity and decreased connectivity between DMN and CON regions scales with reward deficits (Panel B). Cortical projection displaying the NAc (green) along with DMN (blue) and CON regions (red) (Panel C). Reward deficits are related to dissociable patterns of NAc dysconnectivity, including diminished connectivity with the DMN and increased connectivity with the CON (Panel D). DMN=default mode network; CON=cingulo-opercular network; NAc= nucleus accumbens.
These network modules were used to derive summary measures of within-network and between-network connectivity for each cortical network as well as the NAc. This approach demonstrated that deficits in reward responsivity were associated with DMN hyperconnectivity (t=3.75, P=2.3 × 10⁻⁴) and decreased integration between DMN and CON networks (t=−5.17, P=5.3 × 10⁻⁷). In addition, reward deficits were associated with decreased connectivity between NAc and DMN (t=−2.45, P=1.5 × 10⁻²) and increased connectivity between NAc and CON (t=3.35, P=9.4 × 10⁻⁴).
An MDMR analysis evaluating for effects of clinical diagnosis did not identify hubs of the reward system such as the NAc (Table S4). Notably, observed dimensional effects with BAS Reward were present within each clinical diagnostic category (Table S5). In controls, most effects were in the same direction but were attenuated in magnitude; exclusion of controls from the sample strengthened all associations. Differences in BAS subfactor scores were present between groups (Table S6), however there were no group differences in network-level summary measures. Inclusion of smoking status or composite medication load did not impact results (Table S7). Network-level associations were directionally similar for other BAS subscales but reduced in magnitude (Table S8). The network associations did not relate to other disorder-specific, disease severity measures (Table S9).
DISCUSSION
We used a fully data-driven survey of the functional connectome to identify regions where the multivariate pattern of brain connectivity was dimensionally related to reward responsivity across a large, heterogeneous population of adults with psychiatric disorders. This approach identified multivariate patterns of connectivity centered on regions within the DMN, CON and the NAc. Network-based analyses revealed that reward deficits were associated with hyper-connectivity within the DMN and diminished connectivity between DMN and CON regions. Furthermore, NAc connectivity was de-coupled from DMN regions and showed increased connectivity with CON regions. Taken together, these findings delineate a common pattern of large-scale network dysconnectivity associated with reward deficits across clinical diagnostic categories.
MDMR allows full exploration of the connectome in relation to reward responsivity
To date, the majority of studies examining reward-related functional connectivity abnormalities in psychiatric disorders have utilized a priori defined seed-based approaches (14). In contrast, we used MDMR to conduct a data-driven analysis of the entire functional connectome in relation to reward responsiveness. MDMR has the advantage of simultaneously assessing associations between reward responsiveness and each connection within the functional connectome, while controlling for the effects of potential confounds. MDMR thus eliminates the need for users to select specific brain regions of interest, minimizing bias in the experimental design. Remarkably, this exploratory multivariate analysis identified abnormalities in the nucleus accumbens, a region critical for reward processing (5). Single-disorder case-control studies have consistently implicated the NAc in reward-related pathophysiology in mood and psychotic disorders (7). Furthermore, abnormalities involving the NAc have specifically been linked with symptoms of anhedonia (15). However, whether circuit-level abnormalities involving the NAc can be identified across these disorders has not previously been evaluated. As discussed below, dimensional deficits of reward responsivity are associated with connectivity abnormalities between the NAc and major functional networks.
Hyper-connectivity within a DMN subsystem scales with reward impairments
The DMN is comprised of brain regions which are important for internally-directed modes of cognition, including memory, prospection, theory of mind, and reward valuation. Abnormally enhanced connectivity within the DMN has been reported in multiple psychiatric conditions where anhedonia is prominent (29,30). In our heterogeneous sample, MDMR identified DMN regions including the temporoparietal junction and lateral temporal cortex. Follow-up seed-based connectivity analyses identified additional DMN regions including the posterior cingulate cortex and anterior medial prefrontal cortex. These regions map to a functionally-specific DMN subsystem (dorsomedial prefrontal subsystem) linked to present-state, self-referential and affective cognition (31). Notably, regions belonging to another DMN subsystem – the medial temporal lobe system, which is preferentially active during memory rather than affective processing - were not identified by MDMR (31). Hyper-connectivity within the dorsomedial prefrontal DMN subsystem scaled with impairments in reward responsivity. Additionally, there was diminished connectivity between this DMN subsystem and the CON, a cognitive-control network involved in detecting salient external stimuli (32). These findings were present in each clinical group, highlighting the relevance of these abnormalities across diagnostic categories. Though speculative, DMN hyper-connectivity and diminished DMN connectivity with the CON may represent a deficit in network integration necessary for reward responsiveness. Symptoms of anhedonia may also be associated with increased rumination and ineffective transitioning from internal to external modes of cognition (29).
Reduced connectivity between NAc and a DMN subsystem is associated with reward deficits
Corticostriatal abnormalities involving the NAc have been reported in diverse psychiatric disorders. In our study, reward deficits were related to dissociable patterns of NAc dysconnectivity, including decreased connectivity between the NAc and DMN and increased connectivity between NAc and CON. Together, these findings implicate a pattern of dysconnectivity between the NAc and major functional networks where dysconnectivity has commonly been reported in both mood and psychotic disorders (13–15). Of note, these effects were consistent for subjects with MDD, BPD, SCZ, and psychosis risk groups. This raises the interesting possibility that NAc dysconnectivity is associated with reward responsiveness deficits, regardless of the clinical diagnostic category. Diminished integration between the NAc and the DMN may reflect a brain phenotype corresponding to impairments in reward-oriented internal cognition (33). Increased integration seen between the NAc and the CON may relate to elevated cognitive control on reward system activity (34).
Strengths and limitations of examining dimensions in heterogeneous populations
Establishing common patterns of brain dysconnectivity across clinical diagnostic category is a central aim of the NIMH RDoC (3). In the present study, inclusion of a heterogeneous population of adults with diverse psychopathology allowed identification of common dimensional patterns of dysconnectivity related to reward functioning. However, certain limitations of our approach should be noted. First, the cross-sectional analyses here do not allow determination of causation or the temporal pattern of changes. Second, evaluating whole-brain connectivity using MDMR may have decreased sensitivity to localized patterns of dysconnectivity related to reward functioning. While comparisons of different MDMR distance measures have generally yielded similar findings, it remains unclear whether there is an optimal metric depending on the question of interest (16). Third, while this study characterizes anhedonia in terms of diminished self-reported reward responsivity, this may be distinct from other elements of anhedonia, including reward anticipation, effort and satiety (2,35). Fourth, while our findings suggest no significant impact of composite medication load upon neural activity and were similar for psychosis risk groups with few medicated subjects, future studies should confirm these findings in un-medicated populations. Finally, the dimensional analysis of a heterogeneous sample may not identify important disorder-specific brain phenotypes related to reward dysfunction, and results may not extend to other psychiatric disorders with reward dysfunction, such as addiction and ADHD (36).
Consideration of Findings Within the Framework of Traditional Diagnostic Categories
Neuroimaging studies in different psychiatric disorders have previously reported corticostriatal abnormalities involving the reward system (13,14). In our study, dissociable patterns of dysconnectivity among large-scale cortical networks and the NAc were identified across the dimension of reward responsiveness. These neurobiological patterns were found in subjects with both mood and psychotic disorders. This suggests common pathophysiological mechanisms may underlie the development of anhedonia in different psychiatric disorders. However, distinct pathological mechanisms have also been shown to underlie aspects of anhedonia seen in these disorders (37). Consequently, a focus on the etiologic and neurodevelopmental aspects of reward-related dysfunction is needed to clarify common and dissociable mechanisms. This will be important for developing interventions that target shared and unique processes underlying anhedonia in these disorders.
Conclusions
In summary, the present data corroborates prior research using case-control designs, and emphasizes that corticostriatal dysconnectivity is implicated in reward-related abnormalities across clinical diagnostic categories and those at risk for these disorders. Specifically, common abnormalities among large-scale cortical networks and the NAc may underlie reward deficits. These results suggest that development of interventions to treat anhedonia in different psychiatric disorders may effectively target shared neural abnormalities in critical functional networks. Future research employing longitudinal designs may allow for evaluation of early interventions that promote resilience against shared reward-related psychopathology prior to the development of disabling symptoms.
Supplementary Material
Acknowledgments
Support by grants K23MH098130 and R01MH107703 to Dr. Satterthwaite, R01MH101111 and K23MH085096 to Dr. Wolf and T32MH19112-25 to Dr. Sharma. Additional support provided by R01NS085211 to Dr. Shinohara, T32MH065218-11 to Mr. Vandekar and R21MH106799 to Drs. Bassett and Satterthwaite. Dr. Bassett further acknowledges support from the John D. and Catherine T. MacArthur Foundation, the Alfred P. Sloan Foundation, and the National Institute of Child Health and Human Development (1R01HD086888-01).
Footnotes
Previous Presentation: Presented at the 2016 annual meeting of the Society of Biological Psychiatry. Atlanta, Georgia. May 12-15, 2016.
Location of work and address for reprints: From the Departments of Psychiatry, Psychology, Biostatistics and Epidemiology, Radiology, Bioengineering; Perelman School of Medicine, University of Pennsylvania, Philadelphia, PA.
Disclosures: Dr. Shinohara has received consulting fees from Hoffman-La Roche. All others report no financial relationships with commercial interests.
References
- 1.Forte A, Baldessarini RJ, Tondo L, Vázquez GH, Pompili M, Girardi P. Long-term morbidity in bipolar-i, bipolar-ii, and unipolar major depressive disorders. Journal of Affective Disorders. 2015;178:71–78. doi: 10.1016/j.jad.2015.02.011. [DOI] [PubMed] [Google Scholar]
- 2.Wolf DH. Anhedonia in schizophrenia. Current psychiatry reports. 2006;8:322–328. doi: 10.1007/s11920-006-0069-0. [DOI] [PubMed] [Google Scholar]
- 3.Insel T, Cuthbert B, Garvey M, Heinssen R, Pine DS, et al. Research domain criteria (rdoc): Toward a new classification framework for research on mental disorders. The American Journal of Psychiatry. 2010;167:748–751. doi: 10.1176/appi.ajp.2010.09091379. [DOI] [PubMed] [Google Scholar]
- 4.Bartra O, McGuire JT, Kable JW. The valuation system: A coordinate-based meta-analysis of BOLD fmri experiments examining neural correlates of subjective value. NeuroImage. 2013;76:412–427. doi: 10.1016/j.neuroimage.2013.02.063. [DOI] [PMC free article] [PubMed] [Google Scholar]
- 5.Pizzagalli DA, Holmes AJ, Dillon DG, Goetz EL, Birk JL, Bogdan R, et al. Reduced caudate and nucleus accumbens response to rewards in unmedicated individuals with major depressive disorder. The American Journal of Psychiatry. 2009;166:702–710. doi: 10.1176/appi.ajp.2008.08081201. [DOI] [PMC free article] [PubMed] [Google Scholar]
- 6.Satterthwaite TD, Kable JW, Vandekar L, Katchmar N, Bassett DS, Baldassano CF, et al. Common and dissociable dysfunction of the reward system in bipolar and unipolar depression. Neuropsychopharmacology. 2015;40:2258–2268. doi: 10.1038/npp.2015.75. [DOI] [PMC free article] [PubMed] [Google Scholar]
- 7.Wolf DH, Satterthwaite TD, Kantrowitz JJ, Katchmar N, Vandekar L, et al. Amotivation in schizophrenia: Integrated assessment with behavioral, clinical, and imaging measures. Schizophrenia Bulletin. 2014;40:1328–1337. doi: 10.1093/schbul/sbu026. [DOI] [PMC free article] [PubMed] [Google Scholar]
- 8.Grimm O, Heinz A, Walter H, Kirsch P, Erk S, et al. Striatal response to reward anticipation: Evidence for a systems-level intermediate phenotype for schizophrenia. JAMA Psychiatry. 2014;71:531–539. doi: 10.1001/jamapsychiatry.2014.9. [DOI] [PubMed] [Google Scholar]
- 9.Arrondo G, Segarra N, Metastasio A, Ziauddeen H, Spencer J, et al. Reduction in ventral striatal activity when anticipating a reward in depression and schizophrenia: A replicated cross-diagnostic finding. Front Psychol. 2015;6:1280. doi: 10.3389/fpsyg.2015.01280. [DOI] [PMC free article] [PubMed] [Google Scholar]
- 10.Hägele C, Schlagenhauf F, Rapp M, Sterzer P, Beck A, et al. Dimensional psychiatry: Reward dysfunction and depressive mood across psychiatric disorders. Psychopharmacology. 2015;232:331–341. doi: 10.1007/s00213-014-3662-7. [DOI] [PMC free article] [PubMed] [Google Scholar]
- 11.Hershenberg R, Satterthwaite TD, Daldal A, Katchmar N, Moore TM, et al. Diminished effort on a progressive ratio task in both unipolar and bipolar depression. Journal of Affective Disorders. 2016;196:97–100. doi: 10.1016/j.jad.2016.02.003. [DOI] [PMC free article] [PubMed] [Google Scholar]
- 12.Vargas C, López-Jaramillo C, Vieta E. A systematic literature review of resting state network-functional MRI in bipolar disorder. Journal of Affective Disorders. 2013;150:727–735. doi: 10.1016/j.jad.2013.05.083. [DOI] [PubMed] [Google Scholar]
- 13.Whitfield-Gabrieli S, Thermenos HW, Milanovic S, Tsuang MT, Faraone S, et al. Hyperactivity and hyperconnectivity of the default network in schizophrenia and in first-degree relatives of persons with schizophrenia. Proceedings of the National Academy of Sciences. 2009;106:1279–1284. doi: 10.1073/pnas.0809141106. [DOI] [PMC free article] [PubMed] [Google Scholar]
- 14.Phillips ML, Swartz HA. A critical appraisal of neuroimaging studies of bipolar disorder: Toward a new conceptualization of underlying neural circuitry and a road map for future research. The American Journal of Psychiatry. 2014;171:829–843. doi: 10.1176/appi.ajp.2014.13081008. [DOI] [PMC free article] [PubMed] [Google Scholar]
- 15.Wang Y, Liu WH, Li Z, Wei XH, Jiang XQ, et al. Altered corticostriatal functional connectivity in individuals with high social anhedonia. Psychological Medicine. 2016;46:125–135. doi: 10.1017/S0033291715001592. [DOI] [PubMed] [Google Scholar]
- 16.Shehzad Z, Kelly C, Reiss PT, Cameron Craddock R, Emerson J, et al. A multivariate distance-based analytic framework for connectome-wide association studies. NeuroImage. 2014;93:74–94. doi: 10.1016/j.neuroimage.2014.02.024. [DOI] [PMC free article] [PubMed] [Google Scholar]
- 17.NIMH Positive Valence Systems: Workshop Proceedings [Internet] 2016 Nimh.nih.gov. [cited 22 June 2016]. Available from: http://www.nimh.nih.gov/research-priorities/rdoc/positive-valence-systems-workshop-proceedings.shtml.
- 18.Carver CS, White TL. Behavioral inhibition, behavioral activation, and affective responses to impending reward and punishment: The BIS/BAS scales. Journal of Personality and Social Psychology. 1994;67:319. [Google Scholar]
- 19.Gard DE, Kring AM, Gard MG, Horan WP, Green MF. Anhedonia in schizophrenia: distinctions between anticipatory and consummatory pleasure. Schizophrenia research. 2007;93:253–260. doi: 10.1016/j.schres.2007.03.008. [DOI] [PMC free article] [PubMed] [Google Scholar]
- 20.Satterthwaite TD, Elliott MA, Gerraty RT, Ruparel K, Loughead J, et al. An improved framework for confound regression and filtering for control of motion artifact in the preprocessing of resting-state functional connectivity data. NeuroImage. 2013;64:240–256. doi: 10.1016/j.neuroimage.2012.08.052. [DOI] [PMC free article] [PubMed] [Google Scholar]
- 21.Satterthwaite TD, Wolf DH, Loughead J, Ruparel K, Elliott MA, et al. Impact of in-scanner head motion on multiple measures of functional connectivity: relevance for studies of neurodevelopment in youth. Neuroimage. 2012;60:623–32. doi: 10.1016/j.neuroimage.2011.12.063. [DOI] [PMC free article] [PubMed] [Google Scholar]
- 22.Cox RW. AFNI: Software for analysis and visualization of functional magnetic resonance neuroimages. Computers and Biomedical Research, An International Journal. 1996;29:162–173. doi: 10.1006/cbmr.1996.0014. [DOI] [PubMed] [Google Scholar]
- 23.Van Essen DC, Drury HA, Dickson J, Harwell J, Hanlon D, et al. An integrated software suite for surface-based analyses of cerebral cortex. Journal of the American Medical Informatics Association. 2001;8:443–459. doi: 10.1136/jamia.2001.0080443. [DOI] [PMC free article] [PubMed] [Google Scholar]
- 24.Satterthwaite TD, Cook PA, Bruce SE, Conway C, Mikkelsen E, et al. Dimensional depression severity in women with major depression and post-traumatic stress disorder correlates with fronto-amygdalar hypoconnectivity. Molecular psychiatry. 2015;7:894–902. doi: 10.1038/mp.2015.149. [DOI] [PMC free article] [PubMed] [Google Scholar]
- 25.Satterthwaite TD, Vandekar SN, Wolf DH, Bassett DS, Ruparel K, et al. Connectome-wide network analysis of youth with Psychosis-Spectrum symptoms. Molecular psychiatry. 2015;12:1508–1515. doi: 10.1038/mp.2015.66. [DOI] [PMC free article] [PubMed] [Google Scholar]
- 26.Gordon EM, Laumann TO, Adeyemo B, Huckins JF, Kelley WM, et al. Generation and evaluation of a cortical area parcellation from resting-state correlations. Cerebral cortex. 2014:bhu239. doi: 10.1093/cercor/bhu239. [DOI] [PMC free article] [PubMed] [Google Scholar]
- 27.Gu S, Satterthwaite TD, Medaglia JD, Yang M, Gur RE, et al. Emergence of system roles in normative neurodevelopment. Proceedings of the National Academy of Sciences. 2015;112:13681–13686. doi: 10.1073/pnas.1502829112. [DOI] [PMC free article] [PubMed] [Google Scholar]
- 28.Hassel S, Almeida JR, Kerr N, Nau S, Ladouceur CD, et al. Elevated striatal and decreased dorsolateral prefrontal cortical activity in response to emotional stimuli in euthymic bipolar disorder: no associations with psychotropic medication load. Bipolar disorders. 2008;10:916–927. doi: 10.1111/j.1399-5618.2008.00641.x. [DOI] [PMC free article] [PubMed] [Google Scholar]
- 29.Hamilton JP, Furman DJ, Chang C, Thomason ME, Dennis E, et al. Default-mode and task-positive network activity in major depressive disorder: Implications for adaptive and maladaptive rumination. Biological Psychiatry. 2011;70:327–333. doi: 10.1016/j.biopsych.2011.02.003. [DOI] [PMC free article] [PubMed] [Google Scholar]
- 30.Tang J, Liao Y, Song M, Gao JH, Zhou B, et al. Aberrant default mode functional connectivity in early onset schizophrenia. PloS One. 2013;8:e71061. doi: 10.1371/journal.pone.0071061. [DOI] [PMC free article] [PubMed] [Google Scholar]
- 31.Andrews-Hanna JR, Reidler JS, Sepulcre J, Poulin R, Buckner RL. Functional-Anatomic fractionation of the brain’s default network. Neuron. 2010;65:550–562. doi: 10.1016/j.neuron.2010.02.005. [DOI] [PMC free article] [PubMed] [Google Scholar]
- 32.Orliac F, Naveau M, Joliot M, Delcroix N, Razafimandimby A, et al. Links among resting-state default-mode network, salience network, and symptomatology in schizophrenia. Schizophrenia Research. 2013;148:74–80. doi: 10.1016/j.schres.2013.05.007. [DOI] [PubMed] [Google Scholar]
- 33.Rushworth MF, Noonan MP, Boorman ED, Walton ME, Behrens TE. Frontal cortex and reward-guided learning and decision-making. Neuron. 2011;70:1054–69. doi: 10.1016/j.neuron.2011.05.014. [DOI] [PubMed] [Google Scholar]
- 34.Botvinick M, Braver T. Motivation and cognitive control: from behavior to neural mechanism. Annual Review of Psychology. 2015;66:83–113. doi: 10.1146/annurev-psych-010814-015044. [DOI] [PubMed] [Google Scholar]
- 35.Rizvi SJ, Pizzagalli DA, Sproule BA, Kennedy SH. Assessing anhedonia in depression: Potentials and pitfalls. Neuroscience & Biobehavioral Reviews. 2016;65:21–35. doi: 10.1016/j.neubiorev.2016.03.004. [DOI] [PMC free article] [PubMed] [Google Scholar]
- 36.Hong LE, Hodgkinson CA, Yang Y, Sampath H, Ross TJ, et al. A genetically modulated, intrinsic cingulate circuit supports human nicotine addiction. Proceedings of the National Academy of Sciences. 2010;107:13509–13514. doi: 10.1073/pnas.1004745107. [DOI] [PMC free article] [PubMed] [Google Scholar]
- 37.Whitton AE, Treadway MT, Pizzagalli DA. Reward processing dysfunction in major depression, bipolar disorder and schizophrenia. Current opinion in psychiatry. 2015;28:7–12. doi: 10.1097/YCO.0000000000000122. [DOI] [PMC free article] [PubMed] [Google Scholar]
Associated Data
This section collects any data citations, data availability statements, or supplementary materials included in this article.