Abstract
Using MRI for radiotherapy treatment planning and image guidance is appealing as it provides superior soft tissue information over CT scans and avoids possible systematic errors introduced by aligning MR to CT images. This study presents a method that generates Synthetic CT (MRCT) volumes by performing probabilistic tissue classification of voxels from MRI data using a single imaging sequence (T1 Dixon). The intensity overlap between different tissues on MR images, a major challenge for voxel-based MRCT generation methods, is addressed by adding bone shape information to an intensity-based classification scheme. A simple pelvic bone shape model, built from principal component analysis of pelvis shape from 30 CT image volumes, is fitted to the MR volumes. The shape model generates a rough bone mask that excludes air and covers bone along with some surrounding soft tissues. Air regions are identified and masked out from the tissue classification process by intensity thresholding outside the bone mask. A regularization term is added to the fuzzy c-means classification scheme that constrains voxels outside the bone mask from being assigned memberships in the bone class. MRCT image volumes are generated by multiplying the probability of each voxel being represented in each class with assigned attenuation values of the corresponding class and summing the result across all classes. The MRCT images presented intensity distributions similar to CT images with a mean absolute error of 13.7 HU for muscle, 15.9 HU for fat, 49.1 HU for intra-pelvic soft tissues, 129.1 HU for marrow and 274.4 HU for bony tissues across 9 patients. Volumetric modulated arc therapy (VMAT) plans were optimized using MRCT-derived electron densities, and doses were recalculated using corresponding CT-derived density grids. Dose differences to planning target volumes were small with mean/standard deviation of 0.21/0.42 Gy for D0.5cc and 0.29/0.33 Gy for D99%. The results demonstrate the accuracy of the method and its potential in supporting MRI only radiotherapy treatment planning.
Keywords: synthetic CT, radiation therapy, bone shape model, tissue classification, magnetic resonance imaging
1. Introduction
Interest is emerging to use magnetic resonance imaging (MRI) without CT to support radiation dose calculation, attenuation correction of positron emission tomography (PET) in a PET-MRI system and some aspects of image guidance in radiation therapy. Synthetic CT (MRCT) volumes generated from MRI scans help support these roles.
Various techniques have been proposed for MRCT generation. These include atlas based methods, where electron density maps are generated by aligning an atlas derived from reference CT images with target MR images (Lambert et al 2011, Dowling et al 2012, Uh et al 2014, Siversson et al 2015). However, such methods are somewhat limited in their ability to adapt to patient anatomical variations, a problem that is exacerbated in the female pelvis as compared to the male pelvis (Oh et al 2014). Other algorithms apply a relation between the attenuation properties and image intensities of one or more MRI scans to generate MRCT images (Johansson et al 2011, Kim et al 2012, Hsu et al 2013, Juttukonda et al 2015, Zheng et al 2015). The major challenge of such methods is the ambiguity in the correspondence between attenuation properties and image intensities. For example, bony tissues have low signal intensities in MR images due to their short T2/T2* and air has low signal due to extremely low proton density, yet the attenuation properties of bone and air are significantly different. Imaging artifacts, partial volume effects and noise in MRI further complicate the intensity distribution of different tissues, resulting in misclassifications of tissue types, and thus wrong attenuation assignments in MRCT images.
Ultrashort echo time scanning techniques, such as ultrashort echo time (UTE, Robson et al 2006) and pointwise encoding time reduction with radial acquisition (PETRA, Grodzki et al 2012) are able to yield signals from tissues with short T2* and have been used in MRCT generation for the head to improve the separation of bone from air. However, the success of such methods in the pelvis is hindered due to the mobility of air over short time periods as air regions estimated from UTE may not align with the same air pockets in other MR volumes from the same scanning session. This potential spatial mismatch could lead to misclassification of air as bone in the pelvis. Several investigators (Chen et al 2007, Kapanen et al 2013, Korhonen et al 2014, Kim et al 2015) manually contoured the bony part in pelvis before MRCT generation to avoid this issue, a process which can be time-consuming and non-repeatable.
In our previous work (Liu et al 2015), we developed a pelvic bone shape model to assist bone identification in MRI, as the first step towards pelvic MRCT generation. In this study, we first extend the pelvic bone shape model to cover spinal and femoral bones attached to the pelvis. Then we present a complete MRCT generation algorithm that incorporates this shape model for female pelvic radiotherapy patients, and evaluate its efficacy in supporting external beam radiation therapy treatment planning. By jointly analyzing the intensity and shape features, our method is able to generate MRCT images using a single MR imaging pulse sequence, which reduces the scanning time and avoids problems induced by tissue mobility in the pelvis confounding correspondence across successive scans.
2. Methods and materials
2.1. Image acquisition
Under institution review board approval, CT image volumes from 30 female patients who underwent simulation for external beam radiotherapy, as used in the previous work (Liu et al 2015), were selected for constructing a pelvic bone shape model. Of these patients, 17 also had corresponding MR scans acquired under a prospective review board-approved investigation. 7 of the MR scans were excluded from this investigation due to the incomplete coverage of patient volumes in the axial plane. MR scans were acquired using a 3D gradient echo sequence (VIBE Dixon, where VIBE stands for volumetric interpolated breath-hold examination (Rofsky et al 1999)) with echo times (TEs) 2.46 (in-phase)/1.23 (out-of-phase) ms and repetition time (TR) 4.1 ms. This imaging sequence results in multi-contrast MRI datasets that consist of 3 image volumes of interest: T1-weighted (in-phase) image, fat image and water image calculated from in-phase and out-of-phase T1-weighted images. Details of imaging parameters and patient set up, as well as example images of study subjects can be found in our previous work (Liu et al 2015).
We preprocessed MR and CT image volumes using previously described methods (Liu et al 2015). Here we briefly review the preprocessing steps. First we applied intensity inhomogeneity correction to MR images using the N4ITK algorithm (Tustison et al 2010). Then we rigidly aligned MR images to CT images with the aim of aligning bone structures accurately without considering soft tissues, as soft tissues can deform across scanning sessions. All image volumes were reformatted to axial cuts with voxel size interpolated to 1 × 1 × 1 mm3. Finally we normalized the intensity of each MRI dataset with a scale factor that sets the mean intensity of the corresponding T1-weighted image volume to 1000.
2.2. Shape model construction for bone identification
To separate bone from air without using ultra-short TE imaging, we used the fact that bones have a somewhat predictable shape and built a bone shape model to facilitate bone identification. We extended our recently published pelvic bone shape model (Liu et al 2015) to cover the spinal processes superior to the pelvis as well as to include a femur model based on connected component analysis. Figure 1 labels various bony structures that are of interest in this study. Figure 2 shows the flow chart for applying the bone shape model for bone identification and figure 3 shows the corresponding example image of each step. First a rough mask (referred as the ‘threshold mask’) was generated by intensity thresholding, as described in section 2.2.1. The pelvic bone shape model was next applied to separate pelvic bone and lumbar spine from other voxels that fall below the threshold, as described in section 2.2.2. Finally, in section 2.2.3 we incorporated a femur identification model to separate different tissues in the thighs. Each of these steps is detailed next.
Figure 1.
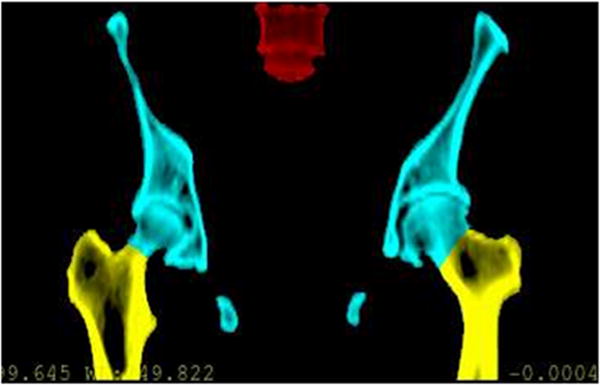
Bony structures of interest for female pelvic radiotherapy. The previous pelvic bone (cyan) model was extended to cover femoral bones (yellow) and vertebrae (red) in this work.
Figure 2.

Overall scheme of separating bone, air and soft tissue.
Figure 3.
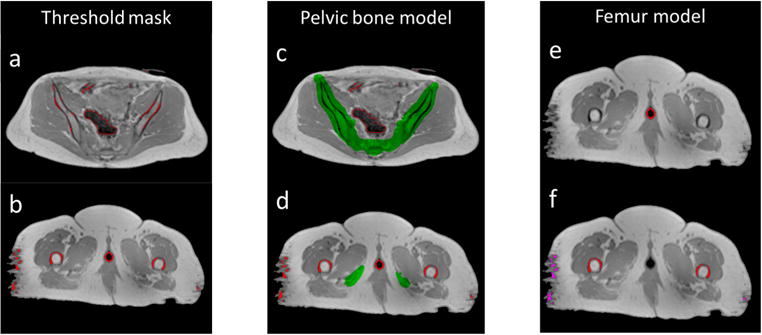
Example of applying the bone separation scheme on MRI data. (left) Mask generated by thresholding (red contours) consists of a mixture of air and bone in the pelvis (a) as well as a mixture of bone, vaginal marker and soft tissue in the thighs (b). (middle) Pelvic bone mask generated by the pelvic bone shape model (green) separates bone from air in the pelvis (c) but fails to cover femoral bones in the thighs (d). (right) Applying the femur model separates vaginal markers (red contours in (e)), femoral bones (red contours in (f)) and soft tissue (magenta contours in (f)).
2.2.1. Generate the initial mask by thresholding
First, we applied intensity thresholds to the multi-contrast MRI data. Experimentally determined thresholds of 300, 300 and 150 were applied to normalized T1-weighted, fat and water images respectively. The intersection of masks from the three image volumes yielded a ‘threshold mask’ (figures 3(a) and (b)). Both bone and air voxels were selected by this thresholding process as they both appear dark on MRI images, as shown in figure 3(a). In addition, some soft tissue voxels in the thighs were also found to fall below the threshold due to imaging artifacts (e.g. image noise, peripheral signal loss), as shown in figure 3(b). A vaginal marker used on some patients for clinical care was also selected by this thresholding process due to low image intensity.
2.2.2. Apply pelvic bone model to the ‘threshold mask’
Next, a pelvic bone shape model was constructed from the CT scans of the 30 subjects, using our previously published algorithm (Liu et al 2015). The algorithm was primarily developed for localizing pelvic bone without considering attached lumbar vertebrae and femurs. To generate MRCT data suitable for treatment planning, we need also to classify such non-pelvic bones correctly. It is possible to build a separate shape model for those anatomical structures. However, experiments demonstrated that deforming the reference image with lumbar vertebrae maintained (figure 4(a)) with the same parameters as in the previously published work, plus the suggested 5 mm dilation (Liu et al 2015), were sufficient to cover the lower lumbar vertebrae in MR images with reasonable specificity (figure 4(b)). Figure 3(c) shows an example of applying the bone mask to separate bone from air in the pelvis.
Figure 4.

Mask (contoured in red) generated by deforming the atlas image with lower lumbar vertebrae maintained (a) overlapped with a target image (b). The coverage of the lumbar spine by the atlas image is limited cranially to roughly the upper third of the L4 vertebral level (a).
2.2.3. Identification of femoral bones
While applying the bone shape model covered the majority of pelvic bone and lower lumbar spine voxels, a significant volume of femoral voxels in the scanned volumes remained uncovered (referred as the ‘residual mask’) and would be mislabeled as air voxels, as shown in figure 3(d). Extension of the shape model to cover femurs was not considered practicable as the position variations of femurs are large across patients. To address this, we extended the model based on the fact that air does not exist in the thighs. Landmark points were placed on each of the femoral heads in the atlas CT image, as shown in figure 5 with positions tracked during the deformation process. Image volumes inferior to the deformed landmarks were considered as candidate space that contains potential femoral bones.
Figure 5.
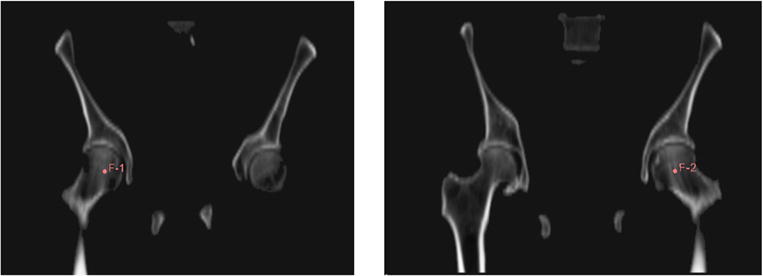
Landmark points (F-1 and F-2) placed on the femoral heads in the atlas CT image.
As air does not exist in the thighs, a search was done across the candidate space of the ‘residual mask’, where voxels outside the pelvis were excluded from being identified as air. A voxel was defined as inside the pelvis if there were both voxels on its left and right that belonged to the pelvic bone mask and were in the same axial slice. Figure 3(e) shows an example of such voxels that are inside the pelvis. The remaining voxels in the ‘residual mask’ are a mixture of femur bone voxels and soft tissue voxels with low intensities. As soft tissue voxels in the ‘residual mask’ appear as scattered noise while femur bone voxels have a regular pattern, we separated femur bones from soft tissues by performing 3D connected component analysis on voxels in the ‘residual mask’ and identified the left/right femurs as the 2 largest connected components, as shown by red contours in figure 3(f). The remaining small connected components were treated as soft tissue voxels, as shown by magenta contours in figure 3(f).
2.3. Fuzzy c-means classification with a shape prior
In a previous investigation (Hsu et al 2013), probabilistic tissue classification was performed on multi-contrast MR images to generate MRCT volumes of the head. Given an image dataset from d MRI volumes of the same object, each containing N voxels, as well as the total number of tissue classes presented c, standard fuzzy c-means classification with a spatial constraint was performed to get the probabilistic membership uik of the kth voxel belonging to the ith tissue class, whose intensity centroid on the sth MR image is denoted by vis
| (1) |
where m is the fuzzy degree that takes the partial volume effect into consideration. The first term is a simple fuzzy c-means clustering. The second term is a spatial constraint to improve connectivity and suppress noise, where denotes the median of the neighbors within a kernel and α controls the weight for the spatial constraint.
The intensity distributions of pelvic MRI data however, present challenges for this classification scheme. Firstly, volumes of different tissue types are highly unbalanced in the pelvis. For example, the volume of fat far exceeds that of pelvic bone. Standard fuzzy c-means will favor large clusters over small clusters (Noordam et al 2002). The estimation of the bone class will be negatively affected by the soft tissue class, resulting in inaccurate bone classification. Secondly, the limited spatial resolution and large field of view lead to significant partial volume effects that cause the intensity distributions at the interface between fat and other soft tissues to be different from soft tissues, and overlapped significantly with bone marrow. Figure 6 shows example ROIs of fat interface and bone marrow as well as their intensity histograms (normalized to have the same peak). The intensities of the fat interface and bone marrow appear to be non-separable. Therefore, intensity information alone will not suffice to accurately classify different tissue types from pelvic MRI data, and standard fuzzy c-means classification needs to be modified to incorporate shape information.
Figure 6.
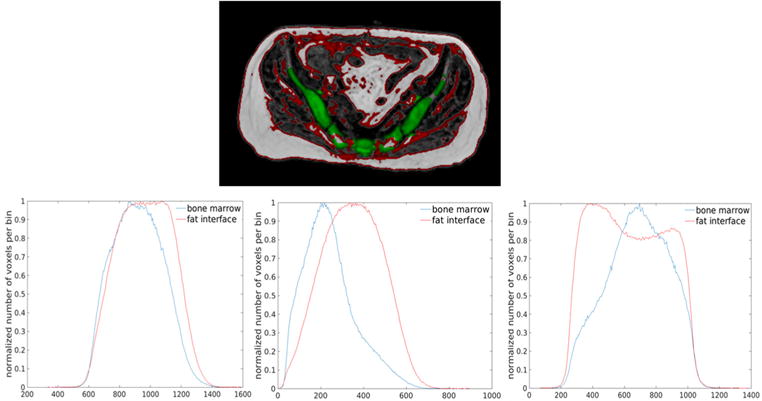
Intensity overlap between fat and soft tissues interface and bone marrow. (top) Example ROIs of interfaces between fat and other soft tissues (red) and bone marrow (green) on a fat image. (bottom) Normalized intensity histograms of fat interfaces (red) and bone marrow (blue) on T1-weighted (right), water (middle) and fat (left) images from an example patient.
We added shape information to the standard fuzzy c-means classification formula by introducing a regularization term based on the pelvic bone shape model we constructed. As our bone shape model covers the majority of bone voxels (Liu et al 2015), we discouraged voxels outside the bone mask generated by the model from being classified as bone. Mathematically, assuming the bone class is the lth class, we regularized the classification on bony tissue ulk k = 1, …, N with the binary bone mask b as
| (2) |
where bk = 0 indicates voxel k is not covered by the bone mask and we modified the fuzzy c-means classification with the regularization term as
| (3) |
where λ controls the impact of the regularization term on the entire classification process. Basically, the regularization term penalizes voxels to have membership in the bone class (ulk > 0) outside the bone mask (bk = 0). Since our bone mask covers a major portion of bony tissues, we set λ = +∞. In this way, we enforced a hard constraint on the classification scheme where any voxel outside the bone mask will have zero probability of belonging to the bone class, which will also prevent the estimation of the intensity centroid of bone class from being affected by non-bone voxels.
To solve for (3), we first initialized a rough estimation of intensity centroids of each class vis. The corresponding optimal estimation of uik, without the regularization term, is given by
| (4) |
With the hard constraint on the bone class, the bony membership ulk is adjusted by
| (5) |
to make sure u is a valid probability distribution, we need Here we do not assume any prior knowledge on other tissue classes and distribute the residual probability evenly to all remaining tissue classes
| (6) |
after calculating , we updated the centroid of each tissue class by
| (7) |
We performed the above calculations (4) through (7) iteratively until a convergence criteria was met. In our implementation, we terminated iterations when the decrease of the objective function (3) value was below a threshold. Roughly 200 iterations were needed for convergence across patients.
2.4. MRCT generation
We generated MRCT image volumes for 9 of the 10 patients who had MRI scans (except for the one whose CT-extracted data was used as the reference image for bone model construction). First, the skin surface was extracted by thresholding the normalized T1-weighted images at 300. This surface was then cleaned up using morphologic operations (3 mm dilation, filling holes and 3 mm erosion). Next, air masks and bone masks were generated using the thresholding scheme together with the shape model and the identified air voxels were excluded from tissue classification. Next, the fuzzy c-means classification with a shape prior was performed on the multi-contrast MRI data. Optimization was performed over 5 classes including compact bone, fat, muscle and the combination of fat interfaces and bone marrow (which were assigned two classes during optimization). Bone marrow and fat interfaces were separated retrospectively after the fuzzy c-means classification using the shape model, where voxels presenting bone marrow/fat interfaces were treated as bone marrow if inside the bone mask and fat interfaces otherwise. The fuzzy degree m was 1.5 and the weight for the spatial constraint term α was 3.8, the same as used previously in the head (Hsu et al 2013). After the fuzzy c-means classification, MRCT volumes were generated by assigning each tissue class a CT number, multiplying the probability of each voxel belonging to each tissue class (uik) with the assigned CT number of that class and summing over all classes. To decide CT numbers of each tissue class, we drew ROIs that contained primarily the corresponding tissue on the reference atlas CT image. Rounding the mean intensity of each ROI to the nearest ten yielded the CT number of the class. The CT numbers assigned to fat, muscle, bone marrow and bone were −100 HU, 30 HU, 150 HU and 800 HU respectively. Fat interfaces were assigned the same CT number as fat. The CT number assigned to the identified air regions was −1000 HU.
2.5. MRCT evaluation
To evaluate the usefulness of the MRCT volumes for treatment planning, both their intensity correlations with corresponding CT image volumes as well as accuracy for supporting treatment planning dose calculations were evaluated. The mean absolute error (MAE) in intensity between MRCT and CT images was calculated on various ROIs drawn at different locations of the pelvis. ROIs encompassing solid bone and marrow were generated from CT images by first thresholding the images at 150 HU, followed by morphologic operations (3 mm dilation, filling holes and 3 mm erosion). Bone voxels were defined as voxels within the ROIs whose intensities were above 250 HU and marrow voxels were defined as those below 250 HU. Before evaluating MAEs for soft tissues, deformable registration was performed using commercial software (Velocity) to align the MRCT with CT images, to attempt to resolve the natural variations in patient position and internal anatomic configuration between CT and MR imaging sessions. ROIs for soft tissues (muscle, external fat and intra-pelvic soft tissues) were then manually drawn on regions where the overlap between MRCT and CT image volumes was reasonably sufficient through visual evaluation. Figure 7 shows example ROIs.
Figure 7.
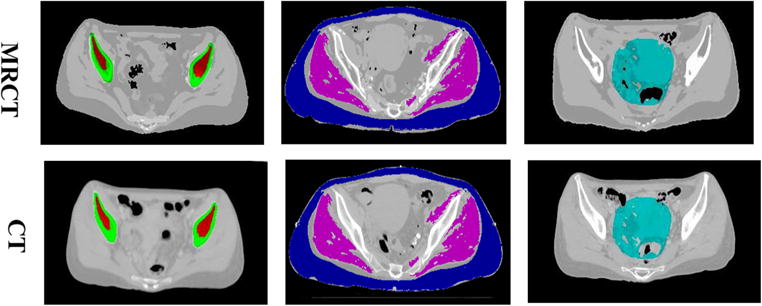
Example ROIs on MRCT (top) and CT (bottom) images. (left) ROIs for solid bone (green) and bone marrow (red). (middle) ROIs for muscle (magenta) and external fat (blue). (right) ROIs for intra-pelvic soft tissues (cyan).
Both the deformably aligned MRCT and their corresponding CT image volumes were imported into a commercial treatment planning system (Eclipse 11.0, Varian, Palo Alto CA). Each patient’s clinically defined structures from their actual treatment plans were used for treatment planning. Volumetric modulated arc therapy (VMAT) plans were then optimized using density grids derived from each MRCT image set. Similar to previous investigations (Paradis et al 2015), beam fluences from each of the MRCT-optimized plans were transferred to the associated CT-derived density grids, and the dose subsequently recalculated. These transposed MRCT (tMRCT) dose distributions were used to more directly evaluate the impact of density grid selection on dose calculation. For each patient, calculated dose and volume metrics were compared between MRCT optimizations and tMRCT calculations for planning target volumes (PTVs) and comparable structures including bowel, pelvis, rectum, sacrum and femur.
3. Results
3.1. Tissue classification with a shape prior
Figure 8 compares probability maps of voxels belonging to the bone class from fuzzy c-means without and with a shape prior, overlapped with the corresponding T1-weighted image. Without the bone mask, not only were air voxels classified as bone, certain soft tissue voxels were also assigned bone memberships, which would have caused large errors in MRCT images generated.
Figure 8.

Comparison of classification results of bones (a) without and (b) with a shape prior. Probability maps of voxels belonging to the bone class (colorwash) are overlaid in their corresponding T1-weighted image.
3.2. MRCT generation and accuracy evaluation
Figure 9 shows example MRCT images and their corresponding CT images. MRCT image volumes present contrast similar with CT image volumes with the exception of the superior region of the lumbar spine, which was classified as soft tissue. This is due to the limited coverage of the atlas image, as has been discussed in section 2.2.2. Table 1 summarizes the statistics of MAE of the 9 patients. The average/standard deviation of MAE across 9 patients was 13.7/1.8 HU for muscle, 15.9/2.8 HU for fat, 49.1/17.8 HU for intra-pelvic soft tissues, 129.1/29.2 HU for marrow and 274.4/26.9 HU for bones.
Figure 9.
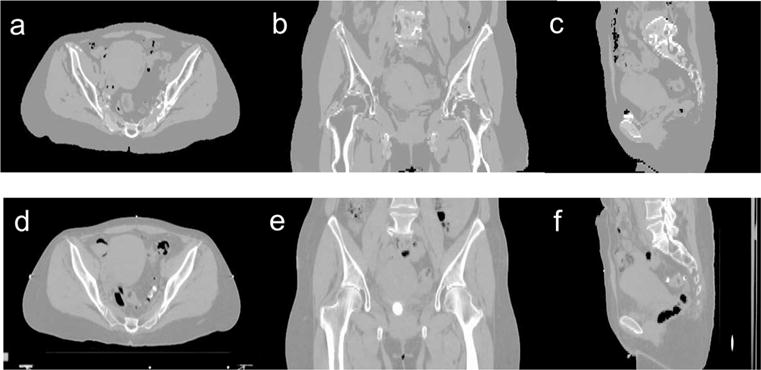
Axial (a), coronal (b) and sagittal (c) images of a MRCT image volume and corresponding cuts through the same patient’s CT image volume (d)–(f).
Table 1.
Mean absolute HU difference between MRCT and CT images across patients.
| Mean | Standard deviation | Range | |
|---|---|---|---|
| Muscle | 13.7 | 1.8 | 9.8–17.4 |
| External fat | 15.9 | 2.8 | 12.0–19.8 |
| Intra-pelvic soft tissue | 49.1 | 17.8 | 25.5–75.3 |
| Bone marrow | 129.1 | 29.2 | 92.8–170.0 |
| Solid bone | 274.4 | 26.9 | 226.4–314.3 |
Table 2 presents the mean and standard deviation of differences between treatment planning objectives evaluated using doses calculated on MRCT and tMRCT plans across all patients. Figure 10 shows statistics of dose differences of PTVs and organs at risk (OARs) across patients. Both absolute and relative dose differences between MRCT and tMRCT calculations are small compared to the prescribed doses (45–58.25 Gy), with a maximal mean difference smaller than 0.3 Gy/0.5%. Figure 11 shows statistics of volume differences of OARs for clinically relevant dose values. The volume differences are small for all OARs with a noted exception of the rectum (V45Gy), where the mean volume difference is 2.5%. From the box plot in figure 11, there are outliers in the comparison of rectum V45Gy. Two patients were found to have much larger volume differences than others (9.3% and 3.9% respectively). After excluding these two patients, the mean differences/variances drop from to 2.5/3.3% to 0.4/0.2%. The large difference is mostly due to the mobility of air in the rectum between MR and CT scans of these two patients which could not be fully resolved using deformable alignment, as shown in figure 12. The CT image volumes show larger air pockets in the rectum while little air presents in the MR image volumes. The dose volume histograms however are very similar between MRCT and tMRCT for both outlier patients, as shown in figure 13. Volume differences of rectum at other dose levels (V20Gy, V35Gy and V50Gy) are marginal (less than 0.6%) for these two outlier patients.
Table 2.
Mean and standard deviation of differences between extracted dose metrics.
| Dose to location | tMRCT versus MRCT mean differences | tMRCT versus MRCT standard deviation of differences |
|---|---|---|
| PTV | ||
| D0.5cc (Gy) | 0.21 | 0.42 |
| D0.5cc (% of prescribed dose) | 0.4 | 0.8 |
| D99% (Gy) | 0.29 | 0.33 |
| D99% (% of prescribed dose) | 0.5 | 0.6 |
|
| ||
| Femur | ||
| V30 Gy(%) | 0.4 | 0.4 |
|
| ||
| Pelvis | ||
| Mean dose (Gy) | 0.10 | 0.10 |
| Mean dose (% of prescribed dose) | 0.2 | 0.2 |
| V10 Gy (%) | 0.0 | 0.1 |
| V20 Gy (%) | 0.1 | 0.1 |
|
| ||
| Rectum | ||
| Mean dose (Gy) | −0.03 | 0.15 |
| Mean dose (% of prescribed dose) | −0.1 | 0.3 |
| V45 Gy (%) | 2.5 (0.4 with outliers removed) | 3.3 (0.2 with outliers removed) |
|
| ||
| Sacrum | ||
| V10 Gy (%) | −0.2 | 0.3 |
| V20 Gy (%) | 0.0 | 0.1 |
|
| ||
| Bowel | ||
| D1cc (Gy) | 0.18 | 0.40 |
| D1cc (% of prescribed dose) | 0.3 | 0.7 |
| D5cc (Gy) | 0.18 | 0.35 |
| D5cc (% of prescribed dose) | 0.3 | 0.6 |
| V55Gy (cc) | 0.22 | 0.64 |
Figure 10.

Box plot of absolute (left) and relative (right) dose differences of PTV and OARs. Red line indicates the median. Bars indicate the maximum and minimum.
Figure 11.
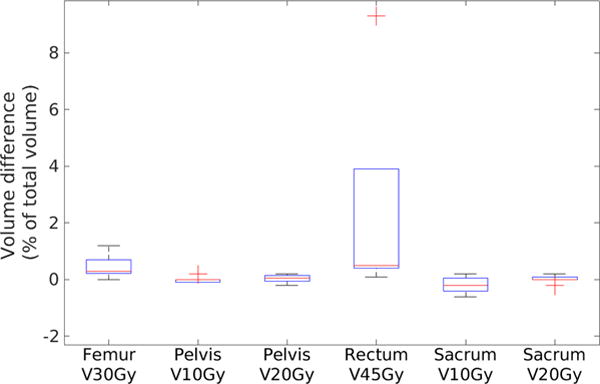
Box plot of volume difference of OARs. Red line indicates the median. Bars indicate the maximum and minimum and red crosses indicate outliers. (Data points are defined as outliers if they are greater than q3 + 1.5 × (q3 − q1) or less than q3 − 1.5 × (q3 − q1), q3 and q1 are the 75th and 25th percentiles of the sample data, respectively.)
Figure 12.
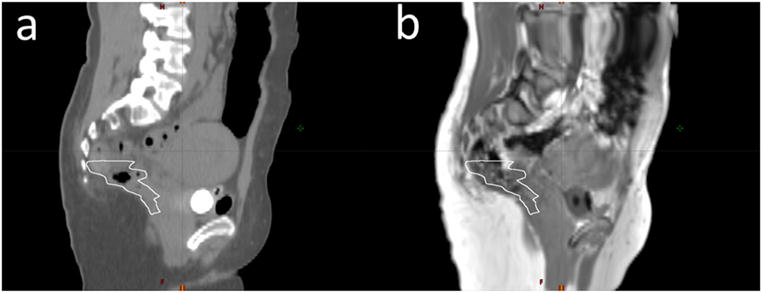
Mobility of air in the rectum (white contours) between CT scans and MR scans. (a) The CT image shows a larger air pocket in the rectum as compared to (b) the MR image (T1-weighted image after applying the deformable transformation that aligned the MRCT image to the CT image).
Figure 13.

Dose volume histograms of rectum show similar results between MRCT and tMRCT plans for the two patients with larger rectum V45Gy variations.
4. Discussion
This study investigated an algorithm for pelvic MRCT generation using joint shape and intensity features to differentiate and classify tissues in MR images. The shape patterns of pelvic bones were combined with a femoral bone extraction method to assist the separation of bone from other tissues. A regularization term was formulated using the bone shape model and added to an intensity-based fuzzy classification scheme. Regularized classification was found to reduce the misclassification of non-bone tissues effectively. The resulting MRCT images presented contrast sufficiently close to CT images to support treatment planning in radiotherapy, as validated by both direct intensity comparison and by performing treatment planning using MRCT image volumes and comparing the dose distributions on MRCT image volumes and CT image volumes.
The presented method differs from previous studies (Lambert et al 2011, Dowling et al 2012, Uh et al 2014, Siversson et al 2015) in that it classifies each patient’s data individually and assigns each voxel attenuation values based on the probability membership of the voxel belonging to a specific tissue class, rather than relying on a fixed intensity atlas. By introducing a bone shape model to the intensity-based classification scheme, our method is able to classify tissues accurately without manual contouring of bones (Chen et al 2007, Kapanen et al 2013, Korhonen et al 2014, Kim et al 2015). The MRCT images were generated from MRI data using a single imaging pulse sequence without ultra-short TE imaging (Johansson et al 2011, Kim et al 2012, Hsu et al 2013), thus the total scan time is much shorter and the problem of patient motion, which is more significant in the pelvis than in the head, is largely avoided. Compared to Bayesian approaches based on deformable alignment between MR images (Gudur et al 2014) and exact bone segmentation through deformable registration (Paulus et al 2015), our method incorporates the shape information by simply defining a binary space that covers bone and excludes air, which can be found by a binary search algorithm (Liu et al 2015), and thus is simpler and more efficient for clinical implementation.
Both image intensity, as well as calculated dose comparisons between MRCT and CT image volumes, show acceptably small variations. Although the MAE values for bone and marrow appear somewhat large, the dose calculation studies demonstrated that these differences did not impact dose calculation significantly. This is easily understood due to the relatively short path-lengths over which such intensity differences are sampled for beams traversing the pelvis for treatment planning. Future investigations will include possible recalibration of baseline intensity assignments to the bone and marrow classes to further improve agreement. Uncertainty in aligning MR images to CT images, which can be challenging in the pelvis due to the large deformation of soft tissues, variations in air distribution, and different filling status of organs such as bladder and rectum, complicates the direct evaluation of differences in intensity and dose. Also, the MRI scans used for this study had a shorter longitudinal field of view (FoV) than CT scans and the coverage of lumbar spine by the reference MR images was limited, and thus the bone model was not extended far superior to the pelvis. Further research will extend the FoV of MR scans as well as the coverage of lumbar spines by the bone shape model, as well as evaluate the usefulness of MRCT image volumes as references for image-guided patient positioning.
5. Conclusion
A method that generates pelvic MRCT using joint shape and intensity features from MR images has been presented and evaluated. Adding shape information to the intensity based fuzzy c-means classification scheme was shown to improve the classification accuracy effectively and eliminate the need for multiple imaging sequences, including the ultra-short TE sequence previously used for air identification in the head. The presented method has the potential to provide an accurate estimation of CT information and support MRI only radiotherapy.
Acknowledgments
This work was supported by NIH EB016079.
Footnotes
Some figures may appear in colour only in the online journal
References
- Chen L, Nguyen TB, Jones É, Chen Z, Luo W, Wang L, Price RA, Pollack A, Ma CM. Magnetic resonance-based treatment planning for prostate intensity-modulated radiotherapy: creation of digitally reconstructed radiographs. Int J Radiat Oncol Biol Phys. 2007;68:903–11. doi: 10.1016/j.ijrobp.2007.02.033. [DOI] [PubMed] [Google Scholar]
- Dowling JA, Lambert J, Parker J, Salvado O, Fripp J, Capp A, Wratten C, Denham JW, Greer PB. An atlas-based electron density mapping method for magnetic resonance imaging (MRI)-alone treatment planning and adaptive MRI-based prostate radiation therapy. Int J Radiat Oncol Biol Phys. 2012;83:e5–11. doi: 10.1016/j.ijrobp.2011.11.056. [DOI] [PubMed] [Google Scholar]
- Grodzki DM, Jakob PM, Heismann B. Ultrashort echo time imaging using pointwise encoding time reduction with radial acquisition (PETRA) Magn Reson Med. 2012;67:510–8. doi: 10.1002/mrm.23017. [DOI] [PubMed] [Google Scholar]
- Gudur MS, Hara W, Le QT, Wang L, Xing L, Li R. A unifying probabilistic Bayesian approach to derive electron density from MRI for radiation therapy treatment planning. Phys Med Biol. 2014;59:6595. doi: 10.1088/0031-9155/59/21/6595. [DOI] [PMC free article] [PubMed] [Google Scholar]
- Hsu SH, Cao Y, Huang K, Feng M, Balter JM. Investigation of a method for generating synthetic CT models from MRI scans of the head and neck for radiation therapy. Phys Med Biol. 2013;58:8419. doi: 10.1088/0031-9155/58/23/8419. [DOI] [PMC free article] [PubMed] [Google Scholar]
- Johansson A, Karlsson M, Nyholm T. CT substitute derived from MRI sequences with ultrashort echo time. Med Phys. 2011;38:2708–14. doi: 10.1118/1.3578928. [DOI] [PubMed] [Google Scholar]
- Juttukonda MR, Mersereau BG, Chen Y, Su Y, Rubin BG, Benzinger TL, Lalush DS, An H. MR-based attenuation correction for PET/MRI neurological studies with continuous-valued attenuation coefficients for bone through a conversion from R2* to CT-Hounsfield units. Neuroimage. 2015;112:160–8. doi: 10.1016/j.neuroimage.2015.03.009. [DOI] [PMC free article] [PubMed] [Google Scholar]
- Kapanen M, Tenhunen M. T1/T2*-weighted MRI provides clinically relevant pseudo-CT density data for the pelvic bones in MRI-only based radiotherapy treatment planning. Acta Oncol. 2013;52:612–8. doi: 10.3109/0284186X.2012.692883. [DOI] [PubMed] [Google Scholar]
- Kim J, Glide-Hurst C, Doemer A, Wen N, Movsas B, Chetty IJ. Implementation of a novel algorithm for generating synthetic CT images from magnetic resonance imaging data sets for prostate cancer radiation therapy. Int J Radiat Oncol Biol Phys. 2015;91:39–47. doi: 10.1016/j.ijrobp.2014.09.015. [DOI] [PubMed] [Google Scholar]
- Kim JH, Lee JS, Song IC, Lee DS. Comparison of segmentation-based attenuation correction methods for PET/MRI: evaluation of bone and liver standardized uptake value with oncologic PET/CT data. J Nucl Med. 2012;53:1878–82. doi: 10.2967/jnumed.112.104109. [DOI] [PubMed] [Google Scholar]
- Korhonen J, Kapanen M, Keyriläinen J, Seppälä T, Tenhunen M. A dual model HU conversion from MRI intensity values within and outside of bone segment for MRI-based radiotherapy treatment planning of prostate cancer. Med Phys. 2014;41:011704. doi: 10.1118/1.4842575. [DOI] [PubMed] [Google Scholar]
- Lambert J, Greer PB, Menk F, Patterson J, Parker J, Dahl K, Gupta S, Capp A, Wratten C, Tang C, Kumar M. MRI-guided prostate radiation therapy planning: investigation of dosimetric accuracy of MRI-based dose planning. Radiother Oncol. 2011;98:330–4. doi: 10.1016/j.radonc.2011.01.012. [DOI] [PubMed] [Google Scholar]
- Liu L, Cao Y, Fessler JA, Jolly S, Balter JM. A female pelvic bone shape model for air/bone separation in support of synthetic CT generation for radiation therapy. Phys Med Biol. 2015;61:169. doi: 10.1088/0031-9155/61/1/169. [DOI] [PMC free article] [PubMed] [Google Scholar]
- Noordam JC, Van Den Broek WH, Buydens LM. Multivariate image segmentation with cluster size insensitive fuzzy c-means. Chemometr Intell Lab Syst. 2002;64:65–78. [Google Scholar]
- Oh S, Stewart J, Moseley J, Kelly V, Lim K, Xie J, Fyles A, Brock KK, Lundin A, Rehbinder H, Milosevic M. Hybrid adaptive radiotherapy with on-line MRI in cervix cancer IMRT. Radiother Oncol. 2014;110:323–8. doi: 10.1016/j.radonc.2013.11.006. [DOI] [PubMed] [Google Scholar]
- Paradis E, Cao Y, Lawrence TS, Tsien C, Feng M, Vineberg K, Balter JM. Assessing the dosimetric accuracy of magnetic resonance-generated synthetic CT images for focal brain VMAT radiation therapy. Int J Radiat Oncol Biol Phys. 2015;93:1154–61. doi: 10.1016/j.ijrobp.2015.08.049. [DOI] [PMC free article] [PubMed] [Google Scholar]
- Paulus DH, Quick HH, Geppert C, Fenchel M, Zhan Y, Hermosillo G, Faul D, Boada F, Friedman KP, Koesters T. Whole-body PET/MR imaging: quantitative evaluation of a novel model-based MR attenuation correction method including bone. J Nucl Med. 2015;56:1061–6. doi: 10.2967/jnumed.115.156000. [DOI] [PMC free article] [PubMed] [Google Scholar]
- Robson MD, Bydder GM. Clinical ultrashort echo time imaging of bone and other connective tissues. NMR Biomed. 2006;19:765–80. doi: 10.1002/nbm.1100. [DOI] [PubMed] [Google Scholar]
- Rofsky NM, Lee VS, Laub G, Pollack MA, Krinsky GA, Thomasson D, Ambrosino MM, Weinreb JC. Abdominal MR imaging with a volumetric interpolated breath-hold examination. Radiology. 1999;212:876–84. doi: 10.1148/radiology.212.3.r99se34876. [DOI] [PubMed] [Google Scholar]
- Siversson C, Nordström F, Nilsson T, Nyholm T, Jonsson J, Gunnlaugsson A, Olsson LE. Technical note: MRI only prostate radiotherapy planning using the statistical decomposition algorithm. Med Phys. 2015;42:6090–7. doi: 10.1118/1.4931417. [DOI] [PubMed] [Google Scholar]
- Tustison NJ, Avants BB, Cook PA, Zheng Y, Egan A, Yushkevich PA, Gee JC. N4ITK: improved N3 bias correction. IEEE Trans Med Imaging. 2010;29:1310–20. doi: 10.1109/TMI.2010.2046908. [DOI] [PMC free article] [PubMed] [Google Scholar]
- Uh J, Merchant TE, Li Y, Li X, Hua C. MRI-based treatment planning with pseudo CT generated through atlas registration. Med Phys. 2014;41:051711. doi: 10.1118/1.4873315. [DOI] [PMC free article] [PubMed] [Google Scholar]
- Zheng W, Kim JP, Kadbi M, Movsas B, Chetty IJ, Glide-Hurst CK. Magnetic resonance-based automatic air segmentation for generation of synthetic computed tomography scans in the head region. Int J Radiat Oncol Biol Phys. 2015;93:497–506. doi: 10.1016/j.ijrobp.2015.07.001. [DOI] [PubMed] [Google Scholar]


