Abstract
A technique for generating MRI-derived synthetic CT volumes (MRCTs) is demonstrated in support of adaptive liver stereotactic body radiation therapy (SBRT). Under IRB approval, 16 subjects with hepatocellular carcinoma were scanned using a single MR pulse sequence (T1 Dixon). Air-containing voxels were identified by intensity thresholding on T1-weighted, water and fat images. The envelope of the anterior vertebral bodies was segmented from the fat image and fuzzy-C-means (FCM) was used to classify each non-air voxel as mid-density, lower-density, bone, or marrow in the abdomen, with only bone and marrow classified within the vertebral body envelope. MRCT volumes were created by integrating the product of the FCM class probability with its assigned class density for each voxel. MRCTs were deformably aligned with corresponding planning CTs and 2-ARC-SBRT-VMAT plans were optimized on MRCTs. Fluence was copied onto the CT density grids, dose recalculated, and compared. The liver, vertebral bodies, kidneys, spleen and cord had median Hounsfield unit differences of less than 60. Median target dose metrics were all within 0.1 Gy with maximum differences less than 0.5 Gy. OAR dose differences were similarly small (median: 0.03 Gy, std:0.26 Gy). Results demonstrate that MRCTs derived from a single abdominal imaging sequence are promising for use in SBRT dose calculation.
Keywords: MRI guided radiation therapy, synthetic CT, radiation oncology, liver stereotactic body radiation therapy
1. Introduction
Computed tomography (CT) is the standard tool in radiation oncology for generating patient models for target delineation, dose calculation, and image guidance. Due to the superior soft tissue contrast, however, magnetic resonance imaging (MRI), long an adjunct to CT-based treatment planning, is being increasingly used as a primary tool through the use of MRI simulators (Devic 2012, Cao et al 2013), Cobalt-60-MR systems (Acharya et al 2016), and emerging integrated MR-Linacs (Lagendijk et al 2008). In order to avoid requiring both CT and MRI imaging studies on each patient and to avoid introducing image registration errors, several groups have proposed methods for MRI only treatment planning by generating CT equivalent images from MRI data (synthetic CT or MRCT) (Beavis et al 1998, Lee et al 2003, Pasquier et al 2006, Johansson et al 2011, Hsu et al 2013). These methods are useful for streamlining MRI based treatment planning and providing reference images from MRI simulation for image-guided patient positioning with conventional linear accelerators (Nyholm et al 2009, Paradis et al 2015).
MRCT generation techniques have been developed in support of MR-only treatment planning in the brain (Beavis et al 1998, Paradis et al 2015), head and neck (Hsu et al 2013, 2015), and the pelvis (Pasquier et al 2006, Greer et al 2011, Dowling et al 2012, Kim et al 2015, Chen et al 2016). These methods include density assignment within manually drawn contours (Lee et al 2003, Jonsson et al 2010, Lambert et al 2011), registration-based methods that align patient MR images to an MR atlas with known electron densities (Dowling et al 2012, Uh et al 2014), and classification-based methods that assign electron densities based on a plurality of registered MR image volumes (Johansson et al 2011, Hsu et al 2013). More recently hybrid based methods have been explored that combine shape models and classification (Liu et al 2015).
Although MRCT generation techniques are relatively mature for many body sites, there has been limited work towards synthetic CT modeling in the abdomen. Breathing and peristaltic motion in the abdomen introduce significant complexities to the task of MRCT generation within this body site. Motion can cause artifacts within the long acquisition times used for many MR images and can cause difficulty in registration between MR images of the patient or with atlas images. These issues suggest a potential benefit for MRCT generation from single, short duration MR scans, without dependence on additional imaging sequences. Unfortunately, by limiting the number of acquired MR sequences, significant intensity overlap of bone and air lead to degeneracy in the tissue classification problem (Liu et al 2015). In the brain, additional MR information, such as ultrashort echo time imaging (Hsu et al 2015), has been used to remove some of this degeneracy. This solution is not generally convenient in the abdomen due to motion that can occur between imaging sequences. Instead of adding more MR imaging acquisition sequences, the degeneracy of tissue classification can be partially addressed by adding prior learned shape information. This technique was suggested by Liu et al (2015) for creating MRCTs in the pelvis. In that study, the region surrounding the pelvic bones was roughly identified on MR volumes using an active shape model. The resulting region was then used to identify spaces where air is not likely to reside, thereby allowing for bone-air separation with a single scan sequence.
This study provides a preliminary investigation in the development of an abdominal MRCT model using shape-aided intensity-based tissue classification with images from a single fast scanning sequence. An initial shape model is developed to begin to address issues of separating bone, specifically the space containing the anterior vertebral bodies, from other low intensity tissues found on the images (e.g. air and lung).
2. Methods
2.1. Patients
Under an Institutional Review Board-approved protocol, 16 subjects (13 male, 3 female, ages 51–83) underwent MRI simulation to investigate MRCT optimization. All subjects received liver stereotactic body radiation therapy (SBRT) for unresectable hepatocellular carcinoma. Images from four of the 16 subjects were used to optimize the MRCT technique (‘training subjects’) and all 16 cases were used for validation of the method.
2.2. Image data
Routine abdominal CT imaging was performed on each patient using our clinical CT simulator (Brilliance, Philips, Amsterdam, Netherlands) using 120 kVp and 305 mAs/slice. CT slice thickness was 3 mm and in-plane pixel sizes ranged from 0.88 to 1.37 mm. Exhale breath-hold CT simulation scans were performed on 11 of the 16 patients. The other 5 patients were imaged free breathing yielding amplitude-sorted 4DCT volumes as well as the untagged reconstruction. MR images were acquired using a large-bore 3 T MR scanner (Skyra, Siemens Healthineers, Erlangen, Germany). The MR imaging protocol included a 3D gradient dual-echo sequence (Dixon 1984, Ma 2004) with TR = 4.22 ms, TE1 = 1.23 ms, TE2 = 2.46 ms, flip angle = 9°, Matrix = 288 × 288 pixels, field of view = 500 × 500 mm, slice thickness = 3 mm, and BW = 960 Hz/pixel. This 19 s sequence was performed at exhale breath hold for all subjects and produced in-phase and out-of-phase images, from which water and fat images were calculated. The in-phase, water and fat images were used as input data for MRCT generation.
2.3. Preliminary analyses
For each patient, the anonymized MR image volumes were bias-field corrected using the N4ITK method of Tustison et al (2010) available in the open source SLICER software package (Surgical Processing Laboratory, Brigham and Women’s Hospital, Boston, MA). Subsequent processing, including intensity normalization, thresholding, shape model development and MRCT generation (all described below) were performed using MATLAB (Natick, MA). MR images were normalized to the mean intensity of the in-phase (T1-weighted) MR image volume. The patient’s external contour volume was segmented from the in-phase T1 weighted image via an intensity threshold (table 1). Internal holes were filled and morphological operations (erosion and dilation) were applied to the external contour volume to eliminate stray voxels.
Table 1.
Parameter values used in MRCT generation algorithm.
| Parameter | Value |
|---|---|
| Body contour threshold | 0.15 |
| Normalized fat image air/lung threshold | 0.16 |
| Normalized water image air/lung threshold | 0.32 |
| Normalized T1W image air/lung threshold | 0.32 |
| Mid-density class HU assignment | 75 |
| Lower-density class HU assignment | −50 |
| Bone class HU assignment | 350 |
| Marrow class HU assignment | 150 |
| Air/lung HU assignment | −650 |
Preliminary analyses were performed on the 4 training subjects to evaluate the capability of each MR image contrast type to differentiate between tissue types. Regions of interest (ROIs) were defined in spatially corresponding locations between MR and CT images. These ROIs contained primarily one tissue type each: 1. lung, 2. fat, 3. liver, 4. trabecular bone, and 5. cortical bone. The distribution of normalized MR grey levels for each type of contrast was plotted as a function of average CT number for each tissue type. This analysis aided in both the identification of grey level thresholds for air as well as assignment of appropriate CT numbers for various tissue types following classification (described below).
The lung parenchyma and gas in the bowel had significant intensity overlap on MR images, and thus they were identified as a common volume by application of intensity thresholds. The threshold for air/lung identification on each of the three image types was found empirically using the 4 training volumes (table 1).
2.4. Anterior vertebral body model
From the in-phase, fat and water images, bone could not be sufficiently separated from air or lung tissue by image intensity alone. To begin to address this issue, we investigated the first phase of a shape-based method to aid identification of the anterior vertebral bodies on MR images of the abdomen. The technique was based on the previously published work of Peng et al (2005) and Huang et al (2009) who designed algorithms to segment and extract contours of vertebrae from whole spine MR images in order to automate routine radiological tasks such as intervertebral disc disease detection.
We developed a 2-part model of the anterior vertebral column using the images from the 4 training subjects. The first part of the model assumes that vertebral bodies have spatially periodic gradients that have a dominant cranial-caudal direction in the fat image volumes. The second part of the model assumes that the vertebral bodies follow a quadratic trajectory through the abdomen in the superior–inferior direction. The fat image alone was used throughout this process due to the high contrast between the fatty vertebral body marrow and the vertebral discs, which contain mostly water.
Periodic strong edges in the cranial-caudal direction were found by first calculating the 3D gradient vector of the fat image (figures 1(A) and (B)). Candidate vertebral body edge voxels were modeled to contain a gradient vector with a directional cosine with magnitude greater than 0.7. This effectively filtered out voxels within the body volume that did not contain a gradient directed along the cranial-caudal axis ±45°. Gradients directed within these angles were used in order to account for tipping of the vertebral bodies in any dimension. Many voxels outside of the vertebral column matched these criteria, notably the liver dome which contained very strong cranially directed gradients. In order to remove many of these erroneous voxels, voxel locations were searched superior and inferior to each candidate for a gradient in the opposite direction. Since vertebral bodies are roughly regularly spaced, we limited this search to a 1.5 cm distance. Voxels that had a nearby oppositely directed gradient in this space were considered candidates for locations of vertebral body edges.
Figure 1.
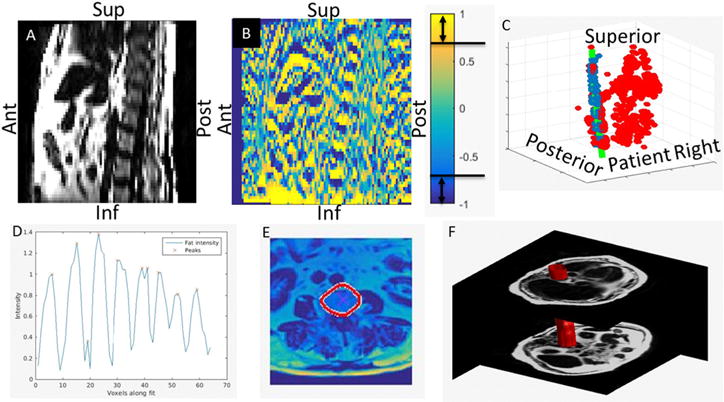
Sagittal plane of a fat image (A) shown side by side with the axial gradient of the same section (B). Gradient voxels containing directional cosine magnitudes greater than 0.7 are considered candidate vertebral body edges. The collection of candidate voxels (all points in (C)) are fit by a 3D quadratic shape model using RANSAC (green line in (C)). In panel (C), the inliers are colored blue and the outliers are colored red. The maxima of the fat image are then identified along the curve fit (D). These positions are then used as starting points for an active contour algorithm to expand to the edges of the vertebral bodies (E). The vertebral body envelope is created by interpolating each of the vertebral body contours in the superior–inferior direction (F).
The candidate voxel locations were then fit by a 3D parametrized quadratic function where the parameter was the position along the superior–inferior axis. Due to the large number of outlying voxels initially identified as possible candidates, the six coefficients of the 3D quadratic were fit to the candidate voxel locations using the RANSAC technique (Fischler and Bolles 1981) (figure 1(C)). During the fit, each coefficient was constrained to fall within a range that was identified based on data from the 4 training subjects. The resulting 3D curve is assumed to fall within the space occupied by the anterior vertebral bodies.
Candidate voxels following the curve were searched for intensity peaks in the fat image to identify the rough centers of each vertebral body (figure 1(D)). Using these center positions as seed points, a geodesic active contours (Caselles et al 1997) algorithm was then used to find the outline of the vertebral body in each axial cut of the fat image containing a peak along the parametric quadratic curve (figure 1(E)). The implementation of geodesic active contours available in the MATLAB image processing toolbox was used with a max iteration number of 35, a contraction bias of −1.6, and a smoothness factor of 1.5. These contours were then interpolated in the superior–inferior direction in order to identify the volume that likely contained the anterior vertebrae (figure 1(F)). This volume was then used as input to a 2-region FCM classification method described in the section below.
2.5. MRCT generation
Voxel-based classification was performed using a modified version of the FCM algorithm described by Hsu et al (2013). In the current investigation, four image contrasts are used for classification: T1-weighted, water, fat, and the magnitude of the gradient of the fat image. From these input volumes 4 tissue classes are generated: mid-density, lower-density, bone and marrow. In order to overcome the significant degeneracy of tissue intensity overlap in these images of the abdomen, the original FCM method of Hsu et al (2013) was modified by constraining certain classes to exist only within specific regions of the image. Specifically, bone and marrow classes were defined and constrained to exist within the segmented vertebral body volume. In addition, we further modified the original technique to only use a limited set of input images for classification within a given region. Specifically, we used the gradient of the fat image for classification within the segmented vertebral body volume, but not for the space outside this region. Cluster centroid positions in the 4D feature space were established based on our 4 training patients. The same centroids were then used for the remaining 12 patients.
MRCT volumes were created by integrating the product of the FCM class probability with the assigned class density for each voxel. HU values assigned to each class, as well as the air/lung intensity thresholds (on a scale of 0–1 following intensity normalization of images), are shown in table 1. The intensity value for air was selected to match measured CT intensities of the lower lung.
2.6. MRCT validation
All MRCT image volumes were aligned with their corresponding treatment planning CT images using a commercial software package (VelocityAI 3.1.0, Varian Medical Systems, Palo Alto). Manual rigid registration was applied to align the surface of the liver, prioritizing surface alignment proximal to the target. Alignment was refined using single pass ROI constrained deformable alignment. All transverse slices of the body containing the liver were included in the rectilinear ROI. The deformable alignment was constrained to enforce image continuity at the ROI boundary. The HU values assigned to the MRCT were validated by computing the mean absolute error (MAE) between the MRCT and CT for corresponding tissue in 6 different organs (Cord, Kidneys, Liver, Spleen, Lung, and the Anterior Vertebral Bodies).
Aligned MRCTs (interpolated to match voxels of corresponding treatment planning CT images) were then imported into our treatment planning system (Eclipse 13.6, Varian Medical Systems, Palo Alto, CA). The original patient structure sets containing all OARs and target structures were copied onto the MRCTs. 2-arc VMAT plans were created and optimized in order to meet the goals set forth in the original clinical treatment patient planning directives. All subjects were prescribed to be treated in 5 fractions. Three patients were prescribed a total dose of 50 Gy and 13 patients were prescribed a total of 60 Gy. The VMAT plans were optimized using the MRCT-derived density grid for dose calculation. Dose was calculated with the AAA algorithm. Upon review following optimization, each plan was deemed clinically acceptable. In order to study the impact of density grid differences between MRCT and CT values for treatment planning, the fluence from the plan optimized on MRCT was copied onto the planning CT and dose was recalculated (yielding a tMRCT dose distribution). Clinically relevant DVH metrics were extracted from MRCT and tMRCT dose calculations for each plan for comparison.
3. Results
Figure 2 depicts the relationship between Dixon-derived image intensities and CT Hounsfield units (HU) in the abdomen. These distributions show that there is significant overlap in MR grey level values throughout the range of HU values causing degeneracy in the classification task.
Figure 2.
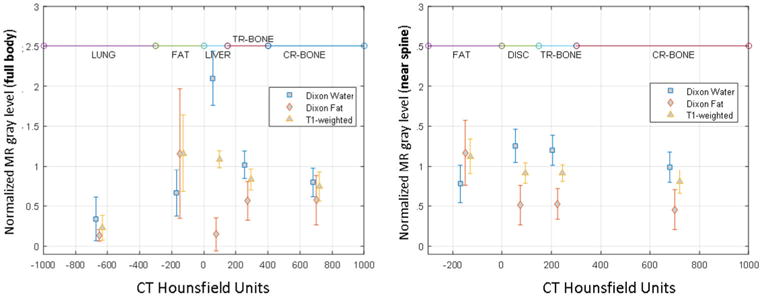
Distribution of normalized MR grey levels as a function of Hounsfield units within the full body and within a region surrounding the spine with a 1 cm outer margin. These plots show significant degeneracy between bone and fat causing standard FCM classification methods to misclassify some tissue as bone. DISC = vertebral disc fluid, TR-BONE = trabecular bone, CR-BONE = cortical bone.
The inputs and outputs of the FCM classifier are shown in figures 3(A) and (B) respectively. T1-weighted, water, and fat images were used as FCM input. Additionally, the magnitude of the gradient of the fat image, |grad(Fat)|, was used as input to FCM only within the segmented bone volume. The FCM outputs, shown in figure 3(B), are probability density maps where grey level indicates the probability that a given voxel belongs to a given class. The mid and low-density classes are shown on the lower-left while bone and marrow classes are shown on the lower-right. Zoomed-in versions of the |grad(Fat)|, bone and marrow are displayed as insets. The mid-density class included tissues of the liver, heart, spleen and muscle, while the lower density class contained mostly fatty tissue. The bone class was more prevalent at the edges of the vertebral bodies with the marrow class more concentrated in the center of the vertebral body volume.
Figure 3.
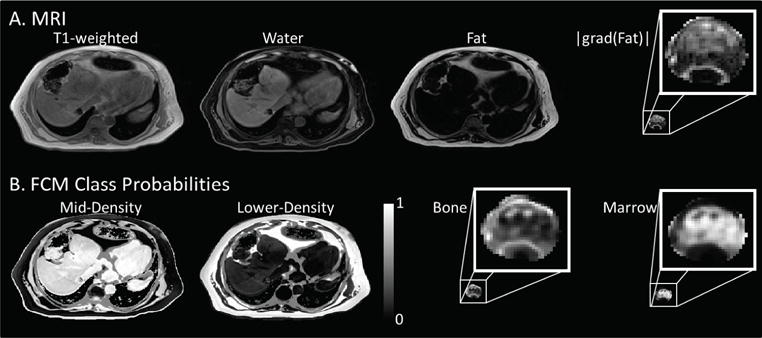
The Dixon T1-weighted, water, fat, and the magnitude of the gradient of the fat image (A) were used as inputs to generate the FCM class probabilities mid-density, lower-density, bone and marrow (B). The |grad(Fat)| image was only used for classification inside the segmented bone volume. Similarly, the bone and marrow classes were constrained to exist only within the segmented volume.
A side-by-side comparison of similarly windowed MRCT and CT images is shown in figure 4 along with the corresponding water MRI image. The MRCT image volumes do not show erroneously labeled bone throughout the abdomen. Unfortunately, however, bone in regions outside of the anterior vertebral bodies is improperly classified as mid- and lower-density tissue. The effect of this can be observed as the lack of bone in the ribs observed by comparing the axial sections of figures 4(B) and (C). Bone is also missing from the MRCT in the spinous processes and sternum, evident in figures 4(E) and (F). The HU values of the anterior vertebral bodies are fairly well represented in the MRCT compared to the CT. Bowel gas distribution was different between the MRCT and CT as would be expected because images were taken hours to days apart and the deformable registration method used is not capable of inserting/removing intensities that do not exist in paired images.
Figure 4.
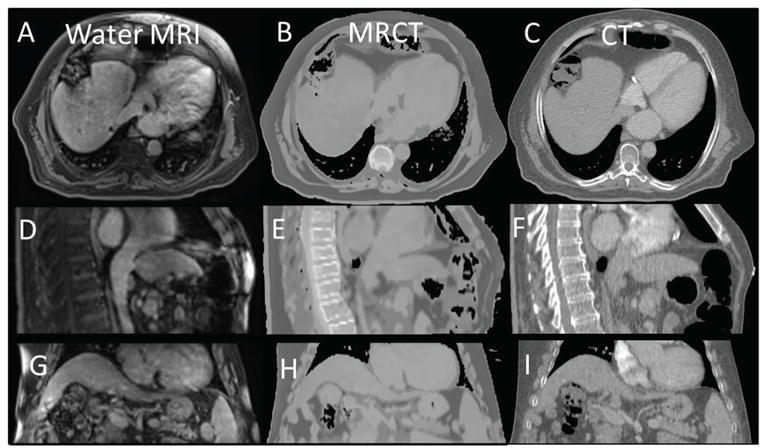
Co-registered axial, sagittal, and coronal views of the water MRI ((A), (D) and (G)) shown side by side with similarly windowed MRCTs ((B), (E) and (H)) and standard CTs ((C), (F) and (I)).
MAE between MRCT and CT were measured by taking the absolute value of the difference between the mean MRCT HU values and the mean CT HU values within manually selected ROIs. Each ROI was contoured to be within the center of a given organ purposely avoiding organ edges where slight misalignments could cause large changes. The distribution of HU differences across all 16 patients (figure 5) were found to be within the range of what has been reported in previous studies (Paradis et al 2015).
Figure 5.
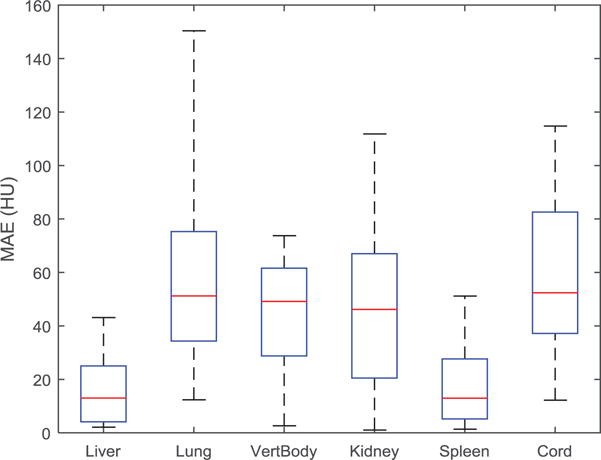
Mean absolute error (MAE) between MRCT and CT HU values for manually created contours within the boundaries of various tissue types across all patients. Box and whisker plots show the median (center-line), 75% (top of box), 25% (bottom of box), max and min (dashed line).
Figure 6 compares MRCT and tMRCT dose distributions for a target near to the rib cage. The dose distributions appear visually to be very similar. There is a 0.5% higher hot spot in the tMRCT dose calculation, however the shape of both the high and low dose distributions are quite similar. The DVH plots (figure 6(C)) show that the difference in PTV, chest wall, and liver DVHs are minimal. Although only 3 DVH curves are shown, all other OARs showed similar agreement.
Figure 6.
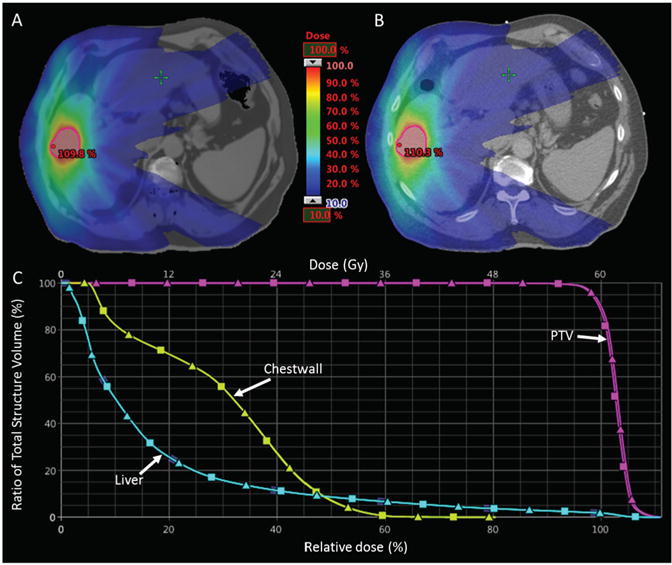
Relative dose distributions optimized on MRCT (A) and recalculated on standard CT (B). The DVH curves for the PTV, Chest wall and Liver are shown in the bottom panel (C) where MRCT DVHs are represented by squares and CT DVHs are triangles. Note the close proximity of the rib relative to the target (outlined in red).
Differences in PTV dose metrics for all 16 patients are shown in figure 7(A). The absolute target dose differences between MRCT and CT are within clinically acceptable ranges (Median: ±0.17 Gy, Max: ±0.81 Gy). The absolute dose differences for a selection of OARs with dose limits described in the treatment planning directives for the subjects, are shown in figure 7(B). Median OAR dose differences were all within ±0.05 Gy while maximum differences were less than 0.6 Gy.
Figure 7.
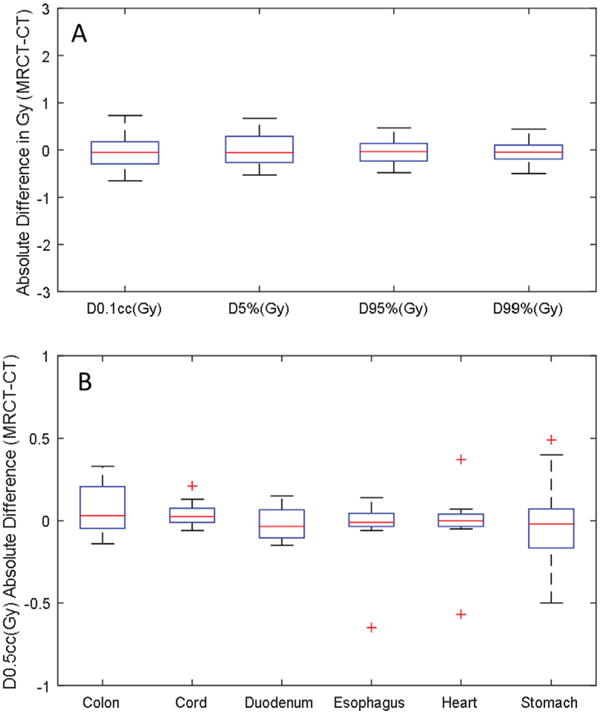
Clinically relevant DVH metric comparison for the PTVs (A) and OARs (B) for all 16 subjects. Outliers of the distributions are shown as plus signs.
4. Discussion
The creation of a CT density map based on information from MR images has clinical utility for improving workflows by avoiding the need for a separate treatment planning CT scan. This is particularly useful when patients are undergoing multiple MR imaging sessions during the course of treatment (e.g. for quantitative imaging-based adaptive radiation therapy). Eliminating a treatment planning CT scan also has the added benefit of reducing the complexity of managing disparate patient representations. In this study, a method for creating MRCTs in the abdomen was developed using only a Dixon MRI sequence. MRCTs were created for 16 patients using this method. Attenuation properties were compared between MRCT and CT. Dose distributions were then calculated on both MRCT and CT density grids and dose metrics were compared between the two distributions. We found that HU differences between MRCT and CT were within a similar range to what has been reported in the brain (Paradis et al 2015) and pelvis (Chen et al 2016). Dose calculated on MRCT was found to be clinically equivalent to dose calculated on CT as measured by dose metrics that the physicians requested to constrain and optimize clinical treatment plans for the subjects investigated. The agreement of these dose parameters between MRCT and tMRCT calculations suggests that synthetic CT representations of the abdomen using this technique are sufficient to support intrahepatic stereotactic treatment planning.
The MRCT generation technique described here is well suited to the abdominal region because it does not rely on registration. Motion due to breathing and mobile bowel gas complicates deformable alignment that would likely be needed to apply previously published techniques (Dowling et al 2012, Hsu et al 2013) to the abdomen. The Dixon sequence is advantageous because it provides three effectively co-registered volumes that have differential contrast. The advantages to the Dixon technique have been recognized and applied to MRCT generation in the pelvis (Liu et al 2015, Tyagi et al 2016), however no studies have been published to date that apply this technique in the abdomen. The contrast variations provided by the Dixon sequence allow for the separation of different tissue types. In order to begin to address the significant challenge of identifying bones to avoid their misclassification as air, we have developed a simple method for identifying the likely location of the anterior vertebral bodies in the abdomen, and then used this information to constrain FCM classification.
While we have eliminated most spurious bone identification by this technique, there remains room for future improvement by identifying spinous processes and ribs. Ignoring the ribs and spinous processes in our MRCT volumes did not appear to reduce dose calculation accuracy significantly, likely due to planning for SBRT, which uses entry from multiple points, thus minimizing the contribution of the potential dose differences due to attenuation through the ribs. The more important concern with these missing structures may be for image guidance. Future work will include extension of the abdominal MRCT method to include most abdominal bones, exploring ultra-short echo time imaging sequences for abdominal bone identification, evaluation of accuracy of alignment with CT-based image guidance, and development of a contouring paradigm with evaluation of resulting contouring accuracy on acquired MR images as well as generated MRCT volumes. Finally, biliary stents can produce signal voids in MR images and cause tissue misclassifications with this method, the effects of which will be evaluated in future studies.
5. Conclusion
Synthetic CT image volumes generated from a single abdominal imaging sequence are promising for use in SBRT dose calculation. Our work validating the use of MRCT for image guidance is on-going. Future work will focus on extending models to better define bones in the upper abdomen as well as development and evaluation of a complete MR-only simulation and treatment planning paradigm.
Acknowledgments
This research was supported by NIHR01EB016079 and NIH1L30CA199594-01.
Footnotes
Some figures may appear in colour only in the online journal
References
- Acharya S, et al. Online magnetic resonance image guided adaptive radiation therapy: first clinical applications. Int J Radiat Oncol. 2016;94:394–403. doi: 10.1016/j.ijrobp.2015.10.015. [DOI] [PubMed] [Google Scholar]
- Beavis AW, Gibbs P, Dealey RA, Whitton VJ. Radiotherapy treatment planning of brain tumours using MRI alone. Br J Radiol. 1998;71:544–8. doi: 10.1259/bjr.71.845.9691900. [DOI] [PubMed] [Google Scholar]
- Cao Y, et al. Prediction of liver function by using magnetic resonance-based portal venous perfusion imaging. Int J Radiat Oncol Biol Phys. 2013;85:258–63. doi: 10.1016/j.ijrobp.2012.02.037. [DOI] [PMC free article] [PubMed] [Google Scholar]
- Caselles V, Kimmel R, Sapiro G. Geodesic active contours. Int J Comput Vis. 1997;22:61–79. [Google Scholar]
- Chen S, Quan H, Qin A, Yee S, Yan D. MR image-based synthetic CT for IMRT prostate treatment planning and CBCT image-guided localization. J Appl Clin Med Phys. 2016;17:236–45. doi: 10.1120/jacmp.v17i3.6065. [DOI] [PMC free article] [PubMed] [Google Scholar]
- Devic S. MRI simulation for radiotherapy treatment planning. Med Phys. 2012;39:6701–11. doi: 10.1118/1.4758068. [DOI] [PubMed] [Google Scholar]
- Dixon WT. Simple proton spectroscopic imaging. Radiology. 1984;153:189–94. doi: 10.1148/radiology.153.1.6089263. [DOI] [PubMed] [Google Scholar]
- Dowling JA, Lambert J, Parker J, Salvado O, Fripp J, Capp A, Wratten C, Denham JW, Greer PB. An atlas-based electron density mapping method for magnetic resonance imaging (MRI)-alone treatment planning and adaptive MRI-based prostate radiation therapy. Int J Radiat Oncol Biol Phys. 2012;83:e5–11. doi: 10.1016/j.ijrobp.2011.11.056. [DOI] [PubMed] [Google Scholar]
- Fischler MA, Bolles RC. Random sample consensus: a paradigm for model fitting with applications to image analysis and automated cartography. Commun ACM. 1981;24:381–95. [Google Scholar]
- Greer PB, Dowling JA, Lambert JA, Fripp J, Parker J, Denham JW, Wratten C, Capp A, Salvado O. A magnetic resonance imaging-based workflow for planning radiation therapy for prostate cancer. Med J Aust. 2011;194:S24–7. doi: 10.5694/j.1326-5377.2011.tb02939.x. [DOI] [PubMed] [Google Scholar]
- Hsu S-H, Cao Y, Huang K, Feng M, Balter JM. Investigation of a method for generating synthetic CT models from MRI scans of the head and neck for radiation therapy. Phys Med Biol. 2013;58:8419–35. doi: 10.1088/0031-9155/58/23/8419. [DOI] [PMC free article] [PubMed] [Google Scholar]
- Hsu S-H, Cao Y, Lawrence TS, Tsien C, Feng M, Grodzki DM, Balter JM. Quantitative characterizations of ultrashort echo (UTE) images for supporting air-bone separation in the head. Phys Med Biol. 2015;60:2869–80. doi: 10.1088/0031-9155/60/7/2869. [DOI] [PMC free article] [PubMed] [Google Scholar]
- Huang SH, Chu YH, Lai SH, Novak CL. Learning-based vertebra detection and iterative normalized-cut segmentation for spinal MRI. IEEE Trans Med Imaging. 2009;28:1595–605. doi: 10.1109/TMI.2009.2023362. [DOI] [PubMed] [Google Scholar]
- Johansson A, Karlsson M, Nyholm T. CT substitute derived from MRI sequences with ultrashort echo time. Med Phys. 2011;38:2708–14. doi: 10.1118/1.3578928. [DOI] [PubMed] [Google Scholar]
- Jonsson JH, Karlsson MG, Karlsson M, Nyholm T. Treatment planning using MRI data: an analysis of the dose calculation accuracy for different treatment regions. Radiat Oncol. 2010;5:62. doi: 10.1186/1748-717X-5-62. [DOI] [PMC free article] [PubMed] [Google Scholar]
- Kim J, Garbarino K, Schultz L, Levin K, Movsas B, Siddiqui MS, Chetty IJ, Glide-Hurst C. Dosimetric evaluation of synthetic CT relative to bulk density assignment-based magnetic resonance-only approaches for prostate radiotherapy. Radiat Oncol. 2015;10:239. doi: 10.1186/s13014-015-0549-7. [DOI] [PMC free article] [PubMed] [Google Scholar]
- Lagendijk JJW, et al. MRI/linac integration. Radiother Oncol. 2008;86:25–9. doi: 10.1016/j.radonc.2007.10.034. [DOI] [PubMed] [Google Scholar]
- Lambert J, et al. MRI-guided prostate radiation therapy planning: investigation of dosimetric accuracy of MRI-based dose planning. Radiother Oncol. 2011;98:330–4. doi: 10.1016/j.radonc.2011.01.012. [DOI] [PubMed] [Google Scholar]
- Lee YK, Bollet M, Charles-Edwards G, Flower MA, Leach MO, McNair H, Moore E, Rowbottom C, Webb S. Radiotherapy treatment planning of prostate cancer using magnetic resonance imaging alone. Radiother Oncol. 2003;66:203–16. doi: 10.1016/s0167-8140(02)00440-1. [DOI] [PubMed] [Google Scholar]
- Liu L, Cao Y, Fessler JA, Jolly S, Balter JM. A female pelvic bone shape model for air/bone separation in support of synthetic CT generation for radiation therapy. Phys Med Biol. 2015;61:169–82. doi: 10.1088/0031-9155/61/1/169. [DOI] [PMC free article] [PubMed] [Google Scholar]
- Ma J. Breath-hold water and fat imaging using a dual-echo two-point Dixon technique with an efficient and robust phase-correction algorithm. Magn Reson Med. 2004;52:415–9. doi: 10.1002/mrm.20146. [DOI] [PubMed] [Google Scholar]
- Nyholm T, Nyberg M, Karlsson MG, Karlsson M. Systematisation of spatial uncertainties for comparison between a MR and a CT-based radiotherapy workflow for prostate treatments. Radiat Oncol. 2009;4:54. doi: 10.1186/1748-717X-4-54. [DOI] [PMC free article] [PubMed] [Google Scholar]
- Paradis E, Cao Y, Lawrence TS, Tsien C, Feng M, Vineberg K, Balter JM. Assessing the dosimetric accuracy of magnetic resonance-generated synthetic CT images for focal brain VMAT radiation therapy. Int J Radiat Oncol Biol Phys. 2015;93:1154–61. doi: 10.1016/j.ijrobp.2015.08.049. [DOI] [PMC free article] [PubMed] [Google Scholar]
- Pasquier D, Betrouni N, Vermandel M, Lacornerie T, Lartigau E, Rousseau J. MRI alone simulation for conformal radiation therapy of prostate cancer: technical aspects. Int Conf of the IEEE Engineering in Medicine and Biology Society. 2006 doi: 10.1109/IEMBS.2006.260341. ( https://doi.org/10.1109/IEMBS.2006.260341) [DOI] [PubMed]
- Peng Z, Zhong J, Wee W, Lee J-H. Automated vertebra detection and segmentation from the whole spine MR images. IEEE Engineering in Medicine and Biology. 2005;3:2527–30. doi: 10.1109/IEMBS.2005.1616983. [DOI] [PubMed] [Google Scholar]
- Tustison NJ, Avants BB, Cook PA, Egan A, Yushkevich PA, Gee JC. N4ITK: improved N3 bias correction. IEEE Trans Med Imaging. 2010;29:1310–20. doi: 10.1109/TMI.2010.2046908. [DOI] [PMC free article] [PubMed] [Google Scholar]
- Tyagi N, Zhang J, Happersett L, Kadbi M, Mechalakos J, Deasy J, Hunt M. SU-G-JeP2-06:dosimetric and workflow evaluation of first commercial synthetic CT software for clinical use in pelvis. Med Phys. 2016;43:3660. doi: 10.1088/1361-6560/aa5452. [DOI] [PMC free article] [PubMed] [Google Scholar]
- Uh J, Merchant TE, Li Y, Li X, Hua C. MRI-based treatment planning with pseudo CT generated through atlas registration. Med Phys. 2014;41:051711. doi: 10.1118/1.4873315. [DOI] [PMC free article] [PubMed] [Google Scholar]


